
Reports
Reports
Analysts’ Viewpoint on Sales Enablement Software Market Scenario
Organizations are leveraging new technologies and strategies in order to remain competitive and maintain sustainability of their businesses. In the modern era, buyers have become more independent and expect a quality buying experience. Organizations sometimes find it difficult to provide such customer experience through regular sales and marketing engagements. Sales enablement helps resolve this issue. Sales enablement refers to a process of providing content, information, tools, and guidance to salespersons (commonly called sales representatives or reps) to engage buyers. More than 60% of organizations implement sales enablement strategies to diversify their business; of these, over 71% belong to the telecommunications & technology and financial services sectors. Companies should capitalize on this opportunity to boost sales in key revenue generating industries such as the BFSI, e-commerce, and entertainment to revive market growth post COVID-19.
Sales enablement is the process of facilitating sales representatives with the right content, tools, knowledge, and information to help close a deal successfully. The right sales enablement content and tools enable sales reps to target the right customers and increase customer engagement. The sales enablement process helps accelerate sales, gather relevant data, and increase collaboration between teams to improve overall productivity.
Sales enablement software provides data, resources, training, and visibility throughout the sales content lifecycle. It also helps sales reps to successfully sell products by combining sales operations such as business intelligence, content analytics, customer experience, CRM, gamification, automation, and sales analytics.
Increase in penetration of sales enablement software is driving the sales enablement software market. Technology organizations are using sales enablement tools to generate B2B leads. Organizations need a dedicated sales team to put their product and services in front of a prospect and illustrate how it would help them scale their business.
Various organizations are looking to leverage advanced sales enablement solutions. Integration of advanced technology such as Artificial Intelligence (AI) and data science & analytics in existing sales enablement may accelerate the penetration of sales enablement. For instance, the machine learning technology is being increasingly used in digital banking platforms. AI-based sales enablement tools would be able to retrieve sales-related data to provide focused, real-time advice to sales reps.
LinkedIn published a report based on a survey conducted on 721 sales representatives in 2018. The report stated that sales reps spent 65% of their time on activities such as customer data entry in CRM software, writing emails manually, searching for sales collaterals, and collaborating with the marketing team for content and collaterals.
Majority of salespeople rely on cold calling leads supplied by data management firms. Often, they end up talking to the people who are not interested in the product. The opportunity-to-deal conversion rate is lower than the lead-to-opportunity rate. Several sales companies use sales collateral management as a standard procedure. According to the 2019 Forrester report, one of the biggest challenges for sales teams is to find the right content and information. The content is often haywire, duplicate, and out-of-date.
The sales enablement program provides sales representatives the tools and optimization they need to successfully close a sales deal. This software serves as a sales repository or sales playbook, as it provides information including marketing collateral and tools such as lead engagement tools, knowledge management solutions, content libraries, contact and sales management tools, and templates to help sales reps understand customers and their requirements.
Sales enablement tools reduce low-value and repetitive activities by 23% by optimizing workflows, integrating with other sales enablement tools, automating admin tasks, and facilitating better external and internal communications.
According to the 2021 State of E-commerce Distribution: Part 2 report, sales reps such as field sales reps and customer service reps are highly effective in increasing demand for an e-commerce channel for majority of distributors. The report also stated that field sales reps are the leading source for the adoption of an e-commerce platform. 20% of distributors also stated that lack of sales rep support was an issue, and many distributors may not realize the scale of the problem as B2B e-commerce is still comparatively immature. E-commerce provides the tools for sales enablement. It also provides the content in the form of product catalogs. This allows well-trained salespeople to challenge and educate buyers. Data available on e-commerce platforms helps provide optimized product mix and surety that customers will receive relevant insights from sales reps.
Sales enablement software assists marketing teams in making sales and closing deals with customers. Sales and marketing persons need digital and physical resources to sell products efficiently. Sales enablement software helps develop resources that enable sales teams to support buyers throughout the sales cycle. These resources enable the marketing team to drive potential customers through the order fulfillment process.
Sales enablement software also enables e-commerce to develop and manage content from a single location. Additionally, sales enablement software provides features such as advertising campaigns, client lists, and lead tracking. It enables e-commerce merchants to create training material and arrange all levels of an online sales structure by integrating with CRM.
North America is expected to hold prominent share of the sales enablement software market by the end of 2022. Businesses are focusing on providing the best products and services to stay ahead in the highly competitive market in the region. Buying behavior of customers has changed due to the increase in adoption of mobile devices, Internet, and communication devices. Sales representatives need to approach customers with relevant content and resources to engage them at the right time so that organizations sustain themselves in the intensely competitive market.
The sales enablement software market in Asia Pacific is expected to grow at a notable CAGR during the forecast period owing to the rapid economic growth and rise in adoption of advanced technologies to improve business operations in the region.
Sales enablement software, backed with AI, is expected to be extensively adopted by organizations in the next few years, owing to its wide range of capabilities and benefits offered. AI solutions provide relevant information in real-time to sales reps, cutting the time required for content search and utilizing it to enhance sales by automating tasks such as email routing, account updates, support resolutions, and document uploading. These features are expected to gain prominence in the near future. In turn, providers of sales enablement technology are likely to witness an increase in sales in the near future.
Prominent players operating in the global sales enablement software market are SAP SE, Highspot, Agile CRM, verbTEAMS, Upland Software, Inc., Seismic, Bigtincan, Holdings Limited, Mindtickle Inc., Showpad, Accent Technologies, Inc., Mindmatrix Inc., Pipelinersales, Inc., Zoho Corporation Pvt. Ltd., SalesHood Inc., and Oracle.
Each of these players has been profiled in the sales enablement software market report based on parameters such as company overview, financial overview, business strategies, product portfolio, business segments, and recent developments.
|
Attribute |
Detail |
|
Market Size Value in 2021 |
US$ 2.0 Bn |
|
Market Forecast Value in 2031 |
US$ 11.55 Bn |
|
Growth Rate (CAGR) |
19.4% |
|
Forecast Period |
2022–2031 |
|
Historical Data Available for |
2017–2020 |
|
Quantitative Units |
US$ Bn for Value |
|
Market Analysis |
Includes cross segment analysis at global as well as regional level. Furthermore, qualitative analysis includes drivers, restraints, opportunities, key trends, Porter’s Five Forces analysis, value chain analysis, and key trend analysis. |
|
Competition Landscape |
|
|
Format |
Electronic (PDF) + Excel |
|
Market Segmentation |
|
|
Regions Covered |
|
|
Countries Covered |
|
|
Companies Profiled |
|
|
Customization Scope |
Available upon request |
|
Pricing |
Available upon request |
The sales enablement software market stood at US$ 2.0 Bn in 2021.
The sales enablement software market is estimated to grow at a CAGR of 19.4% during the forecast period.
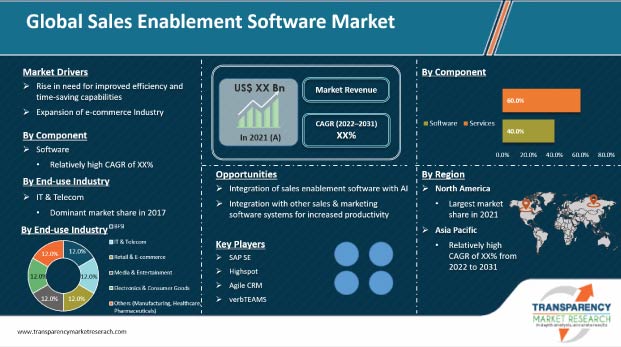
Rise in need for improved efficiency and time-saving capabilities; and growth of e-commerce industry are the major factors driving the market.
The IT & Telecom segment accounted for the largest share of the sales enablement software market in 2021.
Asia Pacific is a more attractive region for vendors in the sales enablement software market.
Key players operating in the sales enablement software market include SAP SE, Highspot, Agile CRM, verbTEAMS, Upland Software, Inc., Seismic, Bigtincan, Holdings Limited, Mindtickle Inc., Showpad, Accent Technologies, Inc., Mindmatrix Inc., Pipelinersales, Inc., Zoho Corporation Pvt. Ltd., SalesHood Inc., and Oracle.
1. Preface
1.1. Market Introduction
1.2. Market Segmentation
1.3. Key Research Objectives
2. Assumptions and Research Methodology
2.1. Research Methodology
2.1.1. List of Primary and Secondary Sources
2.2. Key Assumptions for Data Modelling
3. Executive Summary: Global Sales Enablement Software Market
4. Market Overview
4.1. Market Definition
4.2. Technology/ Product Roadmap
4.3. Market Factor Analysis
4.3.1. Forecast Factors
4.3.2. Ecosystem/ Value Chain Analysis
4.3.3. Market Dynamics (Growth Influencers)
4.3.3.1. Drivers
4.3.3.2. Restraints
4.3.3.3. Opportunities
4.3.3.4. Impact Analysis of Drivers and Restraints
4.4. COVID-19 Impact Analysis
4.4.1. Impact of COVID-19 on the Sales Enablement Software Market
4.4.2. End-use Industry Sentiment Analysis: Comparative Analysis on Spending
4.4.2.1. Increase in Spending
4.4.2.2. Decrease in Spending
4.4.3. Short Term and Long Term Impact on the Market
4.5. Market Opportunity Assessment – by Region (North America/ Europe/ Asia Pacific/ Middle East & Africa/ South America)
4.5.1. By Component
4.5.2. By Deployment
4.5.3. By End-use Industry
5. Global Sales Enablement Software Market Analysis and Forecast
5.1. Market Revenue Analysis (US$ Bn), 2016-2031
5.1.1. Historic Growth Trends, 2016-2021
5.1.2. Forecast Trends, 2022-2031
6. Global Sales Enablement Software Market Analysis, by Component
6.1. Overview and Definitions
6.2. Key Segment Analysis
6.3. Sales Enablement Software Market Size (US$ Bn) Forecast, by Component, 2018 - 2031
6.3.1. Software
6.3.2. Services
6.3.2.1. Implementation & Integration
6.3.2.2. Training & Support
7. Global Sales Enablement Software Market Analysis, by Deployment
7.1. Overview and Definitions
7.2. Key Segment Analysis
7.3. Sales Enablement Software Market Size (US$ Bn) Forecast, by Deployment, 2018 - 2031
7.3.1. On-premise
7.3.2. Large Enterprise
8. Global Sales Enablement Software Market Analysis, by End-use Industry
8.1. Key Segment Analysis
8.2. Sales Enablement Software Market Size (US$ Bn) Forecast, by End-use Industry, 2018 - 2031
8.2.1. BFSI
8.2.2. IT & Telecom
8.2.3. Retail & E-commerce
8.2.4. Media & Entertainment
8.2.5. Electronics & Consumer Goods
8.2.6. Others (Manufacturing, Healthcare, Pharmaceuticals)
9. Global Sales Enablement Software Market Analysis and Forecasts, by Region
9.1. Key Findings
9.2. Market Size (US$ Bn) Forecast by Region, 2018-2031
9.2.1. North America
9.2.2. Europe
9.2.3. Asia Pacific
9.2.4. Middle East & Africa
9.2.5. South America
10. North America Sales Enablement Software Market Analysis and Forecast
10.1. Regional Outlook
10.2. Sales Enablement Software Market Size (US$ Bn) Analysis and Forecast (2018 - 2031)
10.2.1. By Component
10.2.2. By Deployment
10.2.3. By End-use Industry
10.3. Sales Enablement Software Market Size (US$ Bn) Forecast, by Country, 2018 - 2031
10.3.1. U.S.
10.3.2. Canada
10.3.3. Mexico
11. Europe Sales Enablement Software Market Analysis and Forecast
11.1. Regional Outlook
11.2. Sales Enablement Software Market Size (US$ Bn) Analysis and Forecast (2018 - 2031)
11.2.1. By Component
11.2.2. By Deployment
11.2.3. By End-use Industry
11.3. Sales Enablement Software Market Size (US$ Bn) Forecast, by Country & Sub-region, 2018 - 2031
11.3.1. Germany
11.3.2. UK
11.3.3. France
11.3.4. Italy
11.3.5. Spain
11.3.6. Rest of Europe
12. Asia Pacific Sales Enablement Software Market Analysis and Forecast
12.1. Regional Outlook
12.2. Sales Enablement Software Market Size (US$ Bn) Analysis and Forecast (2018 - 2031)
12.2.1. By Component
12.2.2. By Deployment
12.2.3. By End-use Industry
12.3. Sales Enablement Software Market Size (US$ Bn) Forecast, by Country & Sub-region, 2018 - 2031
12.3.1. China
12.3.2. India
12.3.3. Japan
12.3.4. ASEAN
12.3.5. Rest of Asia Pacific
13. Middle East & Africa Sales Enablement Software Market Analysis and Forecast
13.1. Regional Outlook
13.2. Sales Enablement Software Market Size (US$ Bn) Analysis and Forecast (2018 - 2031)
13.2.1. By Component
13.2.2. By Deployment
13.2.3. By End-use Industry
13.3. Sales Enablement Software Market Size (US$ Bn) Forecast, by Country & Sub-region, 2018 - 2031
13.3.1. Saudi Arabia
13.3.2. The United Arab Emirates
13.3.3. South Africa
13.3.4. Rest of Middle East & Africa
14. South America Sales Enablement Software Market Analysis and Forecast
14.1. Regional Outlook
14.2. Sales Enablement Software Market Size (US$ Bn) Analysis and Forecast (2018 - 2031)
14.2.1. By Component
14.2.2. By Deployment
14.2.3. By End-use Industry
14.3. Sales Enablement Software Market Size (US$ Bn) Forecast, by Country & Sub-region, 2018 - 2031
14.3.1. Brazil
14.3.2. Argentina
14.3.3. Rest of South America
15. Competition Landscape
15.1. Market Competition Matrix, by Leading Players
15.2. Market Revenue Share Analysis (%), by Leading Players (2020)
15.3. Competitive Scenario
15.3.1. List of Emerging, Prominent and Leading Players
15.3.2. Major Mergers & Acquisitions, Expansions, Partnership, Contacts, Deals, etc.
16. Company Profiles
16.1. SAP SE
16.1.1. Business Overview
16.1.2. Company Revenue
16.1.3. Product Portfolio
16.1.4. Geographic Footprint
16.1.5. Strategic Partnership, Merger & Acquisition, Business Expansion, New Product Launch, Innovation etc.
16.2. Highspot
16.2.1. Business Overview
16.2.2. Company Revenue
16.2.3. Product Portfolio
16.2.4. Geographic Footprint
16.2.5. Strategic Partnership, Merger & Acquisition, Business Expansion, New Product Launch, Innovation etc.
16.3. Agile CRM
16.3.1. Business Overview
16.3.2. Company Revenue
16.3.3. Product Portfolio
16.3.4. Geographic Footprint
16.3.5. Strategic Partnership, Merger & Acquisition, Business Expansion, New Product Launch, Innovation etc.
16.4. verbTEAMS
16.4.1. Business Overview
16.4.2. Company Revenue
16.4.3. Product Portfolio
16.4.4. Geographic Footprint
16.4.5. Strategic Partnership, Merger & Acquisition, Business Expansion, New Product Launch, Innovation etc.
16.5. Upland Software, Inc.
16.5.1. Business Overview
16.5.2. Company Revenue
16.5.3. Product Portfolio
16.5.4. Geographic Footprint
16.5.5. Strategic Partnership, Merger & Acquisition, Business Expansion, New Product Launch, Innovation etc.
16.6. Seismic
16.6.1. Business Overview
16.6.2. Company Revenue
16.6.3. Product Portfolio
16.6.4. Geographic Footprint
16.6.5. Strategic Partnership, Merger & Acquisition, Business Expansion, New Product Launch, Innovation etc.
16.7. Bigtincan Holdings Limited
16.7.1. Business Overview
16.7.2. Company Revenue
16.7.3. Product Portfolio
16.7.4. Geographic Footprint
16.7.5. Strategic Partnership, Merger & Acquisition, Business Expansion, New Product Launch, Innovation etc.
16.8. Mindtickle Inc.
16.8.1. Business Overview
16.8.2. Company Revenue
16.8.3. Product Portfolio
16.8.4. Geographic Footprint
16.8.5. Strategic Partnership, Merger & Acquisition, Business Expansion, New Product Launch, Innovation etc.
16.9. Showpad
16.9.1. Business Overview
16.9.2. Company Revenue
16.9.3. Product Portfolio
16.9.4. Geographic Footprint
16.9.5. Strategic Partnership, Merger & Acquisition, Business Expansion, New Product Launch, Innovation etc.
16.10. Accent Technologies, Inc.
16.10.1. Business Overview
16.10.2. Company Revenue
16.10.3. Product Portfolio
16.10.4. Geographic Footprint
16.10.5. Strategic Partnership, Merger & Acquisition, Business Expansion, New Product Launch, Innovation etc.
16.11. Mindmatrix Inc.
16.11.1. Business Overview
16.11.2. Company Revenue
16.11.3. Product Portfolio
16.11.4. Geographic Footprint
16.11.5. Strategic Partnership, Merger & Acquisition, Business Expansion, New Product Launch, Innovation etc.
16.12. Pipelinersales, Inc.
16.12.1. Business Overview
16.12.2. Company Revenue
16.12.3. Product Portfolio
16.12.4. Geographic Footprint
16.12.5. Strategic Partnership, Merger & Acquisition, Business Expansion, New Product Launch, Innovation etc.
16.13. Zoho Corporation Pvt. Ltd.
16.13.1. Business Overview
16.13.2. Company Revenue
16.13.3. Product Portfolio
16.13.4. Geographic Footprint
16.13.5. Strategic Partnership, Merger & Acquisition, Business Expansion, New Product Launch, Innovation etc.
16.14. SalesHood Inc.
16.14.1. Business Overview
16.14.2. Company Revenue
16.14.3. Product Portfolio
16.14.4. Geographic Footprint
16.14.5. Strategic Partnership, Merger & Acquisition, Business Expansion, New Product Launch, Innovation etc.
16.15. Oracle
16.15.1. Business Overview
16.15.2. Company Revenue
16.15.3. Product Portfolio
16.15.4. Geographic Footprint
16.15.5. Strategic Partnership, Merger & Acquisition, Business Expansion, New Product Launch, Innovation etc.
16.16. Others
17. Key Takeaways
List of Tables
Table 1: Acronyms Used in the Sales Enablement Software Market
Table 2: North America Sales Enablement Software Market Revenue Analysis, by Country, 2021 - 2031 (US$ Bn)
Table 3: Europe Sales Enablement Software Market Revenue Analysis, by Country, 2021 - 2031 (US$ Bn)
Table 4: Asia Pacific Sales Enablement Software Market Revenue Analysis, by Country, 2021 - 2031 (US$ Bn)
Table 5: Middle East & Africa Sales Enablement Software Market Revenue Analysis, by Country, 2021 and 2031 (US$ Bn)
Table 6: South America Sales Enablement Software Market Revenue Analysis, by Country, 2021 - 2031 (US$ Bn)
Table 7: Forecast Factors: Relevance and Impact
Table 8: Mergers & Acquisitions, Expansions (1/2)
Table 9: Mergers & Acquisitions, Expansions (2/2)
Table 10: Global Sales Enablement Software Market Value (US$ Bn) Forecast, by Component, 2018 – 2031
Table 11: Global Sales Enablement Software Market Value (US$ Bn) Forecast, by Deployment, 2018 – 2031
Table 12: Global Sales Enablement Software Market Value (US$ Bn) Forecast, by End-use Industry, 2018 – 2031
Table 13: Global Sales Enablement Software Market Volume (US$ Bn) Forecast, by Region, 2018 - 2031
Table 14: North America Sales Enablement Software Market Value (US$ Bn) Forecast, by Component, 2018 – 2031
Table 15: North America Sales Enablement Software Market Value (US$ Bn) Forecast, by Deployment, 2018 – 2031
Table 16: North America Sales Enablement Software Market Value (US$ Bn) Forecast, by End-use Industry, 2018 – 2031
Table 17: North America Sales Enablement Software Market Value (US$ Bn) Forecast, by Country, 2018 - 2031
Table 18: U.S. Sales Enablement Software Market Revenue CAGR Breakdown (%), by Growth Term
Table 19: Canada Sales Enablement Software Market Revenue CAGR Breakdown (%), by Growth Term
Table 20: Mexico Sales Enablement Software Market Revenue CAGR Breakdown (%), by Growth Term
Table 21: Europe Sales Enablement Software Market Value (US$ Bn) Forecast, by Component, 2018 – 2031
Table 22: Europe Sales Enablement Software Market Value (US$ Bn) Forecast, by Deployment, 2018 – 2031
Table 23: Europe Sales Enablement Software Market Value (US$ Bn) Forecast, by End-use Industry, 2018 – 2031
Table 24: Europe Sales Enablement Software Market Value (US$ Bn) Forecast, by Country and Sub-region, 2018 - 2031
Table 25: Germany Sales Enablement Software Market Revenue CAGR Breakdown (%), by Growth Term
Table 26: U.K. Sales Enablement Software Market Revenue CAGR Breakdown (%), by Growth Term
Table 27: France Sales Enablement Software Market Revenue CAGR Breakdown (%), by Growth Term
Table 28: Spain Sales Enablement Software Market Revenue CAGR Breakdown (%), by Growth Term
Table 29: Italy Sales Enablement Software Market Revenue CAGR Breakdown (%), by Growth Term
Table 30: Asia Pacific Sales Enablement Software Market Value (US$ Bn) Forecast, by Component, 2018 – 2031
Table 31: Asia Pacific Sales Enablement Software Market Value (US$ Bn) Forecast, by Deployment, 2018 – 2031
Table 32: Asia Pacific Sales Enablement Software Market Value (US$ Bn) Forecast, by End-use Industry, 2018 – 2031
Table 33: Asia Pacific Sales Enablement Software Market Value (US$ Bn) Forecast, by Country and Sub-region, 2018 - 2031
Table 34: China Sales Enablement Software Market Revenue CAGR Breakdown (%), by Growth Term
Table 35: India Sales Enablement Software Market Revenue CAGR Breakdown (%), by Growth Term
Table 36: Japan Sales Enablement Software Market Revenue CAGR Breakdown (%), by Growth Term
Table 37: South Korea Sales Enablement Software Market Revenue CAGR Breakdown (%), by Growth Term
Table 38: Southeast Asia Sales Enablement Software Market Revenue CAGR Breakdown (%), by Growth Term
Table 39: Australia Sales Enablement Software Market Revenue CAGR Breakdown (%), by Growth Term
Table 40: Middle East & Africa Sales Enablement Software Market Value (US$ Bn) Forecast, by Component, 2018 – 2031
Table 41: Middle East & Africa Sales Enablement Software Market Value (US$ Bn) Forecast, by Deployment, 2018 – 2031
Table 42: Middle East & Africa Sales Enablement Software Market Value (US$ Bn) Forecast, by End-use Industry, 2018 – 2031
Table 43: Middle East & Africa Sales Enablement Software Market Value (US$ Bn) Forecast, by Country and Sub-region, 2018 - 2031
Table 44: Saudi Arabia Sales Enablement Software Market Revenue CAGR Breakdown (%), by Growth Term
Table 45: The United Arab Emirates Sales Enablement Software Market Revenue CAGR Breakdown (%), by Growth Term
Table 46: The United Arab Emirates Sales Enablement Software Market Revenue CAGR Breakdown (%), by Growth Term
Table 47: The United Arab Emirates Sales Enablement Software Market Revenue CAGR Breakdown (%), by Growth Term
Table 48: South Africa Sales Enablement Software Market Revenue CAGR Breakdown (%), by Growth Term
Table 49: South America Sales Enablement Software Market Value (US$ Bn) Forecast, by Component, 2018 – 2031
Table 50: South America Sales Enablement Software Market Value (US$ Bn) Forecast, by Deployment, 2018 – 2031
Table 51: South America Sales Enablement Software Market Value (US$ Bn) Forecast, by End-use Industry, 2018 – 2031
Table 52: South America Sales Enablement Software Market Value (US$ Bn) Forecast, by Country, 2018 - 2031
Table 53: Brazil Emirates Sales Enablement Software Market Revenue CAGR Breakdown (%), by Growth Term
Table 54: Argentina Sales Enablement Software Market Revenue CAGR Breakdown (%), by Growth Term
Table 55: Columbia Sales Enablement Software Market Revenue CAGR Breakdown (%), by Growth Term
Table 56: Chile Sales Enablement Software Market Revenue CAGR Breakdown (%), by Growth Term
List of Figures
Figure 1: Global Sales Enablement Software Market Size (US$ Bn) Forecast, 2018–2031
Figure 2: Global Sales Enablement Software Market Revenue (US$ Bn) Opportunity Assessment, by Region, 2021E
Figure 3: Top Segment Analysis of Sales Enablement Software Market
Figure 4: Global Sales Enablement Software Market Revenue (US$ Bn) Opportunity Assessment, by Region, 2031F
Figure 5: Global Sales Enablement Software Market Attractiveness Assessment, by Component
Figure 6: Global Sales Enablement Software Market Attractiveness Assessment, by Deployment
Figure 7: Global Sales Enablement Software Market Attractiveness Assessment, by End-use Industry
Figure 8: Global Sales Enablement Software Market Attractiveness Assessment, by Region
Figure 9: Global Sales Enablement Software Market Revenue (US$ Bn) Historic Trends, 2016 - 2020
Figure 10: Global Sales Enablement Software Market Revenue Opportunity (US$ Bn) Historic Trends, 2016 - 2020
Figure 11: Global Sales Enablement Software Market Value Share Analysis, by Component, 2021
Figure 12: Global Sales Enablement Software Market Value Share Analysis, by Component, 2031
Figure 13: Global Sales Enablement Software Market Absolute Opportunity (US$ Bn), by Software, 2021 – 2031
Figure 14: Global Sales Enablement Software Market Absolute Opportunity (US$ Bn), by Services, 2021 – 2031
Figure 15: Global Sales Enablement Software Market Value Share Analysis, by Deployment, 2021
Figure 16: Global Sales Enablement Software Market Value Share Analysis, by Deployment, 2031
Figure 17: Global Sales Enablement Software Market Absolute Opportunity (US$ Bn), by On-premise, 2021 – 2031
Figure 18: Global Sales Enablement Software Market Absolute Opportunity (US$ Bn), by Cloud, 2021 – 2031
Figure 19: Global Sales Enablement Software Market Value Share Analysis, by End-use Industry, 2021
Figure 20: Global Sales Enablement Software Market Value Share Analysis, by End-use Industry, 2031
Figure 21: Global Sales Enablement Software Market Absolute Opportunity (US$ Bn), by BFSI , 2021 – 2031
Figure 22: Global Sales Enablement Software Market Absolute Opportunity (US$ Bn), by IT & Telecom , 2021 – 2031
Figure 23: Global Sales Enablement Software Market Absolute Opportunity (US$ Bn), by Retail & E-commerce, 2021 – 2031
Figure 24: Global Sales Enablement Software Market Absolute Opportunity (US$ Bn), by Media & Entertainment, 2021 – 2031
Figure 25: Global Sales Enablement Software Market Absolute Opportunity (US$ Bn), by Electronics & Consumer Goods, 2021 – 2031
Figure 26: Global Sales Enablement Software Market Absolute Opportunity (US$ Bn), by Others (Manufacturing, Healthcare, Pharmaceuticals), 2021 – 2031
Figure 27: Global Sales Enablement Software Market Opportunity (US$ Bn), by Region
Figure 28: Global Sales Enablement Software Market Opportunity Share (%), by Region, 2021–2031
Figure 29: Global Sales Enablement Software Market Size (US$ Bn), by Region, 2021 & 2031
Figure 30: Global Sales Enablement Software Market Value Share Analysis, by Region, 2021
Figure 31: Global Sales Enablement Software Market Value Share Analysis, by Region, 2031
Figure 32: North America Sales Enablement Software Market Absolute Opportunity (US$ Bn), 2021 – 2031
Figure 33: Europe Sales Enablement Software Market Absolute Opportunity (US$ Bn), 2021 – 2031
Figure 34: Asia Pacific Sales Enablement Software Market Absolute Opportunity (US$ Bn), 2021 – 2031
Figure 35: Middle East & Africa Sales Enablement Software Market Absolute Opportunity (US$ Bn), 2021 – 2031
Figure 36: South America Sales Enablement Software Market Absolute Opportunity (US$ Bn), 2021 – 2031
Figure 37: North America Sales Enablement Software Revenue Opportunity Share, by Country
Figure 38: North America Sales Enablement Software Revenue Opportunity Share, by Component
Figure 39: North America Sales Enablement Software Revenue Opportunity Share, by Deployment
Figure 40: North America Sales Enablement Software Revenue Opportunity Share, by End-use Industry
Figure 41: North America Sales Enablement Software Market Value Share Analysis, by Component, 2021
Figure 42: North America Sales Enablement Software Market Value Share Analysis, by Component, 2031
Figure 43: North America Sales Enablement Software Market Absolute Opportunity (US$ Bn), by Software, 2021 – 2031
Figure 44: North America Sales Enablement Software Market Absolute Opportunity (US$ Bn), by Services, 2021 – 2031
Figure 45: North America Sales Enablement Software Market Value Share Analysis, by Deployment, 2021
Figure 46: North America Sales Enablement Software Market Value Share Analysis, by Deployment, 2031
Figure 47: North America Sales Enablement Software Market Absolute Opportunity (US$ Bn), by On-premise, 2021 – 2031
Figure 48: North America Sales Enablement Software Market Absolute Opportunity (US$ Bn), by Cloud, 2021 – 2031
Figure 49: North America Sales Enablement Software Market Value Share Analysis, by End-use Industry, 2021
Figure 50: North America Sales Enablement Software Market Value Share Analysis, by End-use Industry, 2031
Figure 51: North America Sales Enablement Software Market Absolute Opportunity (US$ Bn), by BFSI , 2021 – 2031
Figure 52: North America Sales Enablement Software Market Absolute Opportunity (US$ Bn), by IT and Telecom, 2021 – 2031
Figure 53: North America Sales Enablement Software Market Absolute Opportunity (US$ Bn), by Retail & E-commerce, 2021 – 2031
Figure 54: North America Sales Enablement Software Market Absolute Opportunity (US$ Bn), by Media & Entertainment, 2021 – 2031
Figure 55: North America Sales Enablement Software Market Absolute Opportunity (US$ Bn), by Electronics & Consumer Goods, 2021 – 2031
Figure 56: North America Sales Enablement Software Market Absolute Opportunity (US$ Bn), by Others (Manufacturing, Healthcare, Pharmaceuticals), 2021 – 2031
Figure 57: North America Sales Enablement Software Market Value Share Analysis, by Country, 2021
Figure 58: North America Sales Enablement Software Market Value Share Analysis, by Country, 2031
Figure 59: U.S. Sales Enablement Software Market Opportunity Growth Analysis (US$ Bn) Forecast, 2021 – 2031
Figure 60: Canada Sales Enablement Software Market Opportunity Growth Analysis (US$ Bn) Forecast, 2021 – 2031
Figure 61: Mexico Sales Enablement Software Market Opportunity Growth Analysis (US$ Bn) Forecast, 2021 – 2031
Figure 62: Europe Sales Enablement Software Revenue Opportunity Share, by Country
Figure 63: Europe Sales Enablement Software Revenue Opportunity Share, by Component
Figure 64: Europe Sales Enablement Software Revenue Opportunity Share, by Deployment
Figure 65: Europe Sales Enablement Software Revenue Opportunity Share, by End-use Industry
Figure 66: Europe Sales Enablement Software Market Value Share Analysis, by Component, 2021
Figure 67: Europe Sales Enablement Software Market Value Share Analysis, by Component, 2031
Figure 68: Europe Sales Enablement Software Market Absolute Opportunity (US$ Bn), by Software, 2021 – 2031
Figure 69: Europe Sales Enablement Software Market Absolute Opportunity (US$ Bn), by Services, 2021 – 2031
Figure 70: Europe Sales Enablement Software Market Value Share Analysis, by Deployment, 2021
Figure 71: Europe Sales Enablement Software Market Absolute Opportunity (US$ Bn), by On-premise, 2021 – 2031
Figure 72: Europe Sales Enablement Software Market Absolute Opportunity (US$ Bn), by Cloud, 2021 – 2031
Figure 73: Europe Sales Enablement Software Market Value Share Analysis, by End-use Industry, 2021
Figure 74: Europe Sales Enablement Software Market Value Share Analysis, by End-use Industry, 2031
Figure 75: Europe Sales Enablement Software Market Absolute Opportunity (US$ Bn), by BFSI , 2021 – 2031
Figure 76: Europe Sales Enablement Software Market Absolute Opportunity (US$ Bn), by IT and Telecom, 2021 – 2031
Figure 77: Europe Sales Enablement Software Market Absolute Opportunity (US$ Bn), by Retail & E-commerce, 2021 – 2031
Figure 78: Europe Sales Enablement Software Market Absolute Opportunity (US$ Bn), by Media & Entertainment, 2021 – 2031
Figure 79: Europe Sales Enablement Software Market Absolute Opportunity (US$ Bn), by Electronics & Consumer Goods, 2021 – 2031
Figure 80: Europe Sales Enablement Software Market Absolute Opportunity (US$ Bn), by Others (Manufacturing, Healthcare, Pharmaceuticals), 2021 – 2031
Figure 81: Europe Sales Enablement Software Market Value Share Analysis, by Country, 2021
Figure 82: Europe Sales Enablement Software Market Value Share Analysis, by Country, 2031
Figure 83: Germany Sales Enablement Software Market Opportunity Growth Analysis (US$ Bn) Forecast, 2021 – 2031
Figure 84: U.K. Sales Enablement Software Market Opportunity Growth Analysis (US$ Bn) Forecast, 2021 – 2031
Figure 85: France Sales Enablement Software Market Opportunity Growth Analysis (US$ Bn) Forecast, 2021 – 2031
Figure 86: Spain Sales Enablement Software Market Opportunity Growth Analysis (US$ Bn) Forecast, 2021 – 2031
Figure 87: Italy Sales Enablement Software Market Opportunity Growth Analysis (US$ Bn) Forecast, 2021 – 2031
Figure 88: Asia Pacific Sales Enablement Software Revenue Opportunity Share, by Country
Figure 89: Asia Pacific Sales Enablement Software Revenue Opportunity Share, by Component
Figure 90: Asia Pacific Sales Enablement Software Revenue Opportunity Share, by Deployment
Figure 91: Asia Pacific Sales Enablement Software Revenue Opportunity Share, by End-use Industry
Figure 92: Asia Pacific Sales Enablement Software Market Value Share Analysis, by Component, 2021
Figure 93: Asia Pacific Sales Enablement Software Market Value Share Analysis, by Component, 2031
Figure 94: Asia Pacific Sales Enablement Software Market Absolute Opportunity (US$ Bn), by Software, 2021 – 2031
Figure 95: Asia Pacific Sales Enablement Software Market Absolute Opportunity (US$ Bn), by Services, 2021 – 2031
Figure 96: Asia Pacific Sales Enablement Software Market Value Share Analysis, by Deployment, 2021
Figure 97: Asia Pacific Sales Enablement Software Market Value Share Analysis, by Deployment, 2031
Figure 98: Asia Pacific Sales Enablement Software Market Absolute Opportunity (US$ Bn), by On-premise, 2021 – 2031
Figure 99: Asia Pacific Sales Enablement Software Market Absolute Opportunity (US$ Bn), by Cloud, 2021 – 2031
Figure 100: Asia Pacific Sales Enablement Software Market Value Share Analysis, by End-use Industry, 2021
Figure 101: Asia Pacific Sales Enablement Software Market Value Share Analysis, by End-use Industry, 2031
Figure 102: Asia Pacific Sales Enablement Software Market Absolute Opportunity (US$ Bn), by BFSI , 2021 – 2031
Figure 103: Asia Pacific Sales Enablement Software Market Absolute Opportunity (US$ Bn), by IT and Telecom, 2021 – 2031
Figure 104: Asia Pacific Sales Enablement Software Market Absolute Opportunity (US$ Bn), by Retail & E-commerce, 2021 – 2031
Figure 105: Asia Pacific Sales Enablement Software Market Absolute Opportunity (US$ Bn), by Media & Entertainment, 2021 – 2031
Figure 106: Asia Pacific Sales Enablement Software Market Absolute Opportunity (US$ Bn), by Electronics & Consumer Goods, 2021 – 2031
Figure 107: Asia Pacific Sales Enablement Software Market Absolute Opportunity (US$ Bn), by Others (Manufacturing, Healthcare, Pharmaceuticals), 2021 – 2031
Figure 108: Asia Pacific Sales Enablement Software Market Value Share Analysis, by Country, 2021
Figure 109: Asia Pacific Sales Enablement Software Market Value Share Analysis, by Country, 2031
Figure 110: China Sales Enablement Software Market Opportunity Growth Analysis (US$ Bn) Forecast, 2021 – 2031
Figure 111: India Sales Enablement Software Market Opportunity Growth Analysis (US$ Bn) Forecast, 2021 – 2031
Figure 112: Japan Sales Enablement Software Market Opportunity Growth Analysis (US$ Bn) Forecast, 2021 – 2031
Figure 113: South Korea Sales Enablement Software Market Opportunity Growth Analysis (US$ Bn) Forecast, 2021 – 2031
Figure 114: Southeast Asia Sales Enablement Software Market Opportunity Growth Analysis (US$ Bn) Forecast, 2021 – 2031
Figure 115: Australia Sales Enablement Software Market Opportunity Growth Analysis (US$ Bn) Forecast, 2021 – 2031
Figure 116: Middle East & Africa Sales Enablement Software Revenue Opportunity Share, by Country
Figure 117: Middle East & Africa Sales Enablement Software Revenue Opportunity Share, by Component
Figure 118: Middle East & Africa Sales Enablement Software Revenue Opportunity Share, by Deployment
Figure 119: Middle East & Africa Sales Enablement Software Revenue Opportunity Share, by End-use Industry
Figure 120: Middle East & Africa Sales Enablement Software Market Value Share Analysis, by Component, 2021
Figure 121: Middle East & Africa Sales Enablement Software Market Value Share Analysis, by Component, 2031
Figure 122: Middle East & Africa Sales Enablement Software Market Absolute Opportunity (US$ Bn), by Software, 2021 – 2031
Figure 123: Middle East & Africa Sales Enablement Software Market Absolute Opportunity (US$ Bn), by Services, 2021 – 2031
Figure 124: Middle East & Africa Sales Enablement Software Market Value Share Analysis, by Deployment, 2021
Figure 125: Middle East & Africa Sales Enablement Software Market Value Share Analysis, by Deployment, 2031
Figure 126: Middle East & Africa Sales Enablement Software Market Absolute Opportunity (US$ Bn), by On-premise, 2021 – 2031
Figure 127: Middle East & Africa Sales Enablement Software Market Absolute Opportunity (US$ Bn), by Cloud, 2021 – 2031
Figure 128: Middle East & Africa Sales Enablement Software Market Value Share Analysis, by End-use Industry, 2021
Figure 129: Middle East & Africa Sales Enablement Software Market Value Share Analysis, by End-use Industry, 2031
Figure 130: Middle East & Africa Sales Enablement Software Market Absolute Opportunity (US$ Bn), by BFSI , 2021 – 2031
Figure 131: Middle East & Africa Sales Enablement Software Market Absolute Opportunity (US$ Bn), by IT and Telecom, 2021 – 2031
Figure 132: Middle East & Africa Sales Enablement Software Market Absolute Opportunity (US$ Bn), by Retail & E-commerce, 2021 – 2031
Figure 133: Middle East & Africa Sales Enablement Software Market Absolute Opportunity (US$ Bn), by Media & Entertainment, 2021 – 2031
Figure 134: Middle East & Africa Sales Enablement Software Market Absolute Opportunity (US$ Bn), by Electronics & Consumer Goods, 2021 – 2031
Figure 135: Middle East & Africa Sales Enablement Software Market Absolute Opportunity (US$ Bn), by Others (Manufacturing, Healthcare, Pharmaceuticals), 2021 – 2031
Figure 136: Middle East & Africa Sales Enablement Software Market Value Share Analysis, by Country, 2021
Figure 137: Middle East & Africa Sales Enablement Software Market Value Share Analysis, by Country, 2031
Figure 138: Saudi Arabia Sales Enablement Software Market Opportunity Growth Analysis (US$ Bn) Forecast, 2021 – 2031
Figure 139: The United Arab Emirates Sales Enablement Software Market Opportunity Growth Analysis (US$ Bn) Forecast, 2021 – 2031
Figure 140: The United Arab Emirates Sales Enablement Software Market Opportunity Growth Analysis (US$ Bn) Forecast, 2021 – 2031
Figure 141: The United Arab Emirates Sales Enablement Software Market Opportunity Growth Analysis (US$ Bn) Forecast, 2021 – 2031
Figure 142: South Africa Sales Enablement Software Market Opportunity Growth Analysis (US$ Bn) Forecast, 2021 – 2031
Figure 143: South America Sales Enablement Software Revenue Opportunity Share, by Country
Figure 144: South America Sales Enablement Software Revenue Opportunity Share, by Component
Figure 145: South America Sales Enablement Software Revenue Opportunity Share, by Deployment
Figure 146: South America Sales Enablement Software Revenue Opportunity Share, by End-use Industry
Figure 147: South America Sales Enablement Software Market Value Share Analysis, by Component, 2021
Figure 148: South America Sales Enablement Software Market Value Share Analysis, by Component, 2031
Figure 149: South America Sales Enablement Software Market Absolute Opportunity (US$ Bn), by Software, 2021 – 2031
Figure 150: South America Sales Enablement Software Market Absolute Opportunity (US$ Bn), by Services, 2021 – 2031
Figure 151: South America Sales Enablement Software Market Value Share Analysis, by Deployment, 2021
Figure 152: South America Sales Enablement Software Market Value Share Analysis, by Deployment, 2031
Figure 153: South America Sales Enablement Software Market Absolute Opportunity (US$ Bn), by On-premise, 2021 – 2031
Figure 154: South America Sales Enablement Software Market Absolute Opportunity (US$ Bn), by Cloud, 2021 – 2031
Figure 155: South America Sales Enablement Software Market Value Share Analysis, by End-use Industry, 2021
Figure 156: South America Sales Enablement Software Market Value Share Analysis, by End-use Industry, 2031
Figure 157: South America Sales Enablement Software Market Absolute Opportunity (US$ Bn), by BFSI, 2021 – 2031
Figure 158: South America Sales Enablement Software Market Absolute Opportunity (US$ Bn), by IT and Telecom, 2021 – 2031
Figure 159: South America Sales Enablement Software Market Absolute Opportunity (US$ Bn), by Retail & E-commerce, 2021 – 2031
Figure 160: South America Sales Enablement Software Market Absolute Opportunity (US$ Bn), by Media & Entertainment, 2021 – 2031
Figure 161: South America Sales Enablement Software Market Absolute Opportunity (US$ Bn), by Electronics & Consumer Goods, 2021 – 2031
Figure 162: South America Sales Enablement Software Market Absolute Opportunity (US$ Bn), by Others (Manufacturing, Healthcare, Pharmaceuticals), 2021 – 2031
Figure 163: South America Sales Enablement Software Market Value Share Analysis, by Country, 2021
Figure 164: South America Sales Enablement Software Market Value Share Analysis, by Country, 2031
Figure 165: Brazil Sales Enablement Software Market Opportunity Growth Analysis (US$ Bn) Forecast, 2021 – 2031
Figure 166: Argentina Sales Enablement Software Market Opportunity Growth Analysis (US$ Bn) Forecast, 2021 – 2031
Figure 167: Colombia Sales Enablement Software Market Opportunity Growth Analysis (US$ Bn) Forecast, 2021 – 2031
Figure 168: Chile Sales Enablement Software Market Opportunity Growth Analysis (US$ Bn) Forecast, 2021 – 2031
Copyright © Transparency Market Research, Inc. All Rights reserved
Trust Online

Sales Enablement Software Market