
Reports
Reports
Analysts’ Viewpoint on Robo-taxi Market Scenario
Increase in production and sale of electric vehicles, rise in adoption of ridesharing, and expansion of level 4 automation for vehicles are major factors driving the global robo-taxi market size. Governments across the globe are implementing stringent regulations to reduce the usage of fossil fuel-powered vehicles. Increase in deployment and testing of self-driving cars; and adoption of advanced features for driver assistance are expected to offer lucrative opportunities for key players operating in the global robo-taxi market. Market players are increasingly offering autonomous taxi services in various cities across the globe to broaden their robotaxi revenue.
Robo-taxi is a self-driving vehicle operated through an e-hailing service via a smartphone application for short distances or on a rental basis for long-distance travel. Robo-taxis or autonomous taxi fleets are able to drive millions of miles, with more efficiency, safety, and cost effectiveness. A high-fidelity platform in robo-taxi servers gathers ground-truth data using different sensors for future development while driving. Companies operating in the autonomous transport industry extensively rely on NVIDIA chips for development, deployment, and testing of robo-taxi. NVIDIA Corporation offers NVIDIA DRIVE, an open, unified, and high-performance computing infrastructure powered by the GPU technology, for development, training, validation, and testing in simulation for self-driving Deep Neural Networks (DNNs).
Several companies offer an extensive testing fleet of robo-taxis. Cruise Automation's fleet includes 46 Chevrolet Bolt EVs, Uber has 14 vehicles, NuTonomy possesses six Mitsubishi i-MiEVs and modified Renault Zoe in Singapore, and Baidu Inc. has a fleet of 30 sedans in Guangzhou, China.
Vehicle manufacturers and startup companies have been focusing on R&D of fully autonomous vehicles since the last decade. Most of these companies are still in the testing phase, as the process is time-consuming and requires the integration of complex supercomputers, sensors, cameras, and other advanced technologies. These technologies ensure the safety of autonomous vehicles. Robo-taxis are equipped with Advanced Driver Assist System (ADAS), airbags, health monitoring, and other safety and comfort-related solutions. These systems record behavioral patterns of drivers and automatically assess traffic-related data from servers to help in traffic control.
Rise in cases of road accidents is expected to boost the demand for robo-taxis. According to a 2020 report by Waymo LLC, an autonomous driving technology company, about 1.4 million deaths occur annually across the globe due to road accidents. As per the National Highway Traffic Safety Administration (NHTSA), around 94% of car accidents occur due to human error. Additionally, MIT Energy Initiative Mobility 2020 stated that approximately 40,000 people lost their lives in the U.S. in 2019 due to road accidents. Adoption of telematics and other integrated technologies can help reduce human errors in road accidents. Robo-taxis are equipped with features that enhance vehicle safety and reduce traffic congestion.
Decline in fossil fuel deposits and increase in focus on environmental protection have led to significant adoption of alternative solutions that can power vehicle engines including rechargeable batteries and fuel cells. Robo-taxis are hybrid or fully electric vehicles that contribute to sustainable environment. Additionally, governments across the globe are offering tax benefits, subsidies, and incentives to increase the usage of electric vehicles. The Ministry of Transport and Communications in Finland has prepared a lawful structure for autonomous vehicle development and testing in the country. Furthermore, several countries across Europe and North America, including the U.K., France, Austria, the Netherlands, and the U.S., are supporting the development, testing, and deployment of robo cab services. The California Public Utilities Commission (CPUC) introduced commercial programs in 2020 that enable autonomous car manufacturers to test their robotaxi services for different commercial applications.
In terms of level of autonomy, the global robo-taxi market has been bifurcated into level 4 and level 5. The level 4 segment held dominant share of the market in 2021. Level 4 automation allows self-driving robo-taxis to operate without any human intervention on some selected routes and cities, where the city infrastructure supports autonomous driving. Level 4 robo-taxi has a cockpit for manual vehicle control. Adoption of level 4 robo-taxis is rising across the globe, as it helps reduce fleet operational costs by 30% to 50%.
The level 5 segment is expected to witness the fastest growth during the forecast period, as level 5 robo-taxis are fully automated and can operate in traffic congestion, bad weather, and even during interference with radar sensors.
Based on propulsion, the global robo-taxi market has been divided into internal combustion engine vehicles, hybrid vehicles, and fully electric vehicles. The hybrid vehicles segment is projected to hold major share of the global market during the forecast period, due to stringent implementation of emission norms that is shifting consumer and manufacturers’ preference toward vehicle electrification. The fully electric vehicles segment is anticipated to grow significantly during the forecast period. Fully electric vehicles help lower operational costs due to the integration of a lesser number of vehicle components.
Europe is expected to hold dominant share of the global robo-taxi market during the forecast period, due to the increase in adoption of EVs in the region. High presence of autonomous vehicle manufacturers and implementation of government norms to curb vehicle emissions are also expected to drive the market in Europe. Supportive infrastructure for autonomous vehicles and technological advancements have enabled several fleet operators across the region to deploy and test autonomous vehicles. According to the European Commission, the European Union has approximately 180 automobile facilities that are considered the largest investors in the R&D of self-driving cars. The robo-taxi market forecast for North America and Asia Pacific appears promising, with several lucrative growth opportunities in electric public transport and R&D of autonomous cars in these regions.
The global robo-taxi market is consolidated, with the presence of a large number of electric vehicle manufacturing companies that control majority of the share. Market players are increasingly investing in R&D of automated taxi services and adopting merger and acquisition strategies to enhance their market share. Some of the robo taxi companies identified in the global market are Waymo LLC, Tesla, Inc., Uber Technologies, Inc., Lyft, Inc., AB Volvo, Ford Motor Company, AutoX, Inc., Aptiv PLC, NAVYA, Cruise LLC, Baidu, Inc., EasyMile, Beijing Xiaoju Technology Co., Ltd., and MOIA.
Each of these players has been profiled in the robo-taxi market report based on parameters such as company overview, financial overview, business strategies, product portfolio, business segments, and recent developments.
|
Attribute |
Detail |
|
Market Size Value in 2021 |
US$ 240 Mn |
|
Market Forecast Value in 2031 |
US$ 30.81 Bn |
|
Growth Rate (CAGR) |
62.50% |
|
Forecast Period |
2022–2031 |
|
Historical Data Available for |
2017–2021 |
|
Quantitative Units |
US$ Mn/Bn for Value and Thousand Units for Volume |
|
Market Analysis |
It includes cross segment analysis at global as well as regional level. Furthermore, qualitative analysis includes drivers, restraints, opportunities, key trends, Porter’s Five Forces analysis, value chain analysis, and key trend analysis. |
|
Competition Landscape |
|
|
Format |
Electronic (PDF) + Excel |
|
Market Segmentation |
|
|
Regions Covered |
|
|
Countries Covered |
|
|
Companies Profiled |
|
|
Customization Scope |
Available upon request |
|
Pricing |
Available upon request |
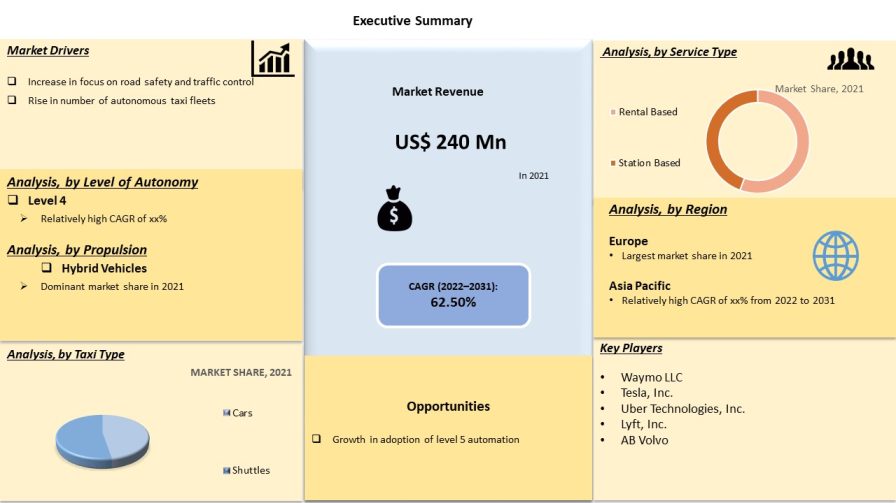
The global robo-taxi market was valued at US$ 240 Mn in 2021.
The global robo-taxi market is expected to advance at a CAGR of 62.50% by 2031.
The global robo-taxi market is likely to reach US$ 30.81 Bn in 2031.
Rise in deployment and testing of self-driving cars and adoption of advanced features for driver assistance are key trends in the global robo-taxi market.
The level 4 segment accounted for 64.6% share of the global robo-taxi market in 2021.
Europe is a highly lucrative region of the global robo-taxi market.
Waymo LLC, Tesla, Inc., Uber Technologies, Inc., Lyft, Inc., AB Volvo, Ford Motor Company, AutoX, Inc., Aptiv PLC, NAVYA, Cruise LLC, Baidu, Inc., EasyMile, Beijing Xiaoju Technology Co., Ltd. and MOIA.
1. Executive Summary
1.1. Global Market Outlook
1.1.1. Market Size in Units, Value US$ Mn, 2017-2031
1.2. TMR Analysis and Recommendations
1.3. Competitive Dashboard Analysis
2. Market Overview
2.1. Market Coverage / Taxonomy
2.2. Market Definition / Scope / Limitations
2.3. Market Dynamics
2.3.1. Drivers
2.3.2. Restraints
2.3.3. Opportunity
2.4. Market Factor Analysis
2.4.1. Porter’s Five Force Analysis
2.4.2. SWOT Analysis
2.5. Regulatory Scenario
2.6. Key Trend Analysis
2.7. Value Chain Analysis
2.8. Cost Structure Analysis
2.9. Profit Margin Analysis
3. COVID-19 Impact Analysis – Robo-taxi Market
4. Global Robo-taxi Market, By Level of Autonomy
4.1. Market Snapshot
4.1.1. Introduction, Definition, and Key Findings
4.1.2. Market Growth & Y-o-Y Projections
4.1.3. Base Point Share Analysis
4.2. Global Robo-taxi Market Size (Units), Revenue (US$ Mn) Analysis & Forecast, 2017-2031, By Level of Autonomy
4.2.1. Level 4
4.2.2. Level 5
5. Global Robo-taxi Market, By Service Type
5.1. Market Snapshot
5.1.1. Introduction, Definition, and Key Findings
5.1.2. Market Growth & Y-o-Y Projections
5.1.3. Base Point Share Analysis
5.2. Global Robo-taxi Market Size (Units), Revenue (US$ Mn) Analysis & Forecast, 2017-2031, By Service Type
5.2.1. Rental-based
5.2.2. Station-based
6. Global Robo-taxi Market, By Taxi Type
6.1. Market Snapshot
6.1.1. Introduction, Definition, and Key Findings
6.1.2. Market Growth & Y-o-Y Projections
6.1.3. Base Point Share Analysis
6.2. Global Robo-taxi Market Size (Units), Revenue (US$ Mn) Analysis & Forecast, 2017-2031, By Taxi Type
6.2.1. Cars
6.2.2. Shuttles
7. Global Robo-taxi Market, By Propulsion
7.1. Market Snapshot
7.1.1. Introduction, Definition, and Key Findings
7.1.2. Market Growth & Y-o-Y Projections
7.1.3. Base Point Share Analysis
7.2. Global Robo-taxi Market Size (Units), Revenue (US$ Mn) Analysis & Forecast, 2017-2031, By Propulsion
7.2.1. Internal Combustion Engine Vehicles
7.2.2. Hybrid Vehicles
7.2.3. Fully Electric Vehicles
8. Global Robo-taxi Market, by Region
8.1. Market Snapshot
8.1.1. Introduction, Definition, and Key Findings
8.1.2. Market Growth & Y-o-Y Projections
8.1.3. Base Point Share Analysis
8.2. Global Robo-taxi Market Size (Units), Revenue (US$ Mn) Analysis & Forecast, 2017-2031, By Region
8.2.1. North America
8.2.2. Europe
8.2.3. Asia Pacific
8.2.4. Middle East & Africa
8.2.5. South America
9. North America Robo-taxi Market
9.1. Market Snapshot
9.2. Robo-taxi Market Size (Units), Revenue (US$ Mn) Analysis & Forecast, 2017-2031, By Level of Autonomy
9.2.1. Level 4
9.2.2. Level 5
9.3. Robo-taxi Market Size (Units), Revenue (US$ Mn) Analysis & Forecast, 2017-2031, By Service Type
9.3.1. Rental-based
9.3.2. Station-based
9.4. Robo-taxi Market Size (Units), Revenue (US$ Mn) Analysis & Forecast, 2017-2031, By Taxi Type
9.4.1. Cars
9.4.2. Shuttles
9.5. Robo-taxi Market Size (Units), Revenue (US$ Mn) Analysis & Forecast, 2017-2031, By Propulsion
9.5.1. Internal Combustion Engine Vehicles
9.5.2. Hybrid Vehicles
9.5.3. Fully Electric Vehicles
9.6. Key Country Analysis – North America Robo-taxi Market Size Analysis & Forecast, 2017-2031
9.6.1. U.S.
9.6.2. Canada
9.6.3. Mexico
10. Europe Robo-taxi Market
10.1. Market Snapshot
10.2. Robo-taxi Market Size (Units), Revenue (US$ Mn) Analysis & Forecast, 2017-2031, By Level of Autonomy
10.2.1. Level 4
10.2.2. Level 5
10.3. Robo-taxi Market Size (Units), Revenue (US$ Mn) Analysis & Forecast, 2017-2031, By Service Type
10.3.1. Rental-based
10.3.2. Station-based
10.4. Robo-taxi Market Size (Units), Revenue (US$ Mn) Analysis & Forecast, 2017-2031, By Taxi Type
10.4.1. Cars
10.4.2. Shuttles
10.5. Robo-taxi Market Size (Units), Revenue (US$ Mn) Analysis & Forecast, 2017-2031, By Propulsion
10.5.1. Internal Combustion Engine Vehicles
10.5.2. Hybrid Vehicles
10.5.3. Fully Electric Vehicles
10.6. Key Country Analysis – Europe Robo-taxi Market Size Analysis & Forecast, 2017-2031
10.6.1. Germany
10.6.2. U. K.
10.6.3. France
10.6.4. Italy
10.6.5. Spain
10.6.6. Nordic Countries
10.6.7. Russia & CIS
10.6.8. Rest of Europe
11. Asia Pacific Robo-taxi Market
11.1. Market Snapshot
11.2. Robo-taxi Market Size (Units), Revenue (US$ Mn) Analysis & Forecast, 2017-2031, By Level of Autonomy
11.2.1. Level 4
11.2.2. Level 5
11.3. Robo-taxi Market Size (Units), Revenue (US$ Mn) Analysis & Forecast, 2017-2031, By Service Type
11.3.1. Rental-based
11.3.2. Station-based
11.4. Robo-taxi Market Size (Units), Revenue (US$ Mn) Analysis & Forecast, 2017-2031, By Taxi Type
11.4.1. Cars
11.4.2. Shuttles
11.5. Robo-taxi Market Size (Units), Revenue (US$ Mn) Analysis & Forecast, 2017-2031, By Propulsion
11.5.1. Internal Combustion Engine Vehicles
11.5.2. Hybrid Vehicles
11.5.3. Fully Electric Vehicles
11.6. Key Country Analysis – Asia Pacific Robo-taxi Market Size Analysis & Forecast, 2017-2031
11.6.1. China
11.6.2. India
11.6.3. Japan
11.6.4. ASEAN Countries
11.6.5. South Korea
11.6.6. ANZ
11.6.7. Rest of Asia Pacific
12. Middle East & Africa Robo-taxi Market
12.1. Market Snapshot
12.2. Robo-taxi Market Size (Units), Revenue (US$ Mn) Analysis & Forecast, 2017-2031, By Level of Autonomy
12.2.1. Level 4
12.2.2. Level 5
12.3. Robo-taxi Market Size (Units), Revenue (US$ Mn) Analysis & Forecast, 2017-2031, By Service Type
12.3.1. Rental-based
12.3.2. Station-based
12.4. Robo-taxi Market Size (Units), Revenue (US$ Mn) Analysis & Forecast, 2017-2031, By Taxi Type
12.4.1. Cars
12.4.2. Shuttles
12.5. Robo-taxi Market Size (Units), Revenue (US$ Mn) Analysis & Forecast, 2017-2031, By Propulsion
12.5.1. Internal Combustion Engine Vehicles
12.5.2. Hybrid Vehicles
12.5.3. Fully Electric Vehicles
12.6. Key Country Analysis – Middle East & Africa Robo-taxi Market Size Analysis & Forecast, 2017-2031
12.6.1. GCC
12.6.2. South Africa
12.6.3. Turkey
12.6.4. Rest of Middle East & Africa
13. South America Robo-taxi Market
13.1. Market Snapshot
13.2. Robo-taxi Market Size (Units), Revenue (US$ Mn) Analysis & Forecast, 2017-2031, By Level of Autonomy
13.2.1. Level 4
13.2.2. Level 5
13.3. Robo-taxi Market Size (Units), Revenue (US$ Mn) Analysis & Forecast, 2017-2031, By Service Type
13.3.1. Rental-based
13.3.2. Station-based
13.4. Robo-taxi Market Size (Units), Revenue (US$ Mn) Analysis & Forecast, 2017-2031, By Taxi Type
13.4.1. Cars
13.4.2. Shuttles
13.5. Robo-taxi Market Size (Units), Revenue (US$ Mn) Analysis & Forecast, 2017-2031, By Propulsion
13.5.1. Internal Combustion Engine Vehicles
13.5.2. Hybrid Vehicles
13.5.3. Fully Electric Vehicles
13.6. Key Country Analysis – South America Robo-taxi Market Size Analysis & Forecast, 2017-2031
13.6.1. Brazil
13.6.2. Argentina
13.6.3. Rest of South America
14. Competitive Landscape
14.1. Company Share Analysis/ Brand Share Analysis, 2020
14.2. Company Analysis for each player (Company Overview, Company Footprints, Production Locations, Product Portfolio, Competitors & Customers, Subsidiaries & Parent Organization, Recent Developments, Financial Analysis, Profitability, Revenue Share)
15. Company Profile/ Key Players
15.1. Waymo LLC
15.1.1. Company Overview
15.1.2. Company Footprints
15.1.3. Production Locations
15.1.4. Product Portfolio
15.1.5. Competitors & Customers
15.1.6. Subsidiaries & Parent Organization
15.1.7. Recent Developments
15.1.8. Financial Analysis
15.1.9. Profitability
15.1.10. Revenue Share
15.2. Tesla, Inc.
15.2.1. Company Overview
15.2.2. Company Footprints
15.2.3. Production Locations
15.2.4. Product Portfolio
15.2.5. Competitors & Customers
15.2.6. Subsidiaries & Parent Organization
15.2.7. Recent Developments
15.2.8. Financial Analysis
15.2.9. Profitability
15.2.10. Revenue Share
15.3. Uber Technologies, Inc.
15.3.1. Company Overview
15.3.2. Company Footprints
15.3.3. Production Locations
15.3.4. Product Portfolio
15.3.5. Competitors & Customers
15.3.6. Subsidiaries & Parent Organization
15.3.7. Recent Developments
15.3.8. Financial Analysis
15.3.9. Profitability
15.3.10. Revenue Share
15.4. Lyft, Inc.
15.4.1. Company Overview
15.4.2. Company Footprints
15.4.3. Production Locations
15.4.4. Product Portfolio
15.4.5. Competitors & Customers
15.4.6. Subsidiaries & Parent Organization
15.4.7. Recent Developments
15.4.8. Financial Analysis
15.4.9. Profitability
15.4.10. Revenue Share
15.5. AB Volvo
15.5.1. Company Overview
15.5.2. Company Footprints
15.5.3. Production Locations
15.5.4. Product Portfolio
15.5.5. Competitors & Customers
15.5.6. Subsidiaries & Parent Organization
15.5.7. Recent Developments
15.5.8. Financial Analysis
15.5.9. Profitability
15.5.10. Revenue Share
15.6. Ford Motor Company
15.6.1. Company Overview
15.6.2. Company Footprints
15.6.3. Production Locations
15.6.4. Product Portfolio
15.6.5. Competitors & Customers
15.6.6. Subsidiaries & Parent Organization
15.6.7. Recent Developments
15.6.8. Financial Analysis
15.6.9. Profitability
15.6.10. Revenue Share
15.7. AutoX, Inc.
15.7.1. Company Overview
15.7.2. Company Footprints
15.7.3. Production Locations
15.7.4. Product Portfolio
15.7.5. Competitors & Customers
15.7.6. Subsidiaries & Parent Organization
15.7.7. Recent Developments
15.7.8. Financial Analysis
15.7.9. Profitability
15.7.10. Revenue Share
15.8. Aptiv PLC
15.8.1. Company Overview
15.8.2. Company Footprints
15.8.3. Production Locations
15.8.4. Product Portfolio
15.8.5. Competitors & Customers
15.8.6. Subsidiaries & Parent Organization
15.8.7. Recent Developments
15.8.8. Financial Analysis
15.8.9. Profitability
15.8.10. Revenue Share
15.9. NAVYA
15.9.1. Company Overview
15.9.2. Company Footprints
15.9.3. Production Locations
15.9.4. Product Portfolio
15.9.5. Competitors & Customers
15.9.6. Subsidiaries & Parent Organization
15.9.7. Recent Developments
15.9.8. Financial Analysis
15.9.9. Profitability
15.9.10. Revenue Share
15.10. Cruise LLC
15.10.1. Company Overview
15.10.2. Company Footprints
15.10.3. Production Locations
15.10.4. Product Portfolio
15.10.5. Competitors & Customers
15.10.6. Subsidiaries & Parent Organization
15.10.7. Recent Developments
15.10.8. Financial Analysis
15.10.9. Profitability
15.10.10. Revenue Share
15.11. Baidu, Inc.
15.11.1. Company Overview
15.11.2. Company Footprints
15.11.3. Production Locations
15.11.4. Product Portfolio
15.11.5. Competitors & Customers
15.11.6. Subsidiaries & Parent Organization
15.11.7. Recent Developments
15.11.8. Financial Analysis
15.11.9. Profitability
15.11.10. Revenue Share
15.12. EasyMile
15.12.1. Company Overview
15.12.2. Company Footprints
15.12.3. Production Locations
15.12.4. Product Portfolio
15.12.5. Competitors & Customers
15.12.6. Subsidiaries & Parent Organization
15.12.7. Recent Developments
15.12.8. Financial Analysis
15.12.9. Profitability
15.12.10. Revenue Share
15.13. Beijing Xiaoju Technology Co., Ltd.
15.13.1. Company Overview
15.13.2. Company Footprints
15.13.3. Production Locations
15.13.4. Product Portfolio
15.13.5. Competitors & Customers
15.13.6. Subsidiaries & Parent Organization
15.13.7. Recent Developments
15.13.8. Financial Analysis
15.13.9. Profitability
15.13.10. Revenue Share
15.14. MOIA
15.14.1. Company Overview
15.14.2. Company Footprints
15.14.3. Production Locations
15.14.4. Product Portfolio
15.14.5. Competitors & Customers
15.14.6. Subsidiaries & Parent Organization
15.14.7. Recent Developments
15.14.8. Financial Analysis
15.14.9. Profitability
15.14.10. Revenue Share
15.15. Others
15.15.1. Company Overview
15.15.2. Company Footprints
15.15.3. Production Locations
15.15.4. Product Portfolio
15.15.5. Competitors & Customers
15.15.6. Subsidiaries & Parent Organization
15.15.7. Recent Developments
15.15.8. Financial Analysis
15.15.9. Profitability
15.15.10. Revenue Share
List of Tables
Table 1: Global Robo-taxi Market Size & Forecast, Volume (Thousand Units), by Level of Autonomy, 2017-2031
Table 2: Global Robo-taxi Market Size & Forecast, Value (US$ Bn), by Level of Autonomy, 2017-2031
Table 3: Global Robo-taxi Market Size & Forecast, Volume (Thousand Units), by Service Type, 2017-2031
Table 4: Global Robo-taxi Market Size & Forecast, Value (US$ Bn), by Service Type, 2017-2031
Table 5: Global Robo-taxi Market Size & Forecast, Volume (Thousand Units), by Taxi Type, 2017-2031
Table 6: Global Robo-taxi Market Size & Forecast, Value (US$ Bn), by Taxi Type, 2017-2031
Table 7: Global Robo-taxi Market Size & Forecast, Volume (Thousand Units), by Propulsion, 2017-2031
Table 8: Global Robo-taxi Market Size & Forecast, Value (US$ Bn), by Propulsion, 2017-2031
Table 9: Global Robo-taxi Market Size & Forecast, Volume (Thousand Units), by Region, 2017-2031
Table 10: Global Robo-taxi Market Size & Forecast, Revenue (US$ Bn), by Region, 2017-2031
Table 11: North America Robo-taxi Market Size & Forecast, Volume (Thousand Units), by Level of Autonomy, 2017-2031
Table 12: North America Robo-taxi Market Size & Forecast, Value (US$ Bn), by Level of Autonomy, 2017-2031
Table 13: North America Robo-taxi Market Size & Forecast, Volume (Thousand Units), by Service Type, 2017-2031
Table 14: North America Robo-taxi Market Size & Forecast, Value (US$ Bn), by Service Type, 2017-2031
Table 15: North America Robo-taxi Market Size & Forecast, Volume (Thousand Units), by Taxi Type, 2017-2031
Table 16: North America Robo-taxi Market Size & Forecast, Value (US$ Bn), by Taxi Type, 2017-2031
Table 17: North America Robo-taxi Market Size & Forecast, Volume (Thousand Units), by Propulsion, 2017-2031
Table 18: North America Robo-taxi Market Size & Forecast, Value (US$ Bn), by Propulsion, 2017-2031
Table 19: North America Robo-taxi Market Size & Forecast, Volume (Thousand Units), by Country, 2017-2031
Table 20: North America Robo-taxi Market Size & Forecast, Revenue (US$ Bn), by Country, 2017-2031
Table 21: Europe Robo-taxi Market Size & Forecast, Volume (Thousand Units), by Level of Autonomy, 2017-2031
Table 22: Europe Robo-taxi Market Size & Forecast, Value (US$ Bn), by Level of Autonomy, 2017-2031
Table 23: Europe Robo-taxi Market Size & Forecast, Volume (Thousand Units), by Service Type, 2017-2031
Table 24: Europe Robo-taxi Market Size & Forecast, Value (US$ Bn), by Service Type, 2017-2031
Table 25: Europe Robo-taxi Market Size & Forecast, Volume (Thousand Units), by Taxi Type, 2017-2031
Table 26: Europe Robo-taxi Market Size & Forecast, Value (US$ Bn), by Taxi Type, 2017-2031
Table 27: Europe Robo-taxi Market Size & Forecast, Volume (Thousand Units), by Propulsion, 2017-2031
Table 28: Europe Robo-taxi Market Size & Forecast, Value (US$ Bn), by Propulsion, 2017-2031
Table 29: Europe Robo-taxi Market Size & Forecast, Volume (Thousand Units), by Country, 2017-2031
Table 30: Europe Robo-taxi Market Size & Forecast, Revenue (US$ Bn), by Country, 2017-2031
Table 31: Asia Pacific Robo-taxi Market Size & Forecast, Volume (Thousand Units), by Level of Autonomy, 2017-2031
Table 32: Asia Pacific Robo-taxi Market Size & Forecast, Value (US$ Bn), by Level of Autonomy, 2017-2031
Table 33: Asia Pacific Robo-taxi Market Size & Forecast, Volume (Thousand Units), by Service Type, 2017-2031
Table 34: Asia Pacific Robo-taxi Market Size & Forecast, Value (US$ Bn), by Service Type, 2017-2031
Table 35: Asia Pacific Robo-taxi Market Size & Forecast, Volume (Thousand Units), by Taxi Type, 2017-2031
Table 36: Asia Pacific Robo-taxi Market Size & Forecast, Value (US$ Bn), by Taxi Type, 2017-2031
Table 37: Asia Pacific Robo-taxi Market Size & Forecast, Volume (Thousand Units), by Propulsion, 2017-2031
Table 38: Asia Pacific Robo-taxi Market Size & Forecast, Value (US$ Bn), by Propulsion, 2017-2031
Table 39: Asia Pacific Robo-taxi Market Size & Forecast, Volume (Thousand Units), by Country, 2017-2031
Table 40: Asia Pacific Robo-taxi Market Size & Forecast, Revenue (US$ Bn), by Country, 2017-2031
Table 41: Middle East & Africa Robo-taxi Market Size & Forecast, Volume (Thousand Units), by Level of Autonomy, 2017-2031
Table 42: Middle East & Africa Robo-taxi Market Size & Forecast, Value (US$ Bn), by Level of Autonomy, 2017-2031
Table 43: Middle East & Africa Robo-taxi Market Size & Forecast, Volume (Thousand Units), by Service Type, 2017-2031
Table 44: Middle East & Africa Robo-taxi Market Size & Forecast, Value (US$ Bn), by Service Type, 2017-2031
Table 45: Middle East & Africa Robo-taxi Market Size & Forecast, Volume (Thousand Units), by Taxi Type, 2017-2031
Table 46: Middle East & Africa Robo-taxi Market Size & Forecast, Value (US$ Bn), by Taxi Type, 2017-2031
Table 47: Middle East & Africa Robo-taxi Market Size & Forecast, Volume (Thousand Units), by Propulsion, 2017-2031
Table 48: Middle East & Africa Robo-taxi Market Size & Forecast, Value (US$ Bn), by Propulsion, 2017-2031
Table 49: Middle East & Africa Robo-taxi Market Size & Forecast, Volume (Thousand Units), by Country, 2017-2031
Table 50: Middle East & Africa Robo-taxi Market Size & Forecast, Revenue (US$ Bn), by Country, 2017-2031
Table 51: South America Robo-taxi Market Size & Forecast, Volume (Thousand Units), by Level of Autonomy, 2017-2031
Table 52: South America Robo-taxi Market Size & Forecast, Value (US$ Bn), by Level of Autonomy, 2017-2031
Table 53: South America Robo-taxi Market Size & Forecast, Volume (Thousand Units), by Service Type, 2017-2031
Table 54: South America Robo-taxi Market Size & Forecast, Value (US$ Bn), by Service Type, 2017-2031
Table 55: South America Robo-taxi Market Size & Forecast, Volume (Thousand Units), by Taxi Type, 2017-2031
Table 56: South America Robo-taxi Market Size & Forecast, Value (US$ Bn), by Taxi Type, 2017-2031
Table 57: South America Robo-taxi Market Size & Forecast, Volume (Thousand Units), by Propulsion, 2017-2031
Table 58: South America Robo-taxi Market Size & Forecast, Value (US$ Bn), by Propulsion, 2017-2031
Table 59: South America Robo-taxi Market Size & Forecast, Volume (Thousand Units), by Country, 2017-2031
Table 60: South America Robo-taxi Market Size & Forecast, Revenue (US$ Bn), by Country, 2017-2031
List of Figures
Figure 1: Global Robo-taxi Market Volume (Thousand Units) Forecast, 2017–2031
Figure 2: Global Robo-taxi Market Revenue (US$ Billion) Forecast, 2017–2031
Figure 3: Key Segment Analysis for Global
Figure 4: Global Robo-taxi Market Size & Forecast, Revenue (US$ Bn), 2017-2031
Figure 5: Global Robo-taxi Market Size & Forecast, Revenue (US$ Bn), by Level of Autonomy, 2017-2031
Figure 6: Global Market Attractiveness, Value (US$ Bn), by Level of Autonomy, 2022-2031
Figure 7: Global Robo-taxi Market Size & Forecast, Revenue (US$ Bn), by Service Type, 2017-2031
Figure 8: Global Market Attractiveness, Value (US$ Bn), by Service Type, 2022-2031
Figure 9: Global Robo-taxi Market Size & Forecast, Revenue (US$ Bn), by Taxi Type, 2017-2031
Figure 10: Global Market Attractiveness, Value (US$ Bn), by Taxi Type, 2022-2031
Figure 11: Global Robo-taxi Market Size & Forecast, Revenue (US$ Bn), by Propulsion, 2017-2031
Figure 12: Global Market Attractiveness, Value (US$ Bn), by Propulsion, 2022-2031
Figure 13: Global Robo-taxi Market Size & Forecast, Revenue (US$ Bn), by Region, 2017-2031
Figure 14: Global Market Attractiveness, Value (US$ Bn), by Region, 2022-2031
Figure 15: North America Robo-taxi Market Size & Forecast, Revenue (US$ Bn), by Level of Autonomy, 2017-2031
Figure 16: North America Market Attractiveness, Value (US$ Bn), by Level of Autonomy, 2022-2031
Figure 17: North America Robo-taxi Market Size & Forecast, Revenue (US$ Bn), by Service Type, 2017-2031
Figure 18: North America Market Attractiveness, Value (US$ Bn), by Service Type, 2022-2031
Figure 19: North America Robo-taxi Market Size & Forecast, Revenue (US$ Bn), by Taxi Type, 2017-2031
Figure 20: North America Market Attractiveness, Value (US$ Bn), by Taxi Type, 2022-2031
Figure 21: North America Robo-taxi Market Size & Forecast, Revenue (US$ Bn), by Propulsion, 2017-2031
Figure 22: North America Market Attractiveness, Value (US$ Bn), by Propulsion, 2022-2031
Figure 23: North America Robo-taxi Market Size & Forecast, Revenue (US$ Bn), by Country, 2017-2031
Figure 24: North America Market Attractiveness, Value (US$ Bn), by Country, 2022-2031
Figure 25: Europe Robo-taxi Market Size & Forecast, Revenue (US$ Bn), by Level of Autonomy, 2017-2031
Figure 26: Europe Market Attractiveness, Value (US$ Bn), by Level of Autonomy, 2022-2031
Figure 27: Europe Robo-taxi Market Size & Forecast, Revenue (US$ Bn), by Service Type, 2017-2031
Figure 28: Europe Market Attractiveness, Value (US$ Bn), by Service Type, 2022-2031
Figure 29: Europe Robo-taxi Market Size & Forecast, Revenue (US$ Bn), by Taxi Type, 2017-2031
Figure 30: Europe Market Attractiveness, Value (US$ Bn), by Taxi Type, 2022-2031
Figure 31: Europe Robo-taxi Market Size & Forecast, Revenue (US$ Bn), by Propulsion, 2017-2031
Figure 32: Europe Market Attractiveness, Value (US$ Bn), by Propulsion, 2022-2031
Figure 33: Europe Robo-taxi Market Size & Forecast, Revenue (US$ Bn), by Country, 2017-2031
Figure 34: Europe Market Attractiveness, Value (US$ Bn), by Country, 2022-2031
Figure 35: Asia Pacific Robo-taxi Market Size & Forecast, Revenue (US$ Bn), by Level of Autonomy, 2017-2031
Figure 36: Asia Pacific Market Attractiveness, Value (US$ Bn), by Level of Autonomy, 2022-2031
Figure 37: Asia Pacific Robo-taxi Market Size & Forecast, Revenue (US$ Bn), by Service Type, 2017-2031
Figure 38: Asia Pacific Market Attractiveness, Value (US$ Bn), by Service Type, 2022-2031
Figure 39: Asia Pacific Robo-taxi Market Size & Forecast, Revenue (US$ Bn), by Taxi Type, 2017-2031
Figure 40: Asia Pacific Market Attractiveness, Value (US$ Bn), by Taxi Type, 2022-2031
Figure 41: Asia Pacific Robo-taxi Market Size & Forecast, Revenue (US$ Bn), by Propulsion, 2017-2031
Figure 42: Asia Pacific Market Attractiveness, Value (US$ Bn), by Propulsion, 2022-2031
Figure 43: Asia Pacific Robo-taxi Market Size & Forecast, Revenue (US$ Bn), by Country, 2017-2031
Figure 44: Asia Pacific Market Attractiveness, Value (US$ Bn), by Country, 2022-2031
Figure 45: Middle East & Africa Robo-taxi Market Size & Forecast, Revenue (US$ Bn), by Level of Autonomy, 2017-2031
Figure 46: Middle East & Africa Market Attractiveness, Value (US$ Bn), by Level of Autonomy, 2022-2031
Figure 47: Middle East & Africa Robo-taxi Market Size & Forecast, Revenue (US$ Bn), by Service Type, 2017-2031
Figure 48: Middle East & Africa Market Attractiveness, Value (US$ Bn), by Service Type, 2022-2031
Figure 49: Middle East & Africa Robo-taxi Market Size & Forecast, Revenue (US$ Bn), by Taxi Type, 2017-2031
Figure 50: Middle East & Africa Market Attractiveness, Value (US$ Bn), by Taxi Type, 2022-2031
Figure 51: Middle East & Africa Robo-taxi Market Size & Forecast, Revenue (US$ Bn), by Propulsion, 2017-2031
Figure 52: Middle East & Africa Market Attractiveness, Value (US$ Bn), by Propulsion, 2022-2031
Figure 53: Middle East & Africa Robo-taxi Market Size & Forecast, Revenue (US$ Bn), by Country, 2017-2031
Figure 54: Middle East & Africa Market Attractiveness, Value (US$ Bn), by Country, 2022-2031
Figure 55: South America Robo-taxi Market Size & Forecast, Revenue (US$ Bn), by Level of Autonomy, 2017-2031
Figure 56: South America Market Attractiveness, Value (US$ Bn), by Level of Autonomy, 2022-2031
Figure 57: South America Robo-taxi Market Size & Forecast, Revenue (US$ Bn), by Service Type, 2017-2031
Figure 58: South America Market Attractiveness, Value (US$ Bn), by Service Type, 2022-2031
Figure 59: South America Robo-taxi Market Size & Forecast, Revenue (US$ Bn), by Taxi Type, 2017-2031
Figure 60: South America Market Attractiveness, Value (US$ Bn), by Taxi Type, 2022-2031
Figure 61: South America Robo-taxi Market Size & Forecast, Revenue (US$ Bn), by Propulsion, 2017-2031
Figure 62: South America Market Attractiveness, Value (US$ Bn), by Propulsion, 2022-2031
Figure 63: South America Robo-taxi Market Size & Forecast, Revenue (US$ Bn), by Country, 2017-2031
Figure 64: South America Market Attractiveness, Value (US$ Bn), by Country, 2022-2031
Copyright © Transparency Market Research, Inc. All Rights reserved
Trust Online

Robo-Taxi Market Growth, Forecast 2022-2031