
Reports
Reports
The global retort pouch market is choc-o-bloc with keen players trying to stay ahead of the curve through cost-reductions and improved products. This makes the competition stiff in the market. Serving to boost the market is the busy lifestyle of people worldwide, which has upped the demand for ready-to-eat food products for which the most preferred packages are retort pouches.
Various keen companies’ efforts to churn out more sophisticated and eye-catching products is also catalyzing growth in the global retort pouches market. Retort pouches are supplanting cans in the food packaging industry because of their ability to prolong the shelf life to the product. Recyclability issues of retort pouches, on account of the multi-layer materials used in them, however, is posing a challenge to the market.
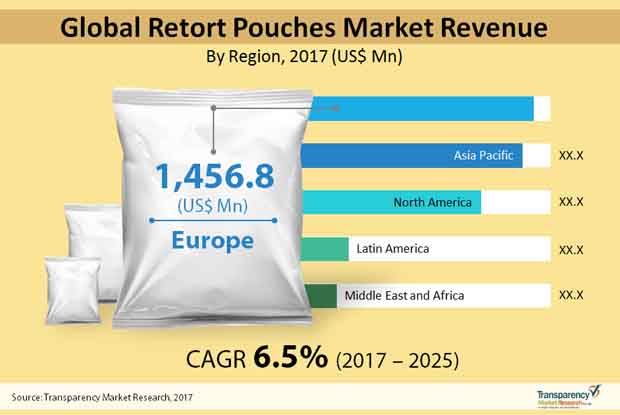
According to Transparency Market Research, the global retort pouch market will likely rise at a steady CAGR of 6.5% from 2017 to 2025, to pull in a revenue of US$7.51 bn by 2025 from US$4.29 bn in 2016.
The global retort pouch market can be segmented based on different parameters. Depending upon material type, for example, the market can be classified into aluminum foil, polypropylene (PP), food cast PP, polyamide, and polyethylene. The polyethylene can be further segmented into HDPE, LDPE, and LLDPE. At present, the segment of aluminum foil is highly popular in developing countries, while polyamide is seeing substantial uptake in developed continents of Europe and North America. The TMR report predicts the aluminum foil segment to register a CAGR of 6.7% from 2016 to 2025. The PP and food cast PP materials are also expected to gain considerable market share in developed pockets in Asia Pacific and Europe. Polyamide and polyethylene materials, on the other hand, will see slower uptake for making retort pouches due to health hazards posed by them.
From a geographic standpoint, Asia Pacific leads the market in terms of growth rate. By rising at a 7.5% CAGR in the forecast period, the market in the region is projected account for a dominant share in revenue – about US$2.54 bn – by 2025. The annual consumption of retort pouches is expected to touch 12,176 million units by 2025-end in the region, which currently holds 31.3 % share in the market. Asia Pacific’s dominant position is mainly a result of soaring demand for safe and hygienic ready-to-eat meals and pet foods in the region.
Europe, again, is a key market which currently holds a dominant share in the overall revenue. By clocking a 5.9% CAGR in the forecast period, the market in the region will likely lose some of its share in revenue to become worth US$2.30 bn by 2025. Vis-à-vis volume, the market in the region will likely register a CAGR of 5.5%. The Middle East and Africa is predicted to be a fast expanding market too along with South America. The market in North America is expected to register a healthy CAGR of 5.9%, over the forecast period to reach US$ 1,829.5, by the end of 2025.
Some of the key players operating in the global retort pouch market are Sealed Air Corporation, Huhtamaki Group, Amcor Ltd., Mondi Group, Bemis Company, Inc., Clifton Packaging Group Ltd., Foshan Nanhai LD Packaging Co., Ltd., Sonoco Products Company, Constantia Flexibles International GmbH, ProAmpac, Alliedflex Technologies Ltd., Flexi-Pack Ltd., Flair Flexible Packaging, Tong Yuan Packaging Co. Ltd., Purity Flexipack Ltd., MST Packaging Co., Ltd., and Avonflex.
1. Executive Summary
2. Market Introduction
2.1. Market Definition
2.2. Market Taxonomy
3. Retort Pouches Market Overview
3.1. Introduction
3.2. Industry Trends and Recent Developments
3.3. Retort Pouches Market and Y-o-Y Growth
3.4. Retort Pouches Market Value (US$ Mn) and Volume (Mn Units) Forecast
4. Retort Pouches Market Analysis
4.1. Pricing Analysis
4.1.1. Pricing Assumption
4.2. Market Size (US$ Mn) and Forecast
4.2.1. Market Size and Y-o-Y Growth
4.2.2. Absolute $ Opportunity
4.3. Market Overview
4.3.1. Value Chain
4.3.1.1. Raw Material Suppliers
4.3.1.2. Barrier Film Suppliers
4.3.1.3. Manufacturers
4.3.1.4. End Users
4.3.2. List of Active Participants
5. Market Dynamics
5.1. Drivers
5.1.1. Supply Side
5.1.2. Demand Side
5.2. Restraints
5.3. Opportunity
5.4. Trends
6. Global Retort Pouches Market Analysis and Forecast, By Barrier Material Type
6.1. Introduction
6.1.1. Market share and Basis Points (BPS) Analysis By Barrier Material Type
6.1.2. Y-o-Y Growth Projections By Barrier Material Type
6.2. Market Size (US$ Mn) and Volume (Mn Units) Forecast, By Barrier Material Type
6.2.1. Aluminum Foil
6.2.2. Polypropylene
6.2.3. Food-Grade Cast Polypropylene
6.2.4. Polyamide
6.2.5. Polyethylene
6.2.5.1. HDPE
6.2.5.2. LDPE
6.2.5.3. LLDPE
6.3. Market Analysis By Barrier Material Type
6.4. Prominent Trends
7. Global Retort Pouches Market Analysis and Forecast, By Application
7.1. Introduction
7.1.1. Market share and Basis Points (BPS) Analysis By Application
7.1.2. Y-o-Y Growth Projections By Application
7.2. Market Size (US$ Mn) and Volume (Mn Units) Forecast, By Application
7.2.1. Food
7.2.1.1. Pet food
7.2.1.2. Baby food
7.2.1.3. Fresh Produce
7.2.1.4. Meat & Sea food
7.2.1.5. Ready-to-eat meals
7.2.1.6. Soups & Sauces
7.2.1.7. Others
7.2.2. Pharmaceutical & others
7.3. Market Attractiveness Analysis By Application
7.4. Prominent Trends
8. Global Retort Pouches Market Analysis and Forecast, By Product Type
8.1. Introduction
8.1.1. Market share and Basis Points (BPS) Analysis By Product Type
8.1.2. Y-o-Y Growth Projections By Product Type
8.2. Market Size (US$ Mn) and Volume (Mn Units) Forecast, By Product Type
8.2.1. Stand-up Pouches
8.2.2. Spouted Pouches
8.2.3. Zipper Pouches
8.2.4. Pillow Pack
8.2.5. 3-side sealed
8.3. Market Attractiveness Analysis By Product Type
8.4. Prominent Trends
9. Global Retort Pouches Market Analysis and Forecast, By Capacity
9.1. Introduction
9.1.1. Market share and Basis Points (BPS) Analysis By Capacity
9.1.2. Y-o-Y Growth Projections By Capacity
9.2. Market Size (US$ Mn) and Volume (Mn Units) Forecast, By Capacity
9.2.1. 0 ml – 350 ml
9.2.2. 351 ml -500 ml
9.2.3. 501 ml – 100 ml
9.2.4. 1000 ml – 3000 ml
9.2.5. Above 3001 ml
9.3. Market Attractiveness Analysis By Capacity
9.4. Prominent Trends
10. Global Retort Pouches Market Analysis and Forecast, By Closure Type
10.1. Introduction
10.1.1. Market share and Basis Points (BPS) Analysis By Closure Type
10.1.2. Y-o-Y Growth Projections By Closure Type
10.2. With Cap
10.2.1. Screw Cap
10.2.2. Flip Cap
10.2.3. Flip Top Cap
10.2.4. Pour Spouted Cap
10.2.5. Others
10.3. Without Cap
10.3.1. Sealed (Tear & Open)
10.3.2. Zipper/Zip Lock
10.3.3. Others
10.4. Market Attractiveness Analysis By Closure Type
10.5. Prominent Trends
11. Global Retort Pouches Market Analysis and Forecast, By Region
11.1. Introduction
11.1.1. Market share and Basis Points (BPS) Analysis By Region
11.1.2. Y-o-Y Growth Projections By Region
11.2. Market Size (US$ Mn) and Volume (Mn Units) Forecast By Region
11.2.1. North America
11.2.2. Latin America
11.2.3. Europe
11.2.4. Asia Pacific
11.2.5. Middle East and Africa (MEA)
11.3. Market Attractiveness Analysis By Region
12. North America Retort Pouches Market Analysis and Forecast
12.1. Introduction
12.1.1. Market share and Basis Points (BPS) Analysis By Country
12.1.2. Y-o-Y Growth Projections By Country
12.1.3. Key Regulations
12.2. Market Size (US$ Mn) and Volume (Mn Units) Forecast By Country
12.2.1. U.S.
12.2.2. Canada
12.3. Market Size (US$ Mn) and Volume (Mn Units) Forecast By Barrier Material Type
12.3.1. Aluminum Foil
12.3.2. Polypropylene
12.3.3. Food-Grade Cast Polypropylene
12.3.4. Polyamide
12.3.5. Polyethylene
12.3.5.1. HDPE
12.3.5.2. LDPE
12.3.5.3. LLDPE
12.4. Market Size (US$ Mn) and Volume (Mn Units) Forecast By Application
12.4.1. Food
12.4.1.1. Pet food
12.4.1.2. Baby food
12.4.1.3. Fresh Produce
12.4.1.4. Meat & Sea food
12.4.1.5. Ready-to-eat meals
12.4.1.6. Soups & Sauces
12.4.1.7. Others
12.4.2. Pharmaceutical & Others
12.5. Market Size (US$ Mn) and Volume (Mn Units) Forecast By Product Type
12.5.1. Stand-up Pouches
12.5.2. Spouted Pouches
12.5.3. Zipper Pouches
12.5.4. Pillow Pack
12.5.5. 3-side sealed
12.6. Market Size (US$ Mn) and Volume (Mn Units) Forecast By Closure Type
12.6.1. With Cap
12.6.1.1. Screw Cap
12.6.1.2. Flip Cap
12.6.1.3. Flip Top Cap
12.6.1.4. Pour Spouted Cap
12.6.1.5. Others
12.6.2. Without Cap
12.6.2.1. Sealed (Tear & Open)
12.6.2.2. Zipper/Zip Lock
12.6.2.3. Others
12.7. Market Size (US$ Mn) and Volume (Mn Units) Forecast By Capacity
12.7.1. 0 ml – 350 ml
12.7.2. 351 ml -500 ml
12.7.3. 501 ml – 100 ml
12.7.4. 1000 ml – 3000 ml
12.7.5. Above 3001 ml
12.8. Market Attractiveness Analysis
12.8.1. By Country
12.8.2. By Barrier Material Type
12.8.3. By Application
12.8.4. By Product Type
12.8.5. By Closure Type
12.8.6. By Capacity
12.9. Prominent Trends
13. Latin America Retort Pouches Market Analysis and Forecast
13.1. Introduction
13.1.1. Market share and Basis Points (BPS) Analysis By Country
13.1.2. Y-o-Y Growth Projections By Country
13.1.3. Key Regulations
13.2. Market Size (US$ Mn) and Volume (Mn Units) Forecast By Country
13.2.1. Brazil
13.2.2. Mexico
13.2.3. Argentina
13.2.4. Rest of Latin America
13.3. Market Size (US$ Mn) and Volume (Mn Units) Forecast By Barrier Material Type
13.3.1. Aluminum Foil
13.3.2. Polypropylene
13.3.3. Food-Grade Cast Polypropylene
13.3.4. Polyamide
13.3.5. Polyethylene
13.3.5.1. HDPE
13.3.5.2. LDPE
13.3.5.3. LLDPE
13.3.6. Others
13.4. Market Size (US$ Mn) and Volume (Mn Units) Forecast By Application
13.4.1. Food
13.4.1.1. Pet food
13.4.1.2. Baby food
13.4.1.3. Fresh Produce
13.4.1.4. Meat & Sea food
13.4.1.5. Ready-to-eat meals
13.4.1.6. Soups & Sauces
13.4.1.7. Others
13.4.2. Pharmaceutical & Others
13.5. Market Size (US$ Mn) and Volume (Mn Units) Forecast By Product Type
13.5.1. Stand-up Pouches
13.5.2. Spouted Pouches
13.5.3. Zipper Pouches
13.5.4. Pillow Pack
13.5.5. 3-side sealed
13.6. Market Size (US$ Mn) and Volume (Mn Units) Forecast By Closure Type
13.6.1. With Cap
13.6.1.1. Screw Cap
13.6.1.2. Flip Cap
13.6.1.3. Flip Top Cap
13.6.1.4. Pour Spouted Cap
13.6.1.5. Others
13.6.2. Without Cap
13.6.2.1. Sealed (Tear & Open)
13.6.2.2. Zipper/Zip Lock
13.6.2.3. Others
13.7. Market Size (US$ Mn) and Volume (Mn Units) Forecast By Capacity
13.7.1. 0 ml – 350 ml
13.7.2. 351 ml -500 ml
13.7.3. 501 ml – 100 ml
13.7.4. 1000 ml – 3000 ml
13.7.5. Above 3001 m
13.8. Market Attractiveness Analysis
13.8.1. By Country
13.8.2. By Barrier Material Type
13.8.3. By Application
13.8.4. By Product Type
13.8.5. By Closure Type
13.8.6. By Capacity
13.9. Prominent Trends
14. Europe Retort Pouches Market Analysis and Forecast
14.1. Introduction
14.1.1. Market share and Basis Points (BPS) Analysis By Country
14.1.2. Y-o-Y Growth Projections By Country
14.1.3. Key Regulations
14.2. Market Size (US$ Mn) and Volume (Mn Units) Forecast By Country
14.2.1. Germany
14.2.2. Spain
14.2.3. Italy
14.2.4. France
14.2.5. U.K.
14.2.6. Rest of Europe
14.3. Market Size (US$ Mn) and Volume (Mn Units) Forecast By Barrier Material Type
14.3.1. Aluminum Foil
14.3.2. Polypropylene
14.3.3. Food-Grade Cast Polypropylene
14.3.4. Polyamide
14.3.5. Polyethylene
14.3.5.1. HDPE
14.3.5.2. LDPE
14.3.5.3. LLDPE
14.3.6. Others
14.4. Market Size (US$ Mn) and Volume (Mn Units) Forecast By Application
14.4.1. Food
14.4.1.1. Pet food
14.4.1.2. Baby food
14.4.1.3. Fresh Produce
14.4.1.4. Meat & Sea food
14.4.1.5. Ready-to-eat meals
14.4.1.6. Soups & Sauces
14.4.1.7. Others
14.4.2. Pharmaceutical & Others
14.5. Market Size (US$ Mn) and Volume (Mn Units) Forecast By Product Type
14.5.1. Stand-up Pouches
14.5.2. Spouted Pouches
14.5.3. Zipper Pouches
14.5.4. Pillow Pack
14.5.5. 3-side sealed
14.6. Market Size (US$ Mn) and Volume (Mn Units) Forecast By Closure Type
14.6.1. With Cap
14.6.1.1. Screw Cap
14.6.1.2. Flip Cap
14.6.1.3. Flip Top Cap
14.6.1.4. Pour Spouted Cap
14.6.1.5. Others
14.6.2. Without Cap
14.6.2.1. Sealed (Tear & Open)
14.6.2.2. Zipper/Zip Lock
14.6.2.3. Others
14.7. Market Size (US$ Mn) and Volume (Mn Units) Forecast By Capacity
14.7.1. 0 ml – 350 ml
14.7.2. 351 ml -500 ml
14.7.3. 501 ml – 100 ml
14.7.4. 1000 ml – 3000 ml
14.7.5. Above 3001 ml
14.8. Market Attractiveness Analysis
14.8.1. By Country
14.8.2. By Barrier Material Type
14.8.3. By Application
14.8.4. By Product Type
14.8.5. By Closure Type
14.8.6. By Capacity
14.9. Prominent Trends
15. Asia Pacific Retort Pouches Market Analysis and Forecast
15.1. Introduction
15.1.1. Market share and Basis Points (BPS) Analysis By Country
15.1.2. Y-o-Y Growth Projections By Country
15.1.3. Key Regulations
15.2. Market Size (US$ Mn) and Volume (Mn Units) Forecast By Country
15.2.1. China
15.2.2. India
15.2.3. Japan
15.2.4. ASEAN
15.2.5. Australia and New Zealand
15.2.6. Rest of APAC
15.3. Market Size (US$ Mn) and Volume (Mn Units) Forecast By Barrier Material Type
15.3.1. Aluminum Foil
15.3.2. Polypropylene
15.3.3. Food-Grade Cast Polypropylene
15.3.4. Polyamide
15.3.5. Polyethylene
15.3.5.1. HDPE
15.3.5.2. LDPE
15.3.5.3. LLDPE
15.3.6. Others
15.4. Market Size (US$ Mn) and Volume (Mn Units) Forecast By Application
15.4.1. Food
15.4.1.1. Pet food
15.4.1.2. Baby food
15.4.1.3. Fresh Produce
15.4.1.4. Meat & Sea food
15.4.1.5. Ready-to-eat meals
15.4.1.6. Soups & Sauces
15.4.1.7. Others
15.4.2. Pharmaceutical & Others
15.5. Market Size (US$ Mn) and Volume (Mn Units) Forecast By Product Type
15.5.1. Stand-up Pouches
15.5.2. Spouted Pouches
15.5.3. Zipper Pouches
15.5.4. Pillow Pack
15.5.5. 3-side sealed
15.6. Market Size (US$ Mn) and Volume (Mn Units) Forecast By Closure Type
15.6.1. With Cap
15.6.1.1. Screw Cap
15.6.1.2. Flip Cap
15.6.1.3. Flip Top Cap
15.6.1.4. Pour Spouted Cap
15.6.1.5. Others
15.6.2. Without Cap
15.6.2.1. Sealed (Tear & Open)
15.6.2.2. Zipper/Zip Lock
15.6.2.3. Others
15.7. Market Size (US$ Mn) and Volume (Mn Units) Forecast By Capacity
15.7.1. 0 ml – 350 ml
15.7.2. 351 ml -500 ml
15.7.3. 501 ml – 100 ml
15.7.4. 1000 ml – 3000 ml
15.7.5. Above 3001 ml
15.8. Market Attractiveness Analysis
15.8.1. By Country
15.8.2. By Barrier Material Type
15.8.3. By Application
15.8.4. By Product Type
15.8.5. By Closure Type
15.8.6. By Capacity
15.9. Prominent Trends
16. Middle East & Africa Retort Pouches Market Analysis and Forecast
16.1. Introduction
16.1.1. Market share and Basis Points (BPS) Analysis By Country
16.1.2. Y-o-Y Growth Projections By Country
16.1.3. Key Regulations
16.2. Market Size (US$ Mn) and Volume (Mn Units) Forecast By Country
16.2.1. North Africa
16.2.2. South Africa
16.2.3. GCC countries
16.2.4. Rest of MEA
16.3. Market Size (US$ Mn) and Volume (Mn Units) Forecast By Barrier Material Type
16.3.1. Aluminum Foil
16.3.2. Polypropylene
16.3.3. Food-Grade Cast Polypropylene
16.3.4. Polyamide
16.3.5. Polyethylene
16.3.5.1. HDPE
16.3.5.2. LDPE
16.3.5.3. LLDPE
16.4. Market Size (US$ Mn) and Volume (Mn Units) Forecast By Application
16.4.1. Food
16.4.1.1. Pet food
16.4.1.2. Baby food
16.4.1.3. Fresh Produce
16.4.1.4. Meat & Sea food
16.4.1.5. Ready-to-eat meals
16.4.1.6. Soups & Sauces
16.4.1.7. Others
16.4.2. Pharmaceutical & Others
16.5. Market Size (US$ Mn) and Volume (Mn Units) Forecast By Product Type
16.5.1. Stand-up Pouches
16.5.2. Spouted Pouches
16.5.3. Zipper Pouches
16.5.4. Pillow Pack
16.5.5. 3-side sealed
16.6. Market Size (US$ Mn) and Volume (Mn Units) Forecast By Closure Type
16.6.1. With Cap
16.6.1.1. Screw Cap
16.6.1.2. Flip Cap
16.6.1.3. Flip Top Cap
16.6.1.4. Pour Spouted Cap
16.6.1.5. Others
16.6.2. Without Cap
16.6.2.1. Sealed (Tear & Open)
16.6.2.2. Zipper/Zip Lock
16.6.2.3. Others
16.7. Market Size (US$ Mn) and Volume (Mn Units) Forecast By Capacity
16.7.1. 0 ml – 350 ml
16.7.2. 351 ml -500 ml
16.7.3. 501 ml – 100 ml
16.7.4. 1000 ml – 3000 ml
16.7.5. Above 3001 ml
16.8. Market Attractiveness Analysis
16.8.1. By Country
16.8.2. By Barrier Material Type
16.8.3. By Application
16.8.4. By Product Type
16.8.5. By Closure Type
16.8.6. By Capacity
16.9. Prominent Trends
17. Competitive Landscape
17.1. Competitive Dashboard
17.2. Company Market Share Analysis
17.3. Company Profiles (Details – Overview, Financials, Strategy, Recent Developments, SWOT analysis)
17.3.1. Huhtamaki Group
17.3.1.1. Overview
17.3.1.2. Financials
17.3.1.3. Recent Developments
17.3.1.4. Strategy
17.3.1.5. SWOT Analysis
17.3.2. Amcor Ltd.
17.3.2.1. Overview
17.3.2.2. Financials
17.3.2.3. Recent Developments
17.3.2.4. Strategy
17.3.2.5. SWOT Analysis
17.3.3. Mondi Group
17.3.3.1. Overview
17.3.3.2. Financials
17.3.3.3. Recent Developments
17.3.3.4. Strategy
17.3.3.5. SWOT Analysis
17.3.4. Sonoco Products Company
17.3.4.1. Overview
/17.3.4.2. Financials
17.3.4.3. Recent Developments
17.3.4.4. Strategy
17.3.4.5. SWOT Analysis
17.3.5. Clifton Packaging Group Ltd.
17.3.5.1. Overview
17.3.5.2. Financials
17.3.5.3. Recent Developments
17.3.5.4. Strategy
17.3.5.5. SWOT Analysis
17.3.6. Bemis Company, Inc.
17.3.6.1. Overview
17.3.6.2. Financials
17.3.6.3. Recent Developments
17.3.6.4. Strategy
17.3.6.5. SWOT Analysis
17.3.7. Sealed Air Corporation
17.3.7.1. Overview
17.3.7.2. Financials
17.3.7.3. Recent Developments
17.3.7.4. Strategy
17.3.7.5. SWOT Analysis
17.3.8. Constantia Flexibles International GmbH
17.3.8.1. Overview
17.3.8.2. Financials
17.3.8.3. Recent Developments
17.3.8.4. Strategy
17.3.8.5. SWOT Analysis
17.3.9. ProAmpac
17.3.9.1. Overview
17.3.9.2. Financials
17.3.9.3. Recent Developments
17.3.9.4. Strategy
17.3.9.5. SWOT Analysis
17.3.10. Continuous Retorts limited (CRL)
17.3.10.1. Overview
17.3.10.2. Financials
17.3.10.3. Recent Developments
17.3.10.4. Strategy
17.3.10.5. SWOT Analysis
17.3.11. AlliedFlex Technologies, Inc.
17.3.11.1. Overview
17.3.11.2. Financials
17.3.11.3. Recent Developments
17.3.11.4. Strategy
17.3.11.5. SWOT Analysis
17.3.12. Foshan Nanhai LD Packaging Co., Ltd
17.3.12.1. Overview
17.3.12.2. Financials
17.3.12.3. Recent Developments
17.3.12.4. Strategy
17.3.12.5. SWOT Analysis
17.3.13. Paharpur 3P
17.3.13.1. Overview
17.3.13.2. Financials
17.3.13.3. Recent Developments
17.3.13.4. Strategy
17.3.13.5. SWOT Analysis
17.3.14. Flexi-Pack Ltd.
17.3.14.1. Overview
17.3.14.2. Financials
17.3.14.3. Recent Developments
17.3.14.4. Strategy
17.3.14.5. SWOT Analysis
17.3.15. Flair Flexible Packaging
17.3.15.1. Overview
17.3.15.2. Financials
17.3.15.3. Recent Developments
17.3.15.4. Strategy
17.3.15.5. SWOT Analysis
17.3.16. Tong Yuan Packaging Co. Ltd.
17.3.16.1. Overview
17.3.16.2. Financials
17.3.16.3. Recent Developments
17.3.16.4. Strategy
17.3.16.5. SWOT Analysis
17.3.17. Purity Flexipack Ltd.
17.3.17.1. Overview
17.3.17.2. Financials
17.3.17.3. Recent Developments
17.3.17.4. Strategy
17.3.17.5. SWOT Analysis
17.3.18. MST Packaging Co. Ltd.
17.3.18.1. Overview
17.3.18.2. Financials
17.3.18.3. Recent Developments
17.3.18.4. Strategy
17.3.18.5. SWOT Analysis
17.3.19. Clondalkin Group Holdings B.V.
17.3.19.1. Overview
17.3.19.2. Financials
17.3.19.3. Recent Developments
17.3.19.4. Strategy
17.3.19.5. SWOT Analysis
17.3.20. Avonfle
17.3.20.1. Overview
17.3.20.2. Financials
17.3.20.3. Recent Developments
17.3.20.4. Strategy
17.3.20.5. SWOT Analysis
18. Assumptions and Acronyms Used
19. Research Methodology
List of Tables
Table 01: Global Retort Pouches Market Value (US$ Mn) and Volume (Mn Units) 2016 (A) - 2025 (F), By Barrier Material
Table 02: Global Retort Pouches Market Value (US$ Mn) and Volume (Mn Units) 2016 (A) - 2025 (F), By Application
Table 03: Global Retort Pouches Market Value (US$ Mn) and Volume (Mn Units) 2016 (A) - 2025 (F), By Product type
Table 04: Global Retort Pouches Market Value (US$ Mn) and Volume (Mn Units) 2016 (A) - 2025 (F), By Closure Type
Table 05: Global Retort Pouches Market Value (US$ Mn) and Volume (Mn Units) 2016 (A) - 2025 (F), By Capacity
Table 06: Global Retort Pouches Market Value (US$ Mn) and Volume (Mn Units) 2016 (A)-2025 (E), By Region
Table 07: North America Retort Pouches Market, Value (US$ Mn) and Volume (Mn Units), By Country, 2016 (A)- 2025 (E)
Table 08: North America Retort Pouches Market Value (US$ Mn) and Volume (Mn Units) 2016 (A)- 2025 (E), By Barrier Material
Table 09: North America Retort Pouches Market Value (US$ Mn) and Volume (Mn Units) 2016 (A)- 2025 (E), By Application
Table 10: North America Retort Pouches Market Value (US$ Mn) and Volume (Mn Units) 2016 (A)- 2025 (E), By Product Type
Table 11: North America Retort Pouches Market Value (US$ Mn) and Volume (Mn Units) 2016 (A)- 2025 (E), By Closure Type
Table 12: North America Retort Pouches Market Value (US$ Mn) and Volume (Mn Units) 2016 (A)- 2025 (E), By Capacity
Table 13: Latin America Retort Pouches Market, Value (US$ Mn) and Volume (Mn Units), By Country, 2016 (A)- 2025 (F)
Table 14: Latin America Retort Pouches Market Value (US$ Mn) and Volume (Mn Units) 2016 (A)- 2025 (F), By Barrier Material
Table 15: Latin America Retort Pouches Market Value (US$ Mn) and Volume (Mn Units) 2016 (A)- 2025 (F), By Application
Table 16: Latin America Retort Pouches Market Value (US$ Mn) and Volume (Mn Units) 2016 (A)- 2025 (F), By Product Type
Table 17: Latin America Retort Pouches Market Value (US$ Mn) and Volume (Mn Units) 2016 (A)- 2025 (F), By Closure Type
Table 18: Latin America Retort Pouches Market Value (US$ Mn) and Volume (Mn Units) 2016 (A)- 2025 (F), By Capacity
Table 19: Europe Retort Pouches Market, Value (US$ Mn) and Volume (Mn Units), By Country, 2016 (A)- 2025 (F)
Table 20: Europe Retort Pouches Market Value (US$ Mn) and Volume (Mn Units) 2016 (A)- 2025 (F), By Barrier Material
Table 21: Europe Retort Pouches Market Value (US$ Mn) and Volume (Mn Units) 2016 (A)- 2025 (F), By Application
Table 22: Europe Retort Pouches Market Value (US$ Mn) and Volume (Mn Units) 2016 (A)- 2025 (F), By Product Type
Table 23: Europe Retort Pouches Market Value (US$ Mn) and Volume (Mn Units) 2016 (A)- 2025 (F), By Closure Type
Table 24: Europe Retort Pouches Market Value (US$ Mn) and Volume (Mn Units) 2016 (A)- 2025 (F), By Capacity
Table 25: APAC Retort Pouches Market, Value (US$ Mn) and Volume (Mn Units), By Country, 2016 (A)- 2025 (F)
Table 26: APAC Retort Pouches Market Value (US$ Mn) and Volume (Mn Units) 2016 (A)- 2025 (F), By Barrier Material
Table 27: APAC Retort Pouches Market Value (US$ Mn) and Volume (Mn Units) 2016 (A)- 2025 (F), By Application
Table 28: APAC Retort Pouches Market Value (US$ Mn) and Volume (Mn Units) 2016 (A)- 2025 (F), By Product Type
Table 29: APAC Retort Pouches Market Value (US$ Mn) and Volume (Mn Units) 2016 (A)- 2025 (F), By Closure Type
Table 30: APAC Retort Pouches Market Value (US$ Mn) and Volume (Mn Units) 2016 (A)- 2025 (F), By Capacity
Table 31: MEA Retort Pouches Market, Value (US$ Mn) and Volume (Mn Units), By Country, 2016 (A)- 2025 (F)
Table 32: MEA Retort Pouches Market Value (US$ Mn) and Volume (Mn Units) 2016 (A)- 2025 (F), By Barrier Material
Table 33: MEA Retort Pouches Market Value (US$ Mn) and Volume (Mn Units) 2016 (A)- 2025 (F), By Application
Table 34: MEA Retort Pouches Market Value (US$ Mn) and Volume (Mn Units) 2016 (A)- 2025 (F), By Product Type
Table 35: MEA Retort Pouches Market Value (US$ Mn) and Volume (Mn Units) 2016 (A)- 2025 (F), By Closure Type
Table 36: MEA Retort Pouches Market Value (US$ Mn) and Volume (Mn Units) 2016 (A)- 2025 (F), By Capacity
List of Figures
Figure 01: Global Retort Pouches Market Value Share and BPS Analysis, By Barrier Material Type, 2017 & 2025
Figure 02: Global Retort Pouches Market Attractiveness analysis, By Closure Type, (2017 (E) & 2025 (F))
Figure 03: Global Retort Pouches Market Y-o-Y growth, By Barrier Material 2017 & 2025
Figure 04: Global Retort Pouches Market Value (US$ Mn), and volume (Mn Units) analysis, by Aluminum foil segment, 2016 (A) - 2025 (F)
Figure 05: Global Retort Pouches Market Absolute $ Opportunity, by Aluminum foil segment, 2017-2025
Figure 06: Global Retort Pouches Market Value (US$ Mn), and volume (Mn Units) analysis, by Polypropylene segment, 2016 (A) - 2025 (F)
Figure 07: Global Retort Pouches Market Absolute $ Opportunity, by Polypropylene segment, 2017-2025
Figure 08: Global Retort Pouches Market Value (US$ Mn), and volume (Mn Units) analysis, by Food Grade Cast PP segment, 2016 (A) - 2025 (F)
Figure 09: Global Retort Pouches Market Absolute $ Opportunity, by Food Grade Cast PP segment, 2017-2025
Figure 10: Global Retort Pouches Market Value (US$ Mn), and volume (Mn Units) analysis, by Polyamide segment, 2016 (A) - 2025 (F)
Figure 11: Global Retort Pouches Market Absolute $ Opportunity, by Polyamide segment, 2017-2025
Figure 12: Global Retort Pouches Market Value (US$ Mn), and volume (Mn Units) analysis, by Polyethylene segment, 2016 (A) - 2025 (F)
Figure 13: Global Retort Pouches Market Absolute $ Opportunity, by Polyethylene segment, 2017-2025
Figure 14: Global Retort Pouches Market Value (US$ Mn) forecast, By polyethylene sub-segment, 2016 - 2025
Figure 15: Global Retort Pouches Market Volume (Mn Units) forecast, By polyethylene sub-segment, 2016 - 2025
Figure 16: Global Retort Pouches Market Value Share and BPS Analysis, By Application, 2017 & 2025
Figure 17: Global Retort Pouches Market Attractiveness analysis, By Application, (2017 (E) & 2025 (F))
Figure 18: Global Retort Pouches Market Y-o-Y growth, By Application 2017 & 2025
Figure 19: Global Retort Pouches Market Value (US$ Mn), and volume (Mn Units) analysis, by Food segment, 2016 (A) - 2025 (F)
Figure 20: Global Retort Pouches Market Absolute $ Opportunity, by Food segment, 2017-2025
Figure 21: Global Retort Pouches Market Value (US$ Mn) forecast, By Food sub-segment, 2016 - 2025
Figure 22: Global Retort Pouches Market Volume (Mn Units) forecast, By Food sub-segment, 2016 - 2025
Figure 23: Global Retort Pouches Market Value (US$ Mn), and volume (Mn Units) analysis, by Pharmaceuticals & others segment, 2016 (A) - 2025 (F)
Figure 24: Global Retort Pouches Market Absolute $ Opportunity, by Pharmaceuticals & others segment, 2017-2025
Figure 25: Global Retort Pouches Market Value Share and BPS Analysis, By Product Type, 2017 & 2025
Figure 26: Global Retort Pouches Market Attractiveness analysis, By Product Type, (2017)
Figure 27: Global Retort Pouches Market Y-o-Y growth, By Product Type 2017 & 2025
Figure 28: Global Retort Pouches Market Value (US$ Mn), and volume (Mn Units) analysis, by Stand Up pouches segment, 2016 (A) - 2025 (F)
Figure 29: Global Retort Pouches Market Absolute $ Opportunity, by Stand Up pouches segment, 2017-2025
Figure 30: Global Retort Pouches Market Value (US$ Mn), and volume (Mn Units) analysis, by Spouted pouches segment, 2016 (A) - 2025 (F)
Figure 31: Global Retort Pouches Market Absolute $ Opportunity, by Spouted pouches segment, 2017-2025
Figure 32: Global Retort Pouches Market Value (US$ Mn), and volume (Mn Units) analysis, by Zipper pouches segment, 2016 (A) - 2025 (F)
Figure 33: Global Retort Pouches Market Absolute $ Opportunity, by Zipper pouches segment, 2017-2025
Figure 34: Global Retort Pouches Market Value (US$ Mn), and volume (Mn Units) analysis, by Pillow Pack segment, 2016 (A) - 2025 (F)
Figure 35: Global Retort Pouches Market Absolute $ Opportunity, by Pillow Pack segment, 2017-2025
Figure 36: Global Retort Pouches Market Value (US$ Mn), and volume (Mn Units) analysis, by 3- side sealed segment, 2016 (A) - 2025 (F)
Figure 37: Global Retort Pouches Market Absolute $ Opportunity, by 3- side sealed segment, 2017-2025
Figure 38: Global Retort Pouches Market Value Share and BPS Analysis, By Closure Type, 2017 & 2025
Figure 39: Global Retort Pouches Market Attractiveness analysis, By Closure Type, (2017(E) & 2025 (F))
Figure 40: Global Retort Pouches Market Y-o-Y growth, By Closure Type, 2017 & 2025
Figure 41: Global Retort Pouches Market Value (US$ Mn), and volume (Mn Units) analysis, by With Cap segment, 2016 (A) - 2025 (F)
Figure 42: Global Retort Pouches Market Absolute $ Opportunity, by With Cap segment, 2017-2025
Figure 43: Global Retort Pouches Market Value (US$ Mn) forecast, By With Cap Sub-segment, 2016 - 2025
Figure 44: Global Retort Pouches Market Volume (Mn Units) forecast, By With Cap Sub-segment, 2016 - 2025
Figure 45: Global Retort Pouches Market Value (US$ Mn), and volume (Mn Units) analysis, by Without Cap segment, 2016 (A) - 2025 (F)
Figure 46: Global Retort Pouches Market Absolute $ Opportunity, by Without Cap segment, 2017-2025
Figure 47: Global Retort Pouches Market Value (US$ Mn) forecast, By Without Cap Sub-segment, 2016 - 2025
Figure 48: Global Retort Pouches Market Volume (Mn Units) forecast, By Without Cap Sub-segment, 2016 - 2025
Figure 49: Global Retort Pouches Market Value Share and BPS Analysis, By Capacity, 2017 & 2025
Figure 50: Global Retort Pouches Market Attractiveness analysis, By Capacity, (2017 (E) & 2025 (F))
Figure 51: Global Retort Pouches Market Y-o-Y growth, By Capacity 2017 & 2025
Figure 52: Global Retort Pouches Market Value (US$ Mn), and volume (Mn Units) analysis, by 0 ml- 350 ml segment, 2016 (A) - 2025 (F)
Figure 53: Global Retort Pouches Market Absolute $ Opportunity, by 0 ml- 350 ml segment, 2017-2025
Figure 54: Global Retort Pouches Market Value (US$ Mn), and volume (Mn Units) analysis, by 351 ml- 500 ml segment, 2016 (A) - 2025 (F)
Figure 55: Global Retort Pouches Market Absolute $ Opportunity, by 351 ml- 500 ml segment, 2017-2025
Figure 56: Global Retort Pouches Market Value (US$ Mn), and volume (Mn Units) analysis, by 501 ml- 1000 ml segment, 2016 (A) - 2025 (F)
Figure 57: Global Retort Pouches Market Absolute $ Opportunity, by 501 ml- 1000 ml segment, 2017-2025
Figure 58: Global Retort Pouches Market Value (US$ Mn), and volume (Mn Units) analysis, by 1000 ml- 3000 ml segment, 2016 (A) - 2025 (F)
Figure 59: Global Retort Pouches Market Absolute $ Opportunity, by 1000 ml- 3000 ml segment, 2017-2025
Figure 60: Global Retort Pouches Market Value (US$ Mn), and volume (Mn Units) analysis, by Above 3001 ml segment, 2016 (A) - 2025 (F)
Figure 61: Global Retort Pouches Market Absolute $ Opportunity, by Above 3001 ml segment, 2017-2025
Figure 62: Global Retort Pouches Market Value Share and BPS Analysis, By Region, 2017 & 2025
Figure 63: Global Retort Pouches Market Attractiveness analysis, By Region, (2017 (E) & 2025 (F))
Figure 64: Global Retort Pouches Market Y-o-Y growth, By Region, 2017 & 2025
Figure 65: North America Retort Pouches Market Value Share by Barrier Material (2016)
Figure 66: North America Retort Pouches Market Value Share by Application (2016)
Figure 67: North America Retort Pouches Market Value Share by Product Type (2016)
Figure 68: North America Retort Pouches Market Value Share by Closure (2016)
Figure 69: North America Retort Pouches Market Value Share by Capacity (2016)
Figure 70: North America Retort Pouches Market Value Share by Country (2016)
Figure 71: North America Retort Pouches Market, Value (US$ Mn) and volume (Mn Units) analysis, 2016 (A)- 2025 (E)
Figure 72: North America Retort Pouches Market, Absolute $ Opportunity, 2017 (E)-2025
Figure 73: North America Retort Pouches Market, Value Share and BPS Analysis, By Country, 2017 (E) & 2025
Figure 74: North America Retort Pouches Market Attractiveness analysis, By Country (2017 (E) & 2025 (F))
Figure 75: North America Retort Pouches Market, Value Y-o-Y growth, By Country, 2017 (E) & 2025
Figure 76: North America Retort Pouches market BPS analysis (2017 (E) & 2025), By Barrier Material
Figure 77: North America Retort Pouches market attractiveness analysis (2017 (E) & 2025 (F)), By Barrier Material
Figure 78: North America retort pouches market absolute $ opportunity (2017 (E)-2025 (F)), by Aluminum foil segment
Figure 79: North America retort pouches absolute $ opportunity (2017 (E)-2025 (F)), by Polypropylene segment
Figure 80: North America retort pouches market absolute $ opportunity (2017 (E)-2025 (F))), by Food Grade Cast PP segment
Figure 81: North America retort pouches absolute $ opportunity (2017 (E)-2025 (F)), by Polyamide segment
Figure 82: North America retort pouches market absolute $ opportunity (2017 (E)-2025 (F)), by Polyethylene segment
Figure 83: North America Retort Pouches Market Value (US$ Mn) forecast, By polyethylene sub-segment, 2016 - 2025
Figure 84: North America Retort Pouches Market Volume (Mn Units) forecast, By polyethylene sub-segment, 2016 - 2025
Figure 85: North America Retort Pouches market BPS analysis (2017 (E) & 2025 (F)), by Application
Figure 86: North America Retort Pouches market attractiveness analysis (2017 (E) & 2025 (F)), by Application
Figure 87: North America retort pouches market absolute $ opportunity (2017 (E)-2025), by Food segment
Figure 88: North America Retort Pouches Market Value (US$ Mn) forecast, By Food sub-segment, 2016 - 2025
Figure 89: North America Retort Pouches Market Volume (Mn Units) forecast, By Food sub-segment, 2016 - 2025
Figure 90: North America retort pouches market absolute $ opportunity (2017 (E)-2025 (F)), by Food segment
Figure 91: North America Retort Pouches market BPS analysis (2017 (E) & 2025), by Product Type
Figure 92: North America Retort Pouches market attractiveness analysis (2017 (E) &2025 (F)), by Product Type
Figure 93: North America retort pouches market absolute $ opportunity (2017 (E)-2025 (F)), by Stand Up pouches segment
Figure 94: North America retort pouches market absolute $ opportunity (2017 (E)-2025 (F)), by Spouted pouches segment
Figure 95: North America retort pouches market absolute $ opportunity (2017 (E)-2025 (F)), by Zipper pouches segment
Figure 96: North America retort pouches market absolute $ opportunity (2017 (E)-2025 (F)), by Pillow Pack segment
Figure 97: North America retort pouches market absolute $ opportunity (2017 (E)-2025 (F)), by 3- side sealed segment
Figure 98: North America Retort Pouches market BPS analysis (2017 (E) & 2025 (F)), by Closure Type
Figure 99: North America Retort Pouches market attractiveness analysis (2017 (E) & 2025 (F)), by Closure Type
Figure 100: North America retort pouches market absolute $ opportunity (2017 (E)-2025 (F)), by With Cap segment
Figure 101: North America Retort Pouches Market Value (US$ Mn) forecast, By With Cap Sub-segment, 2016 - 2025
Figure 102: North America Retort Pouches Market Volume (Mn Units) forecast, By With Cap Sub-segment, 2016 - 2025
Figure 103: North America retort pouches market absolute $ opportunity (2017 (E)-2025 (F)), by Without Cap segment
Figure 104: North America Retort Pouches Market Value (US$ Mn) forecast, By Without Cap Sub-segment, 2016 - 2025
Figure 105: North America Retort Pouches Market Volume (Mn Units) forecast, By Without Cap Sub-segment, 2016 - 2025
Figure 106: North America Retort Pouches market BPS analysis (2017 (E) & 2025), by Capacity
Figure 107: North America Retort Pouches market attractiveness analysis (2017 (E) & 2025 (F)), by Capacity
Figure 108: North America retort pouches market absolute $ opportunity (2017 (E)-2025 (F)), by 0 ml- 350 ml segment
Figure 109: North America retort pouches absolute $ opportunity (2017 (E)-2025 (F)), by 351 ml- 500 ml segment
Figure 110: North America retort pouches market absolute $ opportunity (2017 (E)-2025 (F)), by 501 ml- 1000 ml segment
Figure 111: North America retort pouches absolute $ opportunity (2017 (E)-2025 (F)), by 1000 ml- 3000 ml segment
Figure 112: North America retort pouches market absolute $ opportunity (2017 (E)-2025 (F)), by Above 3001 ml segment
Figure 113: Latin America Retort Pouches Market Value Share by Barrier Material (2016)
Figure 114: Latin America Retort Pouches Market Value Share by Application (2016)
Figure 115: Latin America Retort Pouches Market Value Share by Product Type (2016)
Figure 116: Latin America Retort Pouches Market Value Share by Closure (2016)
Figure 117: Latin America Retort Pouches Market Value Share by Capacity (2016)
Figure 118: Latin America Retort Pouches Market Value Share by Country (2016)
Figure 119: Latin America Retort Pouches Market, Value (US$ Mn) and volume (Mn Units) analysis, 2016 (A)- 2025 (F)
Figure 120: Latin America Retort Pouches Market, Absolute $ Opportunity, 2017 (E)-2025 (F)
Figure 121: Latin America Retort Pouches Market, Value Share and BPS Analysis, By Country, 2017 (E) & 2025 (F))
Figure 122: Latin America Retort Pouches Market Attractiveness analysis, By Country (2017 (E) & 2025 (F))
Figure 123: Latin America Retort Pouches Market, Value Y-o-Y growth, By Country, 2017 (E) & 2025 (F)
Figure 124: Latin America Retort Pouches market BPS analysis (2017 (E) & 2025 (F)), By Barrier Material
Figure 125: Latin America Retort Pouches market attractiveness analysis (2017 (E) & 2025 (F)), By Barrier Material
Figure 126: Latin America retort pouches market absolute $ opportunity (2017 (E)-2025 (F))), by Aluminum foil segment
Figure 127: Latin America retort pouches absolute $ opportunity (2017 (E)-2025 (F)), by Polypropylene segment
Figure 128: Latin America retort pouches market absolute $ opportunity (2017 (E)-2025 (F)), by Food Grade Cast PP segment
Figure 129: Latin America retort pouches absolute $ opportunity (2017 (E)-2025 (F)), by Polyamide segment
Figure 130: Latin America retort pouches market absolute $ opportunity (2017 (E)-2025 (F)), by Polyethylene segment
Figure 131: Latin America Retort Pouches Market Value (US$ Mn) forecast, By polyethylene sub-segment, 2016 - 2025
Figure 132: Latin America Retort Pouches Market Volume (Mn Units) forecast, By polyethylene sub-segment, 2016 - 2025
Figure 133: Latin America Retort Pouches market BPS analysis (2017 (E) & 2025), by Application
Figure 134: Latin America Retort Pouches market attractiveness analysis (2017 (E) & 2025 (F)), by Application
Figure 135: Latin America retort pouches market absolute $ opportunity (2017 (E)-2025 (F)), by Food segment
Figure 136: Latin America Retort Pouches Market Value (US$ Mn) forecast, By Food sub-segment, 2016 - 2025
Figure 137: Latin America Retort Pouches Market Volume (Mn Units) forecast, By Food sub-segment, 2016 - 2025
Figure 138: Latin America retort pouches market absolute $ opportunity (2017 (E)-2025 (F)), by Food segment
Figure 139: Latin America Retort Pouches market BPS analysis (2017 (E) & 2025 (F)), by Product Type
Figure 140: Latin America Retort Pouches market attractiveness analysis (2017 (E) & 2025 (F)), by Product Type
Figure 141: Latin America retort pouches market absolute $ opportunity (2017 (E)-2025 (F)), by Stand Up pouches segment
Figure 142: Latin America retort pouches market absolute $ opportunity (2017 (E)-2025 (F)), by Spouted pouches segment
Figure 143: Latin America retort pouches market absolute $ opportunity (2017 (E)-2025 (F)), by Zipper pouches segment
Figure 144: Latin America retort pouches market absolute $ opportunity (2017 (E)-2025 (F)), by Pillow Pack segment
Figure 145: Latin America retort pouches market absolute $ opportunity (2017 (E)-2025 (F)), by 3- side sealed segment
Figure 146: Latin America Retort Pouches market BPS analysis (2017 (E) & 2025), by Closure Type
Figure 147: Latin America Retort Pouches market attractiveness analysis (2017 (E) & 2025(F)), by Closure Type
Figure 148: Latin America retort pouches market absolute $ opportunity (2017 (E)-2025 (F)), by With Cap segment
Figure 149: Latin America Retort Pouches Market Value (US$ Mn) forecast, By With Cap Sub-segment, 2016 - 2025
Figure 150: Latin America Retort Pouches Market Volume (Mn Units) forecast, By With Cap Sub-segment, 2016 - 2025
Figure 151: Latin America retort pouches market absolute $ opportunity (2017 (E)-2025 (F)), by Without Cap segment
Figure 152: Latin America Retort Pouches Market Value (US$ Mn) forecast, By Without Cap Sub-segment, 2016 - 2025
Figure 153: Latin America Retort Pouches Market Volume (Mn Units) forecast, By Without Cap Sub-segment, 2016 - 2025
Figure 154: Latin America Retort Pouches market BPS analysis (2017 (E) & 2025 (F)), by Capacity
Figure 155: Latin America Retort Pouches market attractiveness analysis (2017 (E) & 2025 (F)), by Capacity
Figure 156: Latin America retort pouches market absolute $ opportunity (2017 (E)-2025 (F)), by 0 ml- 350 ml segment
Figure 157: Latin America retort pouches absolute $ opportunity (2017 (E)-2025 (F)), by 351 ml- 500 ml segment
Figure 158: Latin America retort pouches market absolute $ opportunity (2017 (E)-2025 (F)), by 501 ml- 1000 ml segment
Figure 159: Latin America retort pouches absolute $ opportunity (2017 (E)-2025 (F)), by 1000 ml- 3000 ml segment
Figure 160: Latin America retort pouches market absolute $ opportunity (2017 (E)-2025 (F)), by Above 3001 ml segment
Figure 161: Europe Retort Pouches Market Value Share by Barrier Material (2016)
Figure 162: Europe Retort Pouches Market Value Share by Application (2016)
Figure 163: Europe Retort Pouches Market Value Share by Product Type (2016)
Figure 164: Europe Retort Pouches Market Value Share by Closure (2016)
Figure 165: Europe Retort Pouches Market Value Share by Capacity (2016)
Figure 166: Europe Retort Pouches Market Value Share by Country (2016)
Figure 167: Europe Retort Pouches Market, Value (US$ Mn) and volume (Mn Units) analysis, 2016 (A)- 2025 (F)
Figure 168: Europe Retort Pouches Market, Absolute $ Opportunity, 2017 (E)-2025 (F)
Figure 169: Europe Retort Pouches Market, Value Share and BPS Analysis, By Country, 2017 (E) & 2025 (F))
Figure 170: Europe Retort Pouches Market Attractiveness analysis, By Country (2017 (E) & 2025 (F))
Figure 171: Europe Retort Pouches Market, Value Y-o-Y growth, By Country, 2017 (E) & 2025 (F)
Figure 172: Europe Retort Pouches market BPS analysis (2017 (E) & 2025 (F), By Barrier Material
Figure 173: Europe Retort Pouches market attractiveness analysis (2017 (E) & 2025 (F)), By Barrier Material
Figure 174: Europe retort pouches market absolute $ opportunity (2017 (E)-2025 (F)), by Aluminum foil segment
Figure 175: Europe retort pouches absolute $ opportunity (2017 (E)-2025 (F)), by Polypropylene segment
Figure 176: Europe retort pouches market absolute $ opportunity (2017 (E)-2025 (F)), by Food Grade Cast PP segment
Figure 177: Europe retort pouches absolute $ opportunity (2017 (E)-2025 (F)), by Polyamide segment
Figure 178: Europe retort pouches market absolute $ opportunity (2017 (E)-2025 (F)), by Polyethylene segment
Figure 179: Europe Retort Pouches Market Value (US$ Mn) forecast, By polyethylene sub-segment, 2016 (A) – 2025 (E)
Figure 180: Europe Retort Pouches Market Volume (Mn Units) forecast, By polyethylene sub-segment, 2016 (A) – 2025 (E)
Figure 181: Europe Retort Pouches market BPS analysis (2017 (E) & 2025 (F)), by Application
Figure 182: Europe Retort Pouches market attractiveness analysis (2017 (E) & 2025 (F)), by Application
Figure 183: Europe retort pouches market absolute $ opportunity (2017 (E)-2025 (F)), by Food segment
Figure 184: Europe Retort Pouches Market Value (US$ Mn) forecast, By Food sub-segment, 2016 (A) – 2025 (E)
Figure 185: Europe Retort Pouches Market Volume (Mn Units) forecast, By Food sub-segment, 2016 (A) – 2025 (E)
Figure 186: Europe retort pouches market absolute $ opportunity (2017 (E)-2025 (F)), by Food segment
Figure 187: Europe Retort Pouches market BPS analysis (2017 (E) & 2025 (F), by Product Type
Figure 188: Europe Retort Pouches market attractiveness analysis (2017 (E) & 2025 (F)), by Product Type
Figure 189: Europe retort pouches market absolute $ opportunity (2017 (E)-2025(F)), by Stand Up pouches segment
Figure 190: Europe retort pouches market absolute $ opportunity (2017 (E)-2025 (F)), by Spouted pouches segment
Figure 191: Europe retort pouches market absolute $ opportunity (2017 (E)-2025 (F)), by Zipper pouches segment
Figure 192: Europe retort pouches market absolute $ opportunity (2017 (E)-2025 (F)), by Pillow Pack segment
Figure 193: Europe retort pouches market absolute $ opportunity (2017 (E)-2025 (F)), by 3- side sealed segment
Figure 194: Europe Retort Pouches market BPS analysis (2017 (E) & 2025 (F)), by Closure Type
Figure 195: Europe Retort Pouches market attractiveness analysis (2017 (E) & 2025(F)), by Closure Type
Figure 196: Europe retort pouches market absolute $ opportunity (2017 (E)-2025 (F)), by With Cap segment
Figure 197: Europe Retort Pouches Market Value (US$ Mn) forecast, By With Cap Sub-segment, 2016 - 2025
Figure 198: Europe Retort Pouches Market Volume (Mn Units) forecast, By With Cap Sub-segment, 2016 - 2025
Figure 199: Europe retort pouches market absolute $ opportunity (2017 (E)-2025 (F)), by Without Cap segment
Figure 200: Europe Retort Pouches Market Value (US$ Mn) forecast, By Without Cap Sub-segment, 2016 - 2025
Figure 201: Europe Retort Pouches Market Volume (Mn Units) forecast, By Without Cap Sub-segment, 2016 - 2025
Figure 202: Europe Retort Pouches market BPS analysis (2017 (E) & 2025 (F)), by Capacity
Figure 203: Europe Retort Pouches market attractiveness analysis (2017 (E) & 2025 (F)), by Capacity
Figure 204: Europe retort pouches market absolute $ opportunity (2017 (E)-2025 (F)), by 0 ml- 350 ml segment
Figure 205: Europe retort pouches absolute $ opportunity (2017 (E)-2025 (F)), by 351 ml- 500 ml segment
Figure 206: Europe retort pouches market absolute $ opportunity (2017 (E)-2025 (F)), by 501 ml- 1000 ml segment
Figure 207: Europe retort pouches absolute $ opportunity (2017 (E)-2025 (F)), by 1000 ml- 3000 ml segment
Figure 208: Europe retort pouches market absolute $ opportunity (2017 (E)-2025 (F)), by Above 3001 ml segment
Figure 209: APAC Retort Pouches Market Value Share by Barrier Material (2016)
Figure 210: APAC Retort Pouches Market Value Share by Application (2016)
Figure 211: APAC Retort Pouches Market Value Share by Product Type (2016)
Figure 212: APAC Retort Pouches Market Value Share by Closure (2016)
Figure 213: APAC Retort Pouches Market Value Share by Capacity (2016)
Figure 214: APAC Retort Pouches Market Value Share by Country (2016)
Figure 215: APAC Retort Pouches Market, Value (US$ Mn) and volume (Mn Units) analysis, 2016 (A)- 2025 (F)
Figure 216: APAC Retort Pouches Market, Absolute $ Opportunity, 2017 (E)-2025 (F)
Figure 217: APAC Retort Pouches Market, Value Share and BPS Analysis, By Country, 2017 (E) & 2025 (F))
Figure 218: APAC Retort Pouches Market Attractiveness analysis, By Country (2017 (E) & 2025 (F))
Figure 219: APAC Retort Pouches Market, Value Y-o-Y growth, By Country, 2017 (E) & 2025 (F)
Figure 220: APAC Retort Pouches market BPS analysis (2017 (E) & 2025 (F), By Barrier Material
Figure 221: APAC Retort Pouches market attractiveness analysis (2017 (E) & 2025 (F)), By Barrier Material
Figure 222: APAC retort pouches market absolute $ opportunity (2017 (E)-2025 (F)), by Aluminum foil segment
Figure 223: APAC retort pouches absolute $ opportunity (2017 (E)-2025), by Polypropylene segment
Figure 224: APAC retort pouches market absolute $ opportunity (2017 (E)-2025 (F)), by Food Grade Cast PP segment
Figure 225: APAC retort pouches absolute $ opportunity (2017 (E)-2025 (F)), by Polyamide segment
Figure 226: APAC retort pouches market absolute $ opportunity (2017 (E)-2025 (F)), by Polyethylene segment
Figure 227: APAC Retort Pouches Market Value (US$ Mn) forecast, By polyethylene sub-segment, 2016 (A) – 2025 (E)
Figure 228: APAC Retort Pouches Market Volume (Mn Units) forecast, By polyethylene sub-segment, 2016 (A) – 2025 (E)
Figure 229: APAC Retort Pouches market BPS analysis (2017 (E) & 2025 (F)), by Application
Figure 230: APAC Retort Pouches market attractiveness analysis (2017 (E) & 2025 (F)), by Application
Figure 231: APAC retort pouches market absolute $ opportunity (2017 (E)-2025 (F)), by Food segment
Figure 232: APAC Retort Pouches Market Value (US$ Mn) forecast, By Food sub-segment, 2016 (A) – 2025 (E)
Figure 233: APAC Retort Pouches Market Volume (Mn Units) forecast, By Food sub-segment, 2016 (A) – 2025 (E)
Figure 234: APAC retort pouches market absolute $ opportunity (2017 (E)-2025 (F)), by Food segment
Figure 235: APAC Retort Pouches market BPS analysis (2017 (E) & 2025 (F), by Product Type
Figure 236: APAC Retort Pouches market attractiveness analysis (2017 (E) & 2025 (F)), by Product Type
Figure 237: APAC retort pouches market absolute $ opportunity (2017 (E)-2025(F)), by Stand Up pouches segment
Figure 238: APAC retort pouches market absolute $ opportunity (2017 (E)-2025 (F)), by Spouted pouches segment
Figure 239 : APAC retort pouches market absolute $ opportunity (2017 (E)-2025 (F)), by Zipper pouches segment
Figure 240: APAC retort pouches market absolute $ opportunity (2017 (E)-2025 (F)), by Pillow Pack segment
Figure 241: APAC retort pouches market absolute $ opportunity (2017 (E)-2025 (F)), by 3- side sealed segment
Figure 242: APAC Retort Pouches market BPS analysis (2017 (E) & 2025 (F)), by Closure Type
Figure 243: APAC Retort Pouches market attractiveness analysis (2017 (E) & 2025(F)), by Closure Type
Figure 244: APAC retort pouches market absolute $ opportunity (2017 (E)-2025 (F)), by With Cap segment
Figure 245: APAC Retort Pouches Market Value (US$ Mn) forecast, By With Cap Sub-segment, 2016 - 2025
Figure 246: APAC Retort Pouches Market Volume (Mn Units) forecast, By With Cap Sub-segment, 2016 - 2025
Figure 247: APAC retort pouches market absolute $ opportunity (2017 (E)-2025 (F)), by Without Cap segment
Figure 248: APAC Retort Pouches Market Value (US$ Mn) forecast, By Without Cap Sub-segment, 2016 - 2025
Figure 249: APAC Retort Pouches Market Volume (Mn Units) forecast, By Without Cap Sub-segment, 2016 - 2025
Figure 250: APAC Retort Pouches market BPS analysis (2017 (E) & 2025 (F)), by Capacity
Figure 251: APAC Retort Pouches market attractiveness analysis (2017 (E) & 2025 (F)), by Capacity
Figure 252: APAC retort pouches market absolute $ opportunity (2017 (E)-2025 (F)), by 0 ml- 350 ml segment
Figure 253: APAC retort pouches absolute $ opportunity (2017 (E)-2025 (F)), by 351 ml- 500 ml segment
Figure 254: APAC retort pouches market absolute $ opportunity (2017 (E)-2025 (F)), by 501 ml- 1000 ml segment
Figure 255: APAC retort pouches absolute $ opportunity (2017 (E)-2025 (F)), by 1000 ml- 3000 ml segment
Figure 256: APAC retort pouches market absolute $ opportunity (2017 (E)-2025 (F)), by Above 3001 ml segment
Figure 257: MEA Retort Pouches Market Value Share by Barrier Material (2016)
Figure 258: MEA Retort Pouches Market Value Share by Application (2016)
Figure 259: MEA Retort Pouches Market Value Share by Product Type (2016)
Figure 260: MEA Retort Pouches Market Value Share by Closure (2016)
Figure 261: MEA Retort Pouches Market Value Share by Capacity (2016)
Figure 262: MEA Retort Pouches Market Value Share by Country (2016)
Figure 263: MEA Retort Pouches Market, Value (US$ Mn) and volume (Mn Units) analysis, 2016 (A)- 2025 (F)
Figure 264: MEA Retort Pouches Market, Absolute $ Opportunity, 2017 (E) -2025 (F)
Figure 265: MEA Retort Pouches Market, Value Share and BPS Analysis, By Country, 2017 (E) & 2025 (F))
Figure 266: MEA Retort Pouches Market Attractiveness analysis, By Country (2017 (E) & 2025 (F))
Figure 267: MEA Retort Pouches Market, Value Y-o-Y growth, By Country, 2017 (E) & 2025 (F)
Figure 268: MEA Retort Pouches market BPS analysis (2017 (E) & 2025), By Barrier Material
Figure 269: MEA Retort Pouches market attractiveness analysis (2017 (E) & 2025 (F)), By Barrier Material
Figure 270: MEA retort pouches market absolute $ opportunity (2017 (E)-2025 (F)), by Aluminum foil segment
Figure 271: MEA retort pouches absolute $ opportunity (2017 (E)-2025 (F)), by Polypropylene segment
Figure 272: MEA retort pouches market absolute $ opportunity (2017 (E)-2025 (F)), by Food Grade Cast PP segment
Figure 273: MEA retort pouches absolute $ opportunity (2017 (E)-2025 (F)), by Polyamide segment
Figure 274: MEA retort pouches market absolute $ opportunity (2017 (E)-2025 (F)), by Polyethylene segment
Figure 275: MEA Retort Pouches Market Value (US$ Mn) forecast, By polyethylene sub-segment, 2016 - 2025
Figure 276: MEA Retort Pouches Market Volume (Mn Units) forecast, By polyethylene sub-segment, 2016 - 2025
Figure 277: MEA Retort Pouches market BPS analysis (2017 (E) & 2025(F)), by Application
Figure 278: MEA Retort Pouches market attractiveness analysis (2017 (E) & 2025 (F)), by Application
Figure 279: MEA retort pouches market absolute $ opportunity (2017 (E)-2025 (F)), by Food segment
Figure 280: MEA Retort Pouches Market Value (US$ Mn) forecast, By Food sub-segment, 2016 - 2025
Figure 281: MEA Retort Pouches Market Volume (Mn Units) forecast, By Food sub-segment, 2016 - 2025
Figure 282: MEA retort pouches market absolute $ opportunity (2017 (E)-2025(F)), by Food segment
Figure 283: MEA Retort Pouches market BPS analysis (2017 (E) & 2025), by Product Type
Figure 284: MEA Retort Pouches market attractiveness analysis (2017 (E) & 2025 (F)), by Product Type
Figure 285: MEA retort pouches market absolute $ opportunity (2017 (E)-2025 (F)), by Stand Up pouches segment
Figure 286: MEA retort pouches market absolute $ opportunity (2017 (E)-2025 (F)), by Spouted pouches segment
Figure 287: MEA retort pouches market absolute $ opportunity (2017 (E)-2025 (F)), by Zipper pouches segment
Figure 288: MEA retort pouches market absolute $ opportunity (2017 (E)-2025 (F)), by Pillow Pack segment
Figure 289: MEA retort pouches market absolute $ opportunity (2017 (E)-2025 (F)), by 3- side sealed segment
Figure 290: MEA Retort Pouches market BPS analysis (2017 (E) & 2025 (F)), by Closure Type
Figure 291: MEA Retort Pouches market attractiveness analysis (2017 (E) & 2025(F)), by Closure Type
Figure 292: MEA retort pouches market absolute $ opportunity (2017 (E)-2025 (F), by With Cap segment
Figure 293: MEA Retort Pouches Market Value (US$ Mn) forecast, By With Cap Sub-segment, 2016 - 2025
Figure 294: MEA Retort Pouches Market Volume (Mn Units) forecast, By With Cap Sub-segment, 2016 - 2025
Figure 295: MEA retort pouches market absolute $ opportunity (2017 (E)-2025 (F)), by Without Cap segment
Figure 296: MEA Retort Pouches Market Value (US$ Mn) forecast, By Without Cap Sub-segment, 2016 - 2025
Figure 297: MEA Retort Pouches Market Volume (Mn Units) forecast, By Without Cap Sub-segment, 2016 - 2025
Figure 298: MEA Retort Pouches market BPS analysis (2017 (E) & 2025 (F)), by Capacity
Figure 299: MEA Retort Pouches market attractiveness analysis (2017 (E) & 2025 (F)), by Capacity
Figure 300: MEA retort pouches market absolute $ opportunity (2017 (E)-2025 (F)), by 0 ml- 350 ml segment
Figure 301: MEA retort pouches absolute $ opportunity (2017 (E)-2025 (F)), by 351 ml- 500 ml segment
Figure 302: MEA retort pouches market absolute $ opportunity (2017 (E)-2025 (F)), by 501 ml- 1000 ml segment
Figure 303: MEA retort pouches absolute $ opportunity (2017 (E)-2025 (F)), by 1000 ml- 3000 ml segment
Figure 304: MEA retort pouches market absolute $ opportunity (2017 (E)-2025), by Above 3001 ml segment
Copyright © Transparency Market Research, Inc. All Rights reserved
Trust Online

Retort Pouches Market