
Reports
Reports
Analysts’ Viewpoint on Rear Axle Commodity Market Scenario
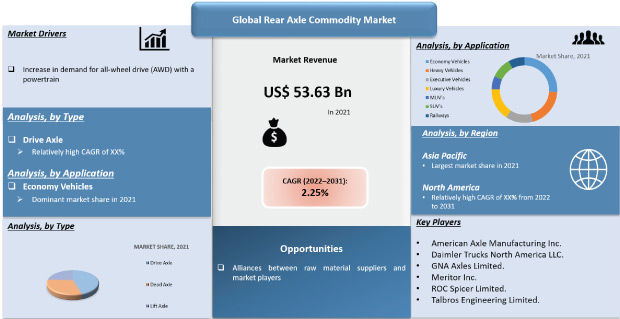
Some of the key factors influencing the market for rear axle commodities include the implementation of stringent emission norms by governments, demand for fuel-efficient vehicles, and increasing demand for passenger cars in developed countries. A rise in demand for all-wheel drive (AWD) vehicles with a powertrain capable of providing power to all wheels for enhanced maneuvering is also projected to boost the growth of the rear axle commodity market during the forecast period. In order to overcome the losses made during the COVID-19 pandemic, companies in the rear axle commodity market should adopt contingency planning to strategically allocate budgets for capital and expenditures. The growth of the last mile delivery industry is also fueling the demand for robust rear axle commodities in the railway sector and light trucks.
The rear axle is the last member of the powertrain. In most vehicles, it acts as the driving axle. It is placed between the driving wheels and the differential gear. The rear axle commodity is also known as the automotive rear beam axle. It transmits power from the differential to the driving wheels. The rear axle and differential gear are enclosed in housing, which protects them from water, dust, and damage. It carries out the function of driving, steering, and braking of the vehicle.
The rear axle also ensures the stability of the vehicle by distributing the weight of the vehicle equally across all its part. A non-driving axle, such as a dead axle, which is used in heavy vehicles and light trucks, does not have shafts and serves only as a steering component and suspension. Another factor propelling the market growth is electrified power solutions that are growing popular in passenger vehicles and SUVs to enhance the driving experience of car owners.
Three key types of rear axle commodity are used in vehicles such as dead axle, drive axle, and lift axle. The use of rear axles in railways is also of utmost significance. Straight rear axles are used for the engine of the trains, and straight dead axle is used for wagons. A straight axle is a rigid shaft that connects the left side of the wheel to the right side. This ensures the fixed axis rotation of both wheels and such a design keeps the wheels stable under different load conditions.
According to the latest report published by Transparency Market Research, the global rear axle commodity market is projected to advance at a decent growth rate during the forecast period, owing to the increasing need for fuel-efficient vehicles as well as the demand for low emission vehicles, coupled with lightweight automotive parts.
One of the key drivers for the rear axle commodity market is the increasing demand for heavy vehicles such as heavy trucks, buses, and coaches, from developing economies, such as India and China, for transportation purposes. The need for heavy lifting operations is rising, and these operations are carried out by heavy vehicles or heavy-duty commercial vehicles that have lift axles installed in them. These key factors are further boosting the sales of commercial or heavy vehicles in developed and developing countries.
Developing economies, such as India which are exhibiting significant GDP growth, are further expected to propel the demand for automotive components. A rapid increase in the production of heavy vehicles is ultimately expected to increase the demand for automotive components such as rear axle and propeller shaft.
Manufacturers of the automotive axle are forming strategic alliances with raw material suppliers such as aluminum, steel, and other materials, and manufacturing equipment providers to cater to the rising demand from automakers. Furthermore, manufacturers are focused on producing lightweight components such as rear axles. There is also an emerging trend for designing and developing propeller shafts, which are cost-effective and lightweight. Therefore, currently, suppliers are more inclined toward using lightweight materials such as a replacement for metals to make the axle drivetrain components owing to their advantageous features, including corrosion resistance, high strength to weight ratio, and enhanced workability.
For instance, Meritor Inc., a U.S.-based axle manufacturing company, invested US$ 36.5 Mn to expand its assembly line in India. These developments are likely to propel growth in the market in the next few years.
In terms of type, the global rear axle commodity market has been classified into drive axle, dead axle, and lift axle. The drive axle segment held a large revenue share of 39.67% of the market in 2021. The segment is estimated to maintain its position in the market and advance at a growth rate of more than 2.78% during the forecast period. Increasing penetration of all-wheel drives in passenger cars is fueling the demand for technologically advanced axles among consumers.
The dead axle segment held a significant share of the market, in terms of volume, in 2021. This segment is anticipated to grow at a sluggish pace owing to increasing demand for long-haul trailers. Segments such as dead axles and drive axles are expected to propel at a notable CAGR, in terms of value, during the forecast period.
In terms of application, the global rear axle commodity market has been classified into economy vehicles, heavy vehicles, executive vehicles, luxury vehicles, MUVs, SUVs, and railways. The economy vehicles segment held a significant share of 34.12% of the market in 2021. The segment is estimated to maintain its position and grow at a CAGR of more than 2.0% during the forecast period. The need for comfort, safety, and security in passenger vehicles is expected to rise in the coming years. This factor is expected to drive the growth of the segment.
In addition, lightweight and advanced rear axles reduce the overall weight of vehicles, enabling better handling, fuel efficiency, and even weight distribution of the vehicle. Hence, these factors are also estimated to drive the growth of the segment during the forecast period. All these factors are likely to propel the demand for rear axle commodity during the forecast period.
In terms of volume, Asia Pacific held a notable share of 36.90% of the global market in 2021. Forthcoming emission norms in the Asia Pacific are a prominent factor driving the rear axle commodity market. The market in the region is also estimated to register at a substantial CAGR during the forecast period owing to the increasing urbanization and growing adoption of economy vehicles and heavy vehicles in the region. The market is also projected to grow in terms of value and volume due to the increasing demand for personal vehicles owing to the increasing disposable incomes & population of the region.
North America and Europe accounted for a notable share of the global rear axle commodity market, due to the presence of prominent players in these regions. Additionally, key players in these regions are investing in automotive technologies, which in turn is anticipated to fuel the demand for rear axle commodity.
The Rest of the World accounted for a relatively minor share of the global market owing to the lack of presence of prominent players in the market in the region
The global rear axle commodity market is consolidated with a small number of manufacturers controlling a majority of the market share. The majority of the firms are spending significantly on comprehensive research & development, primarily to develop lightweight components.
Key players operating in the global rear axle commodity market are diversifying their presence by engaging in mergers and acquisition activities or by establishing new facilities. American Axle Manufacturing Inc., Daimler Trucks North America LLC., GNA Axle Limited., Meritor Inc., ROC Spicer Limited., and Talbros Engineering Limited. are the prominent entities operating in the market.
Each of these players has been profiled in the rear axle commodity market report based on parameters such as company overview, financial overview, business strategies, product portfolio, business segments, and recent developments.
|
Attribute |
Detail |
|
Market Size Value in 2021 |
US$ 53.63 Bn |
|
Market Forecast Value in 2031 |
US$ 66.99 Bn |
|
Growth Rate (CAGR) |
2.25% |
|
Forecast Period |
2022–2031 |
|
Historical Data Available for |
2017–2021 |
|
Quantitative Units |
US$ Bn for Value & Units for Volume |
|
Market Analysis |
It includes cross segment analysis at global as well as regional level. Furthermore, qualitative analysis includes drivers, restraints, opportunities, key trends, Porter’s Five Forces analysis, value chain analysis, and key trend analysis. |
|
Competition Landscape |
|
|
Format |
Electronic (PDF) + Excel |
|
Market Segmentation |
|
|
Regions Covered |
|
|
Countries Covered |
|
|
Companies Profiled |
|
|
Customization Scope |
Available upon request |
|
Pricing |
Available upon request |
Rear Axle Commodity Market is projected to reach US$ 66.99 Bn by the end of 2031
Rear Axle Commodity Market is expected to grow at a CAGR of 2.25% during 2022-2031
Rear Axle Commodity Market is studied from 2022-2031
Key vendors in the Rear Axle Commodity Market are ROC Spicer Ltd., GNA Axles Ltd., American Axle & Manufacturing Holdings, Inc., Talbros Engineering Limited, Meritor, Inc., and Daimler Trucks North America LLC.
North America and Europe region Takes Lead in the Rear Axle Commodity Market
1. Executive Summary
1.1. Global Market Outlook
1.1.1. Market Value US$ Bn, 2017‒2031
1.2. Competitive Dashboard Analysis
2. Market Overview
2.1. TMR Analysis and Recommendations
2.2. Market Dynamics
2.2.1. Drivers
2.2.2. Restraints
2.2.3. Opportunity
2.3. Market Factor Analysis
2.3.1. Porter’s Five Force Analysis
2.3.2. SWOT Analysis
2.3.3. Value Chain Analysis
2.3.3.1. Raw Material Suppliers
2.3.3.2. Component Manufacturers
2.3.3.3. OEM’s (Automakers)
2.3.3.4. End-users
2.4. Regulatory Scenario
2.5. Key Trend Analysis
3. COVID-19 Impact Analysis – Rear Axle Commodity Market
4. Global Rear Axle Commodity Market, by Type
4.1. Market Snapshot
4.1.1. Introduction, Definition, and Key Findings
4.1.2. Market Growth & Y-o-Y Projections
4.1.3. Base Point Share Analysis
4.2. Global Rear Axle Commodity Market Size Analysis & Forecast, by Type, 2017‒2031
4.2.1. Drive Axle
4.2.2. Dead Axle
4.2.3. Lift Axle
5. Global Rear Axle Commodity Market, By Application
5.1. Market Snapshot
5.1.1. Introduction, Definition, and Key Findings
5.1.2. Market Growth & Y-o-Y Projections
5.1.3. Base Point Share Analysis
5.2. Global Rear Axle Commodity Market Size Analysis & Forecast, by Application, 2017‒2031
5.2.1. Economy Vehicles
5.2.2. Heavy Vehicles
5.2.3. Executive Vehicles
5.2.4. Luxury Vehicles
5.2.5. MUVs
5.2.6. SUVs
5.2.7. Railways
6. Global Rear Axle Commodity Market, by Region
6.1. Market Snapshot
6.1.1. Introduction, Definition, and Key Findings
6.1.2. Market Growth & Y-o-Y Projections
6.1.3. Base Point Share Analysis
6.2. Global Rear Axle Commodity Market Size Analysis & Forecast, by Region, 2017‒2031
6.2.1. North America
6.2.2. Europe
6.2.3. Asia Pacific
6.2.4. Middle East & Africa
6.2.5. South America
7. North America Rear Axle Commodity Market
7.1. Market Snapshot
7.2. Rear Axle Commodity Market Size Analysis & Forecast, by Type, 2017‒2031
7.2.1. Drive Axle
7.2.2. Dead Axle
7.2.3. Lift Axle
7.3. Rear Axle Commodity Market Size Analysis & Forecast, by Application, 2017‒2031
7.3.1. Economy Vehicles
7.3.2. Heavy Vehicles
7.3.3. Executive Vehicles
7.3.4. Luxury Vehicles
7.3.5. MUVs
7.3.6. SUVs
7.3.7. Railways
7.4. Key Country Analysis – North America Rear Axle Commodity Market Size Analysis & Forecast, 2017‒2031
7.4.1. U.S.
7.4.2. Canada
7.4.3. Mexico
8. Europe Rear Axle Commodity Market
8.1. Market Snapshot
8.2. Rear Axle Commodity Market Size Analysis & Forecast, by Type, 2017‒2031
8.2.1. Drive Axle
8.2.2. Dead Axle
8.2.3. Lift Axle
8.3. Rear Axle Commodity Market Size Analysis & Forecast, by Application, 2017‒2031
8.3.1. Economy Vehicles
8.3.2. Heavy Vehicles
8.3.3. Executive Vehicles
8.3.4. Luxury Vehicles
8.3.5. MUVs
8.3.6. SUVs
8.3.7. Railways
8.4. Key Country Analysis – Europe Rear Axle Commodity Market Size Analysis & Forecast, 2017‒2031
8.4.1. Germany
8.4.2. U. K.
8.4.3. France
8.4.4. Italy
8.4.5. Spain
8.4.6. Nordic Countries
8.4.7. Russia & CIS
8.4.8. Rest of Europe
9. Asia Pacific Rear Axle Commodity Market
9.1. Market Snapshot
9.2. Rear Axle Commodity Market Size Analysis & Forecast, by Type, 2017‒2031
9.2.1. Drive Axle
9.2.2. Dead Axle
9.2.3. Lift Axle
9.3. Rear Axle Commodity Market Size Analysis & Forecast, by Application, 2017‒2031
9.3.1. Economy Vehicles
9.3.2. Heavy Vehicles
9.3.3. Executive Vehicles
9.3.4. Luxury Vehicles
9.3.5. MUVs
9.3.6. SUVs
9.3.7. Railways
9.4. Key Country Analysis – Asia Pacific Rear Axle Commodity Market Size Analysis & Forecast, 2017‒2031
9.4.1. China
9.4.2. India
9.4.3. Japan
9.4.4. ASEAN Countries
9.4.5. South Korea
9.4.6. ANZ
9.4.7. Rest of Asia Pacific
10. Middle East & Africa Rear Axle Commodity Market
10.1. Market Snapshot
10.2. Rear Axle Commodity Market Size Analysis & Forecast, by Type, 2017‒2031
10.2.1. Drive Axle
10.2.2. Dead Axle
10.2.3. Lift Axle
10.3. Rear Axle Commodity Market Size Analysis & Forecast, by Application, 2017‒2031
10.3.1. Economy Vehicles
10.3.2. Heavy Vehicles
10.3.3. Executive Vehicles
10.3.4. Luxury Vehicles
10.3.5. MUVs
10.3.6. SUVs
10.3.7. Railways
10.4. Key Country Analysis – Middle East & Africa Rear Axle Commodity Market Size Analysis & Forecast, 2017‒2031
10.4.1. GCC
10.4.2. South Africa
10.4.3. Turkey
10.4.4. Rest of Middle East & Africa
11. South America Rear Axle Commodity Market
11.1. Market Snapshot
11.2. Rear Axle Commodity Market Size Analysis & Forecast, by Type, 2017‒2031
11.2.1. Drive Axle
11.2.2. Dead Axle
11.2.3. Lift Axle
11.3. Rear Axle Commodity Market Size Analysis & Forecast, by Application, 2017‒2031
11.3.1. Economy Vehicles
11.3.2. Heavy Vehicles
11.3.3. Executive Vehicles
11.3.4. Luxury Vehicles
11.3.5. MUVs
11.3.6. SUVs
11.3.7. Railways
11.4. Key Country Analysis – South America Rear Axle Commodity Market Size Analysis & Forecast, 2017‒2031
11.4.1. Brazil
11.4.2. Argentina
11.4.3. Rest of South America
12. Competitive Landscape
12.1. Company Share Analysis/ Brand Share Analysis, 2020
12.2. Pricing comparison among key players
12.3. Company Analysis for each player
(Company Overview, Company Footprints, Production Locations, Product Portfolio, Competitors & Customers, Subsidiaries & Parent Organization, Recent Developments, Financial Analysis, Profitability, Revenue Share)
13. Company Profile/ Key Players
13.1.1. American Axle Manufacturing Inc.
13.1.1.1. Company Overview
13.1.1.2. Company Footprints
13.1.1.3. Production Locations
13.1.1.4. Product Portfolio
13.1.1.5. Competitors & Customers
13.1.1.6. Subsidiaries & Parent Organization
13.1.1.7. Recent Developments
13.1.1.8. Financial Analysis
13.1.1.9. Profitability
13.1.1.10. Revenue Share
13.1.2. Daimler Trucks North America LLC.
13.1.2.1. Company Overview
13.1.2.2. Company Footprints
13.1.2.3. Production Locations
13.1.2.4. Product Portfolio
13.1.2.5. Competitors & Customers
13.1.2.6. Subsidiaries & Parent Organization
13.1.2.7. Recent Developments
13.1.2.8. Financial Analysis
13.1.2.9. Profitability
13.1.2.10. Revenue Share
13.1.3. GNA Axles Limited.
13.1.3.1. Company Overview
13.1.3.2. Company Footprints
13.1.3.3. Production Locations
13.1.3.4. Product Portfolio
13.1.3.5. Competitors & Customers
13.1.3.6. Subsidiaries & Parent Organization
13.1.3.7. Recent Developments
13.1.3.8. Financial Analysis
13.1.3.9. Profitability
13.1.3.10. Revenue Share
13.1.4. Meritor Inc.
13.1.4.1. Company Overview
13.1.4.2. Company Footprints
13.1.4.3. Production Locations
13.1.4.4. Product Portfolio
13.1.4.5. Competitors & Customers
13.1.4.6. Subsidiaries & Parent Organization
13.1.4.7. Recent Developments
13.1.4.8. Financial Analysis
13.1.4.9. Profitability
13.1.4.10. Revenue Share
13.1.5. ROC Spicer Limited.
13.1.5.1. Company Overview
13.1.5.2. Company Footprints
13.1.5.3. Production Locations
13.1.5.4. Product Portfolio
13.1.5.5. Competitors & Customers
13.1.5.6. Subsidiaries & Parent Organization
13.1.5.7. Recent Developments
13.1.5.8. Financial Analysis
13.1.5.9. Profitability
13.1.5.10. Revenue Share
13.1.6. Talbros Engineering Limited.
13.1.6.1. Company Overview
13.1.6.2. Company Footprints
13.1.6.3. Production Locations
13.1.6.4. Product Portfolio
13.1.6.5. Competitors & Customers
13.1.6.6. Subsidiaries & Parent Organization
13.1.6.7. Recent Developments
13.1.6.8. Financial Analysis
13.1.6.9. Profitability
13.1.6.10. Revenue Share
13.1.7. Other Key Players
13.1.7.1. Company Overview
13.1.7.2. Company Footprints
13.1.7.3. Production Locations
13.1.7.4. Product Portfolio
13.1.7.5. Competitors & Customers
13.1.7.6. Subsidiaries & Parent Organization
13.1.7.7. Recent Developments
13.1.7.8. Financial Analysis
13.1.7.9. Profitability
13.1.7.10. Revenue Share
List of Tables
Table 1: Global Rear Axle Commodity Market Volume (Units) Forecast, by Type, 2017‒2031
Table 2: Global Rear Axle Commodity Market Value (US$ Bn) Forecast, by Type, 2017‒2031
Table 3: Global Rear Axle Commodity Market Volume (Units) Forecast, by Application, 2017‒2031
Table 4: Global Rear Axle Commodity Market Value (US$ Bn) Forecast, by Application, 2017‒2031
Table 5: Global Rear Axle Commodity Market Volume (Units) Forecast, by Region, 2017‒2031
Table 6: Global Rear Axle Commodity Market Value (US$ Bn) Forecast, by Region, 2017‒2031
Table 7: North America Rear Axle Commodity Market Volume (Units) Forecast, by Type, 2017‒2031
Table 8: North America Rear Axle Commodity Market Value (US$ Bn) Forecast, by Type, 2017‒2031
Table 9: North America Rear Axle Commodity Market Volume (Units) Forecast, by Application, 2017‒2031
Table 10: North America Rear Axle Commodity Market Value (US$ Bn) Forecast, by Application, 2017‒2031
Table 11: North America Rear Axle Commodity Market Volume (Units) Forecast, by Country, 2017‒2031
Table 12: North America Rear Axle Commodity Market Value (US$ Bn) Forecast, by Country, 2017‒2031
Table 13: Europe Rear Axle Commodity Market Volume (Units) Forecast, by Type, 2017‒2031
Table 14: Europe Rear Axle Commodity Market Value (US$ Bn) Forecast, by Type, 2017‒2031
Table 15: Europe Rear Axle Commodity Market Volume (Units) Forecast, by Application, 2017‒2031
Table 16: Europe Rear Axle Commodity Market Value (US$ Bn) Forecast, by Application, 2017‒2031
Table 17: Europe Rear Axle Commodity Market Volume (Units) Forecast, by Country & Sub-region, 2017‒2031
Table 18: Europe Rear Axle Commodity Market Value (US$ Bn) Forecast, by Country & Sub-region, 2017‒2031
Table 19: Asia Pacific Rear Axle Commodity Market Volume (Units) Forecast, by Type, 2017‒2031
Table 20: Asia Pacific Rear Axle Commodity Market Value (US$ Bn) Forecast, by Type, 2017‒2031
Table 21: Asia Pacific Rear Axle Commodity Market Volume (Units) Forecast, by Application, 2017‒2031
Table 22: Asia Pacific Rear Axle Commodity Market Value (US$ Bn) Forecast, by Application, 2017‒2031
Table 23: Asia Pacific Rear Axle Commodity Market Volume (Units) Forecast, by Country & Sub-region, 2017‒2031
Table 24: Asia Pacific Rear Axle Commodity Market Value (US$ Bn) Forecast, by Country & Sub-region, 2017‒2031
Table 25: Middle East & Africa Rear Axle Commodity Market Volume (Units) Forecast, by Type, 2017‒2031
Table 26: Middle East & Africa Rear Axle Commodity Market Value (US$ Bn) Forecast, by Type, 2017‒2031
Table 27: Middle East & Africa Rear Axle Commodity Market Volume (Units) Forecast, by Application, 2017‒2031
Table 28: Middle East & Africa Rear Axle Commodity Market Value (US$ Bn) Forecast, by Application, 2017‒2031
Table 29: Middle East & Africa Rear Axle Commodity Market Volume (Units) Forecast, by Country & Sub-region, 2017‒2031
Table 30: Middle East & Africa Rear Axle Commodity Market Value (US$ Bn) Forecast, by Country & Sub-region, 2017‒2031
Table 31: South America Rear Axle Commodity Market Volume (Units) Forecast, by Type, 2017‒2031
Table 32: South America Rear Axle Commodity Market Value (US$ Bn) Forecast, by Type, 2017‒2031
Table 33: South America Rear Axle Commodity Market Volume (Units) Forecast, by Application, 2017‒2031
Table 34: South America Rear Axle Commodity Market Value (US$ Bn) Forecast, by Application, 2017‒2031
Table 35: South America Rear Axle Commodity Market Volume (Units) Forecast, by Country & Sub-region, 2017‒2031
Table 36: South America Rear Axle Commodity Market Value (US$ Bn) Forecast, by Country & Sub-region, 2017‒2031
List of Figures
Figure 1: Global Rear Axle Commodity Market Volume (Units) Forecast, by Type, 2017‒2031
Figure 2: Global Rear Axle Commodity Market Value (US$ Bn) Forecast, by Type, 2017‒2031
Figure 3: Global Rear Axle Commodity Market, Incremental Opportunity, by Type, Value (US$ Bn), 2022‒2031
Figure 4: Global Rear Axle Commodity Market Volume (Units) Forecast, by Application, 2017‒2031
Figure 5: Global Rear Axle Commodity Market Value (US$ Bn) Forecast, by Application, 2017‒2031
Figure 6: Global Rear Axle Commodity Market, Incremental Opportunity, by Application, Value (US$ Bn), 2022‒2031
Figure 7: Global Rear Axle Commodity Market Volume (Units) Forecast, by Region, 2017‒2031
Figure 8: Global Rear Axle Commodity Market Value (US$ Bn) Forecast, by Region, 2017‒2031
Figure 9: Global Rear Axle Commodity Market, Incremental Opportunity, by Region, Value (US$ Bn), 2022‒2031
Figure 10: North America Rear Axle Commodity Market Volume (Units) Forecast, by Type, 2017‒2031
Figure 11: North America Rear Axle Commodity Market Value (US$ Bn) Forecast, by Type, 2017‒2031
Figure 12: North America Rear Axle Commodity Market, Incremental Opportunity, by Type, Value (US$ Bn), 2022‒2031
Figure 13: North America Rear Axle Commodity Market Volume (Units) Forecast, by Application, 2017‒2031
Figure 14: North America Rear Axle Commodity Market Value (US$ Bn) Forecast, by Application, 2017‒2031
Figure 15: North America Rear Axle Commodity Market, Incremental Opportunity, by Application, Value (US$ Bn), 2022‒2031
Figure 16: North America Rear Axle Commodity Market Volume (Units) Forecast, by Country, 2017‒2031
Figure 17: North America Rear Axle Commodity Market Value (US$ Bn) Forecast, by Country, 2017‒2031
Figure 18: North America Rear Axle Commodity Market, Incremental Opportunity, by Country, Value (US$ Bn), 2022‒2031
Figure 19: Europe Rear Axle Commodity Market Volume (Units) Forecast, by Type, 2017‒2031
Figure 20: Europe Rear Axle Commodity Market Value (US$ Bn) Forecast, by Type, 2017‒2031
Figure 21: Europe Rear Axle Commodity Market, Incremental Opportunity, by Type, Value (US$ Bn), 2022‒2031
Figure 22: Europe Rear Axle Commodity Market Volume (Units) Forecast, by Application, 2017‒2031
Figure 23: Europe Rear Axle Commodity Market Value (US$ Bn) Forecast, by Application, 2017‒2031
Figure 24: Europe Rear Axle Commodity Market, Incremental Opportunity, by Application, Value (US$ Bn), 2022‒2031
Figure 25: Europe Rear Axle Commodity Market Volume (Units) Forecast, by Country & Sub-region, 2017‒2031
Figure 26: Europe Rear Axle Commodity Market Value (US$ Bn) Forecast, by Country & Sub-region, 2017‒2031
Figure 27: Europe Rear Axle Commodity Market, Incremental Opportunity, by Country & Sub-region, Value (US$ Bn), 2022‒2031
Figure 28: Asia Pacific Rear Axle Commodity Market Volume (Units) Forecast, by Type, 2017‒2031
Figure 29: Asia Pacific Rear Axle Commodity Market Value (US$ Bn) Forecast, by Type, 2017‒2031
Figure 30: Asia Pacific Rear Axle Commodity Market, Incremental Opportunity, by Type, Value (US$ Bn), 2022‒2031
Figure 31: Asia Pacific Rear Axle Commodity Market Volume (Units) Forecast, by Application, 2017‒2031
Figure 32: Asia Pacific Rear Axle Commodity Market Value (US$ Bn) Forecast, by Application, 2017‒2031
Figure 33: Asia Pacific Rear Axle Commodity Market, Incremental Opportunity, by Application, Value (US$ Bn), 2022‒2031
Figure 34: Asia Pacific Rear Axle Commodity Market Volume (Units) Forecast, by Country & Sub-region, 2017‒2031
Figure 35: Asia Pacific Rear Axle Commodity Market Value (US$ Bn) Forecast, by Country & Sub-region, 2017‒2031
Figure 36: Asia Pacific Rear Axle Commodity Market, Incremental Opportunity, by Country & Sub-region, Value (US$ Bn), 2022‒2031
Figure 37: Middle East & Africa Rear Axle Commodity Market Volume (Units) Forecast, by Type, 2017‒2031
Figure 38: Middle East & Africa Rear Axle Commodity Market Value (US$ Bn) Forecast, by Type, 2017‒2031
Figure 39: Middle East & Africa Rear Axle Commodity Market, Incremental Opportunity, by Type, Value (US$ Bn), 2022‒2031
Figure 40: Middle East & Africa Rear Axle Commodity Market Volume (Units) Forecast, by Application, 2017‒2031
Figure 41: Middle East & Africa Rear Axle Commodity Market Value (US$ Bn) Forecast, by Application, 2017‒2031
Figure 42: Middle East & Africa Rear Axle Commodity Market, Incremental Opportunity, by Application, Value (US$ Bn), 2022‒2031
Figure 43: Middle East & Africa Rear Axle Commodity Market Volume (Units) Forecast, by Country & Sub-region, 2017‒2031
Figure 44: Middle East & Africa Rear Axle Commodity Market Value (US$ Bn) Forecast, by Country & Sub-region, 2017‒2031
Figure 45: Middle East & Africa Rear Axle Commodity Market, Incremental Opportunity, by Country & Sub-region, Value (US$ Bn), 2022‒2031
Figure 46: South America Rear Axle Commodity Market Volume (Units) Forecast, by Type, 2017‒2031
Figure 47: South America Rear Axle Commodity Market Value (US$ Bn) Forecast, by Type, 2017‒2031
Figure 48: South America Rear Axle Commodity Market, Incremental Opportunity, by Type, Value (US$ Bn), 2022‒2031
Figure 49: South America Rear Axle Commodity Market Volume (Units) Forecast, by Application, 2017‒2031
Figure 50: South America Rear Axle Commodity Market Value (US$ Bn) Forecast, by Application, 2017‒2031
Figure 51: South America Rear Axle Commodity Market, Incremental Opportunity, by Application, Value (US$ Bn), 2022‒2031
Figure 52: South America Rear Axle Commodity Market Volume (Units) Forecast, by Country & Sub-region, 2017‒2031
Figure 53: South America Rear Axle Commodity Market Value (US$ Bn) Forecast, by Country & Sub-region, 2017‒2031
Figure 54: South America Rear Axle Commodity Market, Incremental Opportunity, by Country & Sub-region, Value (US$ Bn), 2022‒2031
Copyright © Transparency Market Research, Inc. All Rights reserved
Trust Online

Rear Axle Commodity Market