
Reports
Reports
Analysts’ Viewpoint on Global Ready-to-Drink Beverages Market Scenario
Increasing urbanization and growing demand for flavored drinks and fruit juices across the globe are anticipated to drive the ready-to-drink beverages market. Companies in the ready-to-drink beverages market are focusing on branding and packaging of products to appeal to the customers. Moreover, the rising product launches combined with innovative marketing campaigns is determining market growth. Furthermore, consumer willingness to try healthier refreshing beverages made from versatile ingredients is likely to positively influence the market growth. Additionally, easy accessibility of the product with increased consumer touch points is expected to improve sales performance of ready-to-drink beverages.
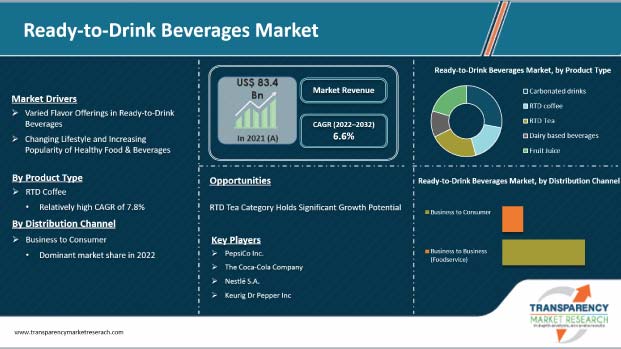
Ready-to-drink beverages are packaged flavored/carbonated drinks, which are available for direct consumption in the market. The convenience and instant nature offered by ready-to-drink beverages are some of the key drivers for the ready-to-drink beverages market globally. Furthermore, changing consumer preferences and hectic lifestyles are other factors that are shaping the market for ready-to-drink beverages. In addition, the global sales of RTD tea and coffee account for approximately 40% of the overall ready-to-drink beverage sales.
Coffee is an important beverage in almost every region, due to its soothing and savory taste, rich smell, and caffeine content, and is consumed by almost every age group. The energy benefits offered by this drink is also luring elderly population, due to their similar taste to tea and coffee. Thus, along with its instant nature, the familiarity in the taste offered by ready-to-drink coffee acts as another driving factor for the growth of its market.
The growth opportunities in the RTD beverages market can also be attributed to the diverse range of popular and liked flavors offered by companies. The demand for flavors in various products has grown rapidly, and continues to grow at a significant rate, with more number of consumers experimenting with food & beverages, and new tastes and flavors. Moreover, different types of coffees are available in RTD coffee products, such as mocha, latte, espresso, cappuccino, etc., thus catering to and fulfilling regional tastes, specific likings and needs of consumers belonging to different regions.
Furthermore, the addition of exotic flavors in the product portfolio will be one of the key strategies adopted by manufacturers to attract the attention of consumers.
The freedom of choice for multiple flavors of tea at any given time is an attractive point of consideration for consumers. RTD drinks allow consumers to choose from multiple tea flavors, which include locally available teas and exotic overseas flavors.
In the U.S. and Canada, getting RTD tea that includes tea concentrates from China and India is a real treat for consumers. In addition, real flavors of fruits and berries are added to the tea. This makes an attractive selling point for manufacturers and creates curiosity among individuals to try new flavors, which is anticipated to increase the demand for flavored tea in the near future.
Based on product type, the carbonated soft drinks (CSDs) segment holds key stake of approximately 28% of the global ready-to-drink beverages market. The market for carbonated drinks is expected to grow at a value CAGR of 5.3% over the forecast period. Consumers are shifting toward the calorie-fueled beverages such as CSDs, which is one of the leading product types of liquid refreshment beverage market across the globe. Furthermore, carbonated soft drinks comes in a wide range of flavors and types that provide leverage to the consumers to choose according to their taste, likings, culture, and needs, which would drive the market for ready-to-drink beverages.
The consumption of ready-to-drink beverages through business to business sales channel is currently valued at US$ 18 Bn and is growing at a CAGR of 6.1%. The sales are fueled by the increasing incidences of eating out and social gatherings. The post-pandemic influence on the foodservice sector is proving profitable for the ready-to-drink beverage manufacturers. With promising sales growth potential, the market is expected to cross US$ 32.5 Bn by the end of 2032.
Europe holds majority value share of approximately 25% of the global ready-to-drink beverages market in 2022. The highest demand for ready-to-drink products arises from millennials and their higher preference toward specialized flavored drink products. Furthermore, the European market for ready-to-drink beverages is anticipated to grow at a volume CAGR of 6.9% over the forecast period.
South Asia and East Asia are likely to hold significant volume shares of the ready-to-drink beverages market in 2022. Owing to the high population growth rate, increasing disposable income of consumers and high per capita consumption of ready-to-drink beverages during the forecast period in both the regions are expected to drive the market at volume CAGRs of 7.4% and 6.9%, respectively.
The Oceania market for ready-to-drink beverages is projected to grow at a value CAGR of 5.1% during the forecast period, and it is poised to exceed US$ 12 Bn by the end of 2032.
The global ready-to-drink beverages market is moderately consolidated with a few large players dominating the marketplace. Key players that are engaged in the production of ready-to-drink beverages are engaging in innovations and new product development for the diversification of their portfolios. Furthermore, manufacturers are focused on establishing production facilities and focusing on strategic acquisitions of local players in various countries to increase their global footprint. Asahi Group Holdings, Ltd., PepsiCo Inc., The Coca-Cola Company, Nestlé S.A., Kraft Heinz Foodservice, Suntory Holdings Limited, Gehl Foods, LLC, O-AT-KA Milk, William B. Reily and Company, Inc., and Danone S.A. are the prominent players operating in this market.
Each of these players have been profiled in the ready-to-drink beverages market report based on parameters such as company overview, financial overview, business strategies, product portfolio, business segments, and recent developments.
Some of the recent developments in the RTD beverages market have been given below:
|
Attribute |
Detail |
|
Market Size Value in 2022 |
US$ 89 Bn |
|
Market Forecast Value in 2032 |
US$ 169.5 Bn |
|
Growth Rate (CAGR) |
6.6% |
|
Forecast Period |
2022–2032 |
|
Historical Data Available for |
2017–2021 |
|
Quantitative Units |
US$ Bn for Value and Million Liters for Volume |
|
Market Analysis |
It includes cross segment analysis at global as well as regional level. Furthermore, qualitative analysis includes drivers, restraints, opportunities, key trends, Porter’s Five Forces analysis, value chain analysis, and key trend analysis. |
|
Competition Landscape |
|
|
Format |
Electronic (PDF) + Excel |
|
Market Segmentation |
|
|
Regions Covered |
|
|
Countries Covered |
|
|
Companies Profiled |
|
|
Customization Scope |
Available upon request |
|
Pricing |
Available upon request |
Ready-to-drink beverages market is expected to reach US$ 89 Bn in 2022.
Ready-to-drink beverages market is estimated to rise at a CAGR of 6.6% during the forecast period.
The global utilization of ready-to-drink beverages is expected to be pegged at 56,966 million liters in 2022.
Carbonated drinks segment dominates the global ready-to-drink beverages market and is likely to hold approximate value share 28% in 2022.
South Asia, East Asia, and Europe hold high growth potential for RTD beverages at CAGRs of 7.9%, 7.4%, and 6.9%, respectively, during the forecast period.
Key players of ready-to-drink beverages market are Asahi Group Holdings, Ltd., PepsiCo Inc., The Coca-cola Company, Nestlé S.A., Kraft Heinz Foodservice, Suntory Holdings Limited, Gehl Foods, LLC, O-AT-KA Milk, William B. Reily and Company, Inc., Danone S.A. etc.
1. Executive Summary
1.1. Global Market Outlook
1.2. Demand Side Trends
1.3. Supply Side Trends
1.4. Analysis and Recommendations
2. Market Overview
2.1. Market Coverage / Taxonomy
2.2. Market Definition / Scope / Limitations
3. Key Market Trends
3.1. Key Trends Impacting the Market
3.2. Product Innovation / Development Trends
4. Key Success Factors
4.1. Product USPs / Features
4.2. Key Promotional Strategies
5. Global Ready-to-Drink Beverages Market Demand Analysis 2017–2021 and Forecast, 2022–2032
5.1. Historical Market Volume (Liters) Analysis, 2017–2021
5.2. Current and Future Market Volume (Liters) Projections, 2022–2032
5.2.1. Y-o-Y Growth Trend Analysis
6. Global Ready-to-Drink Beverages Market - Pricing Analysis
6.1. Regional Pricing Analysis, by Source
6.2. Global Average Pricing Analysis Benchmark
7. Global Ready-to-Drink Beverages Market Demand (in Value or Size in US$ Mn) Analysis 2017–2021 and Forecast, 2022–2032
7.1. Historical Market Value (US$ Mn) Analysis, 2017–2021
7.2. Current and Future Market Value (US$ Mn) Projections, 2022–2032
7.2.1. Y-o-Y Growth Trend Analysis
7.2.2. Absolute $ Opportunity Analysis
8. Market Background
8.1. Macro-Economic Factors
8.1.1. Global GDP Growth Outlook
8.1.2. Global Food & Beverage industry Overview
8.1.3. Global GDP and Infrastructure Investment
8.1.4. International Trade
8.1.5. Global Industry Outlook
8.2. Forecast Factors - Relevance & Impact
8.2.1. Top Companies Historical Growth
8.2.2. GDP Growth forecast
8.2.3. Manufacturing Industry forecast
8.2.4. Global Urbanization Growth Outlook
8.2.5. Business Climate
8.3. COVID-19 Crisis – Impact Assessment
8.3.1. Current Statistics
8.3.2. Short-Mid-Long Term Outlook
8.3.3. Likely Rebound
8.4. Value Chain
8.4.1. Raw Material Suppliers
8.4.2. Product Manufacturers
8.4.3. Functionalities
8.5. COVID-19 Crisis – Impact Assessment
8.5.1. Current Statistics
8.5.2. Short-Mid-Long Term Outlook
8.5.3. Likely Rebound
8.6. Impact of COVID-19 on Food & Beverage Industry
8.7. Global Food & Beverages Industry Outlook
8.8. Product Portfolio Analysis – Key Players
8.9. Market Dynamics
8.9.1. Drivers
8.9.2. Restraints
8.9.3. Opportunity Analysis
8.10. Global Supply Demand Analysis
9. Global Ready-to-Drink Beverages Market Analysis 2017–2021 and Forecast 2022–2032, by Product Type
9.1. Introduction / Key Findings
9.2. Historical Market Size (US$ Mn) and Volume Analysis By Product Type, 2017–2021
9.3. Current and Future Market Size (US$ Mn) and Volume Analysis and Forecast By Product Type, 2022–2032
9.3.1. Carbonated Soft Drinks
9.3.2. RTD Coffee
9.3.3. RTD Tea
9.3.4. Dairy-based Beverages
9.3.5. Fruit Juice
9.4. Market Attractiveness Analysis By Product Type
10. Global Ready-to-Drink Beverages Market Analysis 2017–2021 and Forecast 2022–2032, by Distribution Channel
10.1. Introduction / Key Findings
10.2. Historical Market Size (US$ Mn) and Volume Analysis By Distribution Channel, 2017–2021
10.3. Current and Future Market Size (US$ Mn) and Volume Analysis and Forecast By Distribution Channel, 2022–2032
10.3.1. Business to Business (Foodservice)
10.3.2. Business to Consumers
10.3.2.1. Supermarkets/Hypermarkets
10.3.2.2. Convenience Stores
10.3.2.3. Specialty Stores
10.3.2.4. Online Retail
10.3.2.5. Departmental Stores
10.3.2.6. Vending Machine
10.4. Market Attractiveness Analysis By Distribution Channel
11. Global Ready-to-Drink Beverages Market Analysis 2017–2021 and Forecast 2022–2032, by Region
11.1. Introduction
11.2. Historical Market Size (US$ Mn) and Volume Analysis By Region, 2017–2021
11.3. Current Market Size (US$ Mn) and Volume Analysis and Forecast By Region, 2022–2032
11.3.1. North America
11.3.2. Latin America
11.3.3. Europe
11.3.4. East Asia
11.3.5. South Asia
11.3.6. Oceania
11.3.7. Middle East and Africa (MEA)
11.4. Market Attractiveness Analysis By Region
12. North America Ready-to-Drink Beverages Market Analysis 2017–2021 and Forecast 2022–2032
12.1. Introduction
12.2. Historical Market Size (US$ Mn) and Volume Trend Analysis By Market Taxonomy, 2017–2021
12.3. Market Size (US$ Mn) and Volume Forecast By Market Taxonomy, 2022–2032
12.3.1. By Country
12.3.1.1. U.S.
12.3.1.2. Canada
12.3.2. By Product Type
12.3.3. By Distribution Channel
12.4. Market Attractiveness Analysis
12.4.1. By Country
12.4.2. By Product Type
12.4.3. By Distribution Channel
12.5. Drivers and Restraints - Impact Analysis
13. Latin America Ready-to-Drink Beverages Market Analysis 2017–2021 and Forecast 2022–2032
13.1. Introduction
13.2. Historical Market Size (US$ Mn) and Volume Trend Analysis By Market Taxonomy, 2017–2021
13.3. Market Size (US$ Mn) and Volume Forecast By Market Taxonomy, 2022–2032
13.3.1. By Country
13.3.1.1. Brazil
13.3.1.2. Mexico
13.3.1.3. Argentina
13.3.1.4. Rest of Latin America
13.3.2. By Product Type
13.3.3. By Distribution Channel
13.4. Market Attractiveness Analysis
13.4.1. By Country
13.4.2. By Product Type
13.4.3. By Distribution Channel
13.5. Drivers and Restraints - Impact Analysis
14. Europe Ready-to-Drink Beverages Market Analysis 2017–2021 and Forecast 2022–2032
14.1. Introduction
14.2. Historical Market Size (US$ Mn) and Volume Trend Analysis By Market Taxonomy, 2017–2021
14.3. Market Size (US$ Mn) and Volume Forecast By Market Taxonomy, 2022–2032
14.3.1. By Country
14.3.1.1. Germany
14.3.1.2. Italy
14.3.1.3. France
14.3.1.4. U.K.
14.3.1.5. Spain
14.3.1.6. BENELUX
14.3.1.7. Nordic
14.3.1.8. Russia
14.3.1.9. Poland
14.3.1.10. Rest of Europe
14.3.2. By Product Type
14.3.3. By Distribution Channel
14.4. Market Attractiveness Analysis
14.4.1. By Country
14.4.2. By Product Type
14.4.3. By Distribution Channel
14.5. Drivers and Restraints - Impact Analysis
15. South Asia Ready-to-Drink Beverages Market Analysis 2017–2021 and Forecast 2022–2032
15.1. Introduction
15.2. Historical Market Size (US$ Mn) and Volume Trend Analysis By Market Taxonomy, 2017–2021
15.3. Market Size (US$ Mn) and Volume Forecast By Market Taxonomy, 2022–2032
15.3.1. By Country
15.3.1.1. India
15.3.1.2. Thailand
15.3.1.3. Indonesia
15.3.1.4. Malaysia
15.3.1.5. Rest of South Asia
15.3.2. By Product Type
15.3.3. By Distribution Channel
15.4. Market Attractiveness Analysis
15.4.1. By Country
15.4.2. By Product Type
15.4.3. By Distribution Channel
15.5. Drivers and Restraints - Impact Analysis
16. East Asia Ready-to-Drink Beverages Market Analysis 2017–2021 and Forecast 2022–2032
16.1. Introduction
16.2. Historical Market Size (US$ Mn) and Volume Trend Analysis By Market Taxonomy, 2017–2021
16.3. Market Size (US$ Mn) and Volume Forecast By Market Taxonomy, 2022–2032
16.3.1. By Country
16.3.1.1. China
16.3.1.2. Japan
16.3.1.3. South Korea
16.3.2. By Product Type
16.3.3. By Distribution Channel
16.4. Market Attractiveness Analysis
16.4.1. By Country
16.4.2. By Product Type
16.4.3. By Distribution Channel
16.5. Drivers and Restraints - Impact Analysis
17. Oceania Ready-to-Drink Beverages Market Analysis 2017–2021 and Forecast 2022–2032
17.1. Introduction
17.2. Historical Market Size (US$ Mn) and Volume Trend Analysis By Market Taxonomy, 2017–2021
17.3. Market Size (US$ Mn) and Volume Forecast By Market Taxonomy, 2022–2032
17.3.1. By Country
17.3.1.1. Australia
17.3.1.2. New Zealand
17.3.2. By Product Type
17.3.3. By Distribution Channel
17.4. Market Attractiveness Analysis
17.4.1. By Country
17.4.2. By Product Type
17.4.3. By Distribution Channel
17.5. Drivers and Restraints - Impact Analysis
18. Middle East and Africa Ready-to-Drink Beverages Market Analysis 2017–2021 and Forecast 2022–2032
18.1. Introduction
18.2. Historical Market Size (US$ Mn) and Volume Trend Analysis By Market Taxonomy, 2017–2021
18.3. Market Size (US$ Mn) and Volume Forecast By Market Taxonomy, 2022–2032
18.3.1. By Country
18.3.1.1. GCC Countries
18.3.1.2. Turkey
18.3.1.3. South Africa
18.3.1.4. Rest of Middle East and Africa
18.3.2. By Product Type
18.3.3. By Distribution Channel
18.4. Market Attractiveness Analysis
18.4.1. By Country
18.4.2. By Product Type
18.4.3. By Distribution Channel
18.5. Drivers and Restraints - Impact Analysis
19. Country Wise Ready-to-Drink Beverages Market Analysis, 2021
19.1. U.S. Ready-to-Drink Beverages Market Analysis
19.1.1. By Product Type
19.1.2. By Distribution Channel
19.2. Canada Ready-to-Drink Beverages Market Analysis
19.2.1. By Product Type
19.2.2. By Distribution Channel
19.3. Mexico Ready-to-Drink Beverages Market Analysis
19.3.1. By Product Type
19.3.2. By Distribution Channel
19.4. Brazil Ready-to-Drink Beverages Market Analysis
19.4.1. By Product Type
19.4.2. By Distribution Channel
19.5. Argentina Ready-to-Drink Beverages Market Analysis
19.5.1. By Product Type
19.5.2. By Distribution Channel
19.6. Germany Ready-to-Drink Beverages Market Analysis
19.6.1. By Product Type
19.6.2. By Distribution Channel
19.7. Italy Ready-to-Drink Beverages Market Analysis
19.7.1. By Product Type
19.7.2. By Distribution Channel
19.8. France Ready-to-Drink Beverages Market Analysis
19.8.1. By Product Type
19.8.2. By Distribution Channel
19.9. U.K. Ready-to-Drink Beverages Market Analysis
19.9.1. By Product Type
19.9.2. By Distribution Channel
19.10. Spain Ready-to-Drink Beverages Market Analysis
19.10.1. By Product Type
19.10.2. By Distribution Channel
19.11. Poland Ready-to-Drink Beverages Market Analysis
19.11.1. By Product Type
19.11.2. By Distribution Channel
19.12. Russia Ready-to-Drink Beverages Market Analysis
19.12.1. By Product Type
19.12.2. By Distribution Channel
19.13. China Ready-to-Drink Beverages Market Analysis
19.13.1. By Product Type
19.13.2. By Distribution Channel
19.14. Japan Ready-to-Drink Beverages Market Analysis
19.14.1. By Product Type
19.14.2. By Distribution Channel
19.15. South Korea Ready-to-Drink Beverages Market Analysis
19.15.1. By Product Type
19.15.2. By Distribution Channel
19.16. India Ready-to-Drink Beverages Market Analysis
19.16.1. By Product Type
19.16.2. By Distribution Channel
19.17. Thailand Ready-to-Drink Beverages Market Analysis
19.17.1. By Product Type
19.17.2. By Distribution Channel
19.18. Indonesia Ready-to-Drink Beverages Market Analysis
19.18.1. By Product Type
19.18.2. By Distribution Channel
19.19. Malaysia Ready-to-Drink Beverages Market Analysis
19.19.1. By Product Type
19.19.2. By Distribution Channel
19.20. Australia Ready-to-Drink Beverages Market Analysis
19.20.1. By Product Type
19.20.2. By Distribution Channel
19.21. New Zealand Ready-to-Drink Beverages Market Analysis
19.21.1. By Product Type
19.21.2. By Distribution Channel
19.22. Turkey Ready-to-Drink Beverages Market Analysis
19.22.1. By Product Type
19.22.2. By Distribution Channel
19.23. South Africa Ready-to-Drink Beverages Market Analysis
19.23.1. By Product Type
19.23.2. By Distribution Channel
20. Market Structure Analysis
20.1. Market Analysis by Tier of Companies (Ready-to-Drink Beverages)
20.2. Market Share Analysis of Top Players
20.3. Market Presence Analysis
21. Competition Analysis
21.1. Competition Dashboard
21.2. Competition Benchmarking
21.3. Competition Deep Dive
21.3.1. Asahi Group Holdings, Ltd.
21.3.1.1. Overview
21.3.1.2. Product Portfolio
21.3.1.3. Profitability by Market Segments (Product/Channel/Region)
21.3.1.4. Sales Footprint
21.3.1.5. Strategy Overview
21.3.2. PepsiCo Inc.
21.3.2.1. Overview
21.3.2.2. Product Portfolio
21.3.2.3. Profitability by Market Segments (Product/Channel/Region)
21.3.2.4. Sales Footprint
21.3.2.5. Strategy Overview
21.3.3. The Coca-cola company
21.3.3.1. Overview
21.3.3.2. Product Portfolio
21.3.3.3. Profitability by Market Segments (Product/Channel/Region)
21.3.3.4. Sales Footprint
21.3.3.5. Strategy Overview
21.3.4. Nestlé S.A.
21.3.4.1. Overview
21.3.4.2. Product Portfolio
21.3.4.3. Profitability by Market Segments (Product/Channel/Region)
21.3.4.4. Sales Footprint
21.3.4.5. Strategy Overview
21.3.5. Kraft Heinz Foodservice
21.3.5.1. Overview
21.3.5.2. Product Portfolio
21.3.5.3. Profitability by Market Segments (Product/Channel/Region)
21.3.5.4. Sales Footprint
21.3.5.5. Strategy Overview
21.3.6. Suntory Holdings Limited
21.3.6.1. Overview
21.3.6.2. Product Portfolio
21.3.6.3. Profitability by Market Segments (Product/Channel/Region)
21.3.6.4. Sales Footprint
21.3.6.5. Strategy Overview
21.3.7. Gehl Foods, LLC
21.3.7.1. Overview
21.3.7.2. Product Portfolio
21.3.7.3. Profitability by Market Segments (Product/Channel/Region)
21.3.7.4. Sales Footprint
21.3.7.5. Strategy Overview
21.3.8. O-AT-KA Milk
21.3.8.1. Overview
21.3.8.2. Product Portfolio
21.3.8.3. Profitability by Market Segments (Product/Channel/Region)
21.3.8.4. Sales Footprint
21.3.8.5. Strategy Overview
21.3.9. William B. Reily and Company, Inc.
21.3.9.1. Overview
21.3.9.2. Product Portfolio
21.3.9.3. Profitability by Market Segments (Product/Channel/Region)
21.3.9.4. Sales Footprint
21.3.9.5. Strategy Overview
21.3.10. Danone S.A.
21.3.10.1. Overview
21.3.10.2. Product Portfolio
21.3.10.3. Profitability by Market Segments (Product/Channel/Region)
21.3.10.4. Sales Footprint
21.3.10.5. Strategy Overview
21.3.11. Keurig Dr Pepper Inc
21.3.11.1. Overview
21.3.11.2. Product Portfolio
21.3.11.3. Profitability by Market Segments (Product/Channel/Region)
21.3.11.4. Sales Footprint
21.3.11.5. Strategy Overview
21.3.12. Vitasoy International Holdings Limited
21.3.12.1. Overview
21.3.12.2. Product Portfolio
21.3.12.3. Profitability by Market Segments (Product/Channel/Region)
21.3.12.4. Sales Footprint
21.3.12.5. Strategy Overview
21.3.13. Mutalo Group
21.3.13.1. Overview
21.3.13.2. Product Portfolio
21.3.13.3. Profitability by Market Segments (Product/Channel/Region)
21.3.13.4. Sales Footprint
21.3.13.5. Strategy Overview
21.3.14. The campbell Soup Company
21.3.14.1. Overview
21.3.14.2. Product Portfolio
21.3.14.3. Profitability by Market Segments (Product/Channel/Region)
21.3.14.4. Sales Footprint
21.3.14.5. Strategy Overview
21.3.15. Gujarat Cooperative Milk Marketing Federation (GCMMF) - Amul
21.3.15.1. Overview
21.3.15.2. Product Portfolio
21.3.15.3. Profitability by Market Segments (Product/Channel/Region)
21.3.15.4. Sales Footprint
21.3.15.5. Strategy Overview
22. Assumptions and Acronyms Used
23. Research Methodology
List of Tables:
Table 01: Global Ready-to-Drink Beverages Market Value (US$ Mn) Analysis and Forecast by Product Type, 2017-2032
Table 02: Global Ready-to-Drink Beverages Market Volume (liters) Analysis and Forecast by Product Type, 2017-2032
Table 03: Global Ready-to-Drink Beverages Market Value (US$ Mn) Analysis and Forecast by Distribution Channel, 2017-2032
Table 04: Global Ready-to-Drink Beverages Market Volume (liters) Analysis and Forecast by Distribution Channel, 2017-2032
Table 05: Global Ready-to-Drink Beverages Market Value (US$ Mn) Analysis and Forecast by Business to Consumer, 2017-2032
Table 06: Global Ready-to-Drink Beverages Market Volume (liters) Analysis and Forecast by Business to Consumer, 2017-2032
Table 07: Global Ready-to-Drink Beverages Market Value (US$ Mn) Analysis and Forecast by Region, 2017-2032
Table 08: Global Ready-to-Drink Beverages Market Volume (liters) Analysis and Forecast by Region, 2017-2032
Table 09: North America Ready-to-Drink Beverages Market Value (US$ Mn) Analysis and Forecast by Product Type, 2017-2032
Table 10: North America Ready-to-Drink Beverages Market Volume (liters) Analysis and Forecast by Product Type, 2017-2032
Table 11: North America Ready-to-Drink Beverages Market Value (US$ Mn) Analysis and Forecast by Distribution Channel, 2017-2032
Table 12: North America Ready-to-Drink Beverages Market Volume (liters) Analysis and Forecast by Distribution Channel, 2017-2032
Table 13: North America Ready-to-Drink Beverages Market Value (US$ Mn) Analysis and Forecast by Distribution Channel, 2017-2032
Table 14: North America Ready-to-Drink Beverages Market Volume (liters) Analysis and Forecast by Distribution Channel, 2017-2032
Table 15: North America Ready-to-Drink Beverages Market Value (US$ US$ Mn) Analysis and Forecast by Country, 2017-2032
Table 16: North America Ready-to-Drink Beverages Market Volume (liters) Analysis and Forecast by Country, 2017-2032
Table 17: Latin America Ready-to-Drink Beverages Market Value (US$ Mn) Analysis and Forecast by Product Type, 2017-2032
Table 18: Latin America Ready-to-Drink Beverages Market Volume (liters) Analysis and Forecast by Product Type, 2017-2032
Table 19: Latin America Ready-to-Drink Beverages Market Value (US$ Mn) Analysis and Forecast by Distribution Channel, 2017-2032
Table 20: Latin America Ready-to-Drink Beverages Market Volume (liters) Analysis and Forecast by Distribution Channel, 2017-2032
Table 21: Latin America Ready-to-Drink Beverages Market Value (US$ Mn) Analysis and Forecast by Distribution Channel, 2017-2032
Table 22: Latin America Ready-to-Drink Beverages Market Volume (liters) Analysis and Forecast by Distribution Channel, 2017-2032
Table 23: Latin America Ready-to-Drink Beverages Market Value (US$ US$ Mn) Analysis and Forecast by Country, 2017-2032
Table 24: Latin America Ready-to-Drink Beverages Market Volume (liters) Analysis and Forecast by Country, 2017-2032
Table 25: Europe Ready-to-Drink Beverages Market Value (US$ Mn) Analysis and Forecast by Product Type, 2017-2032
Table 26: Europe Ready-to-Drink Beverages Market Volume (liters) Analysis and Forecast by Product Type, 2017-2032
Table 27: Europe Ready-to-Drink Beverages Market Value (US$ Mn) Analysis and Forecast by Distribution Channel, 2017-2032
Table 28: Europe Ready-to-Drink Beverages Market Volume (liters) Analysis and Forecast by Distribution Channel, 2017-2032
Table 29: Europe Ready-to-Drink Beverages Market Value (US$ Mn) Analysis and Forecast by Distribution Channel, 2017-2032
Table 30: Europe Ready-to-Drink Beverages Market Volume (liters) Analysis and Forecast by Distribution Channel, 2017-2032
Table 31: Europe Ready-to-Drink Beverages Market Value (US$ US$ Mn) Analysis and Forecast by Country, 2017-2032
Table 32: Europe Ready-to-Drink Beverages Market Volume (liters) Analysis and Forecast by Country, 2017-2032
Table 33: South Asia Ready-to-Drink Beverages Market Value (US$ Mn) Analysis and Forecast by Product Type, 2017-2032
Table 34: South Asia Ready-to-Drink Beverages Market Volume (liters) Analysis and Forecast by Product Type, 2017-2032
Table 35: South Asia Ready-to-Drink Beverages Market Value (US$ Mn) Analysis and Forecast by Distribution Channel, 2017-2032
Table 36: South Asia Ready-to-Drink Beverages Market Volume (liters) Analysis and Forecast by Distribution Channel, 2017-2032
Table 37: South Asia Ready-to-Drink Beverages Market Value (US$ Mn) Analysis and Forecast by Distribution Channel, 2017-2032
Table 38: South Asia Ready-to-Drink Beverages Market Volume (liters) Analysis and Forecast by Distribution Channel, 2017-2032
Table 39: South Asia Ready-to-Drink Beverages Market Value (US$ US$ Mn) Analysis and Forecast by Country, 2017-2032
Table 40: South Asia Ready-to-Drink Beverages Market Volume (liters) Analysis and Forecast by Country, 2017-2032
Table 41: East Asia Ready-to-Drink Beverages Market Value (US$ Mn) Analysis and Forecast by Product Type, 2017-2032
Table 42: East Asia Ready-to-Drink Beverages Market Volume (liters) Analysis and Forecast by Product Type, 2017-2032
Table 43: East Asia Ready-to-Drink Beverages Market Value (US$ Mn) Analysis and Forecast by Distribution Channel, 2017-2032
Table 44: East Asia Ready-to-Drink Beverages Market Volume (liters) Analysis and Forecast by Distribution Channel, 2017-2032
Table 45: East Asia Ready-to-Drink Beverages Market Value (US$ Mn) Analysis and Forecast by Distribution Channel, 2017-2032
Table 46: East Asia Ready-to-Drink Beverages Market Volume (liters) Analysis and Forecast by Distribution Channel, 2017-2032
Table 47: East Asia Ready-to-Drink Beverages Market Value (US$ US$ Mn) Analysis and Forecast by Country, 2017-2032
Table 48: East Asia Ready-to-Drink Beverages Market Volume (liters) Analysis and Forecast by Country, 2017-2032
Table 49: Oceania Ready-to-Drink Beverages Market Value (US$ Mn) Analysis and Forecast by Product Type, 2017-2032
Table 50: Oceania Ready-to-Drink Beverages Market Volume (liters) Analysis and Forecast by Product Type, 2017-2032
Table 51: Oceania Ready-to-Drink Beverages Market Value (US$ Mn) Analysis and Forecast by Distribution Channel, 2017-2032
Table 52: Oceania Ready-to-Drink Beverages Market Volume (liters) Analysis and Forecast by Distribution Channel, 2017-2032
Table 53: Oceania Ready-to-Drink Beverages Market Value (US$ Mn) Analysis and Forecast by Distribution Channel, 2017-2032
Table 54: Oceania Ready-to-Drink Beverages Market Volume (liters) Analysis and Forecast by Distribution Channel, 2017-2032
Table 55: Oceania Ready-to-Drink Beverages Market Value (US$ US$ Mn) Analysis and Forecast by Country, 2017-2032
Table 56: Oceania Ready-to-Drink Beverages Market Volume (liters) Analysis and Forecast by Country, 2017-2032
Table 57: Middle East & Africa Ready-to-Drink Beverages Market Value (US$ Mn) Analysis and Forecast by Product Type, 2017-2032
Table 58: Middle East & Africa Ready-to-Drink Beverages Market Volume (liters) Analysis and Forecast by Product Type, 2017-2032
Table 59: Middle East & Africa Ready-to-Drink Beverages Market Value (US$ Mn) Analysis and Forecast by Distribution Channel, 2017-2032
Table 60: Middle East & Africa Ready-to-Drink Beverages Market Volume (liters) Analysis and Forecast by Distribution Channel, 2017-2032
Table 61: Middle East & Africa Ready-to-Drink Beverages Market Value (US$ Mn) Analysis and Forecast by Distribution Channel, 2017-2032
Table 62: Middle East & Africa Ready-to-Drink Beverages Market Volume (liters) Analysis and Forecast by Distribution Channel, 2017-2032
Table 63: Middle East & Africa Ready-to-Drink Beverages Market Value (US$ US$ Mn) Analysis and Forecast by Country, 2017-2032
Table 64: Middle East & Africa Ready-to-Drink Beverages Market Volume (liters) Analysis and Forecast by Country, 2017-2032
Table 65: U.S. Ready-to-Drink Beverages Market Value (US$ Mn) & Volume (liters) Analysis by Product Type, 2021
Table 66: U.S. Ready-to-Drink Beverages Market Value (US$ Mn) & Volume (liters) Analysis by Distribution Channel, 2021
Table 67: Canada Ready-to-Drink Beverages Market Value (US$ Mn) & Volume (liters) Analysis by Product Type, 2021
Table 68: Canada Ready-to-Drink Beverages Market Value (US$ Mn) & Volume (liters) Analysis by Distribution Channel, 2021
Table 69: Brazil Ready-to-Drink Beverages Market Value (US$ Mn) & Volume (liters) Analysis by Product Type, 2021
Table 70: Brazil Ready-to-Drink Beverages Market Value (US$ Mn) & Volume (liters) Analysis by Distribution Channel, 2021
Table 71: Mexico Ready-to-Drink Beverages Market Value (US$ Mn) & Volume (liters) Analysis by Product Type, 2021
Table 72: Mexico Ready-to-Drink Beverages Market Value (US$ Mn) & Volume (liters) Analysis by Distribution Channel, 2021
Table 73: Argentina Ready-to-Drink Beverages Market Value (US$ Mn) & Volume (liters) Analysis by Product Type, 2021
Table 74: Argentina Ready-to-Drink Beverages Market Value (US$ Mn) & Volume (liters) Analysis by Distribution Channel, 2021
Table 75: Germany Ready-to-Drink Beverages Market Value (US$ Mn) & Volume (liters) Analysis by Product Type, 2021
Table 76: Germany Ready-to-Drink Beverages Market Value (US$ Mn) & Volume (liters) Analysis by Distribution Channel, 2021
Table 77: Italy Ready-to-Drink Beverages Market Value (US$ Mn) & Volume (liters) Analysis by Product Type, 2021
Table 78: Italy Ready-to-Drink Beverages Market Value (US$ Mn) & Volume (liters) Analysis by Distribution Channel, 2021
Table 79: France Ready-to-Drink Beverages Market Value (US$ Mn) & Volume (liters) Analysis by Product Type, 2021
Table 80: France Ready-to-Drink Beverages Market Value (US$ Mn) & Volume (liters) Analysis by Distribution Channel, 2021
Table 81: U.K. Ready-to-Drink Beverages Market Value (US$ Mn) & Volume (liters) Analysis by Product Type, 2021
Table 82: U.K. Ready-to-Drink Beverages Market Value (US$ Mn) & Volume (liters) Analysis by Distribution Channel, 2021
Table 83: Spain Ready-to-Drink Beverages Market Value (US$ Mn) & Volume (liters) Analysis by Product Type, 2021
Table 84: Spain Ready-to-Drink Beverages Market Value (US$ Mn) & Volume (liters) Analysis by Distribution Channel, 2021
Table 85: Russia Ready-to-Drink Beverages Market Value (US$ Mn) & Volume (liters) Analysis by Product Type, 2021
Table 86: Russia Ready-to-Drink Beverages Market Value (US$ Mn) & Volume (liters) Analysis by Distribution Channel, 2021
Table 87: Poland Ready-to-Drink Beverages Market Value (US$ Mn) & Volume (liters) Analysis by Product Type, 2021
Table 88: Poland Ready-to-Drink Beverages Market Value (US$ Mn) & Volume (liters) Analysis by Distribution Channel, 2021
Table 89: India Ready-to-Drink Beverages Market Value (US$ Mn) & Volume (liters) Analysis by Product Type, 2021
Table 90: India Ready-to-Drink Beverages Market Value (US$ Mn) & Volume (liters) Analysis by Distribution Channel, 2021
Table 91: Thailand Ready-to-Drink Beverages Market Value (US$ Mn) & Volume (liters) Analysis by Product Type, 2021
Table 92: Thailand Ready-to-Drink Beverages Market Value (US$ Mn) & Volume (liters) Analysis by Distribution Channel, 2021
Table 93: Indonesia Ready-to-Drink Beverages Market Value (US$ Mn) & Volume (liters) Analysis by Product Type, 2021
Table 94: Indonesia Ready-to-Drink Beverages Market Value (US$ Mn) & Volume (liters) Analysis by Distribution Channel, 2021
Table 95: Malaysia Ready-to-Drink Beverages Market Value (US$ Mn) & Volume (liters) Analysis by Product Type, 2021
Table 96: Malaysia Ready-to-Drink Beverages Market Value (US$ Mn) & Volume (liters) Analysis by Distribution Channel, 2021
Table 97: China Ready-to-Drink Beverages Market Value (US$ Mn) & Volume (liters) Analysis by Product Type, 2021
Table 98: China Ready-to-Drink Beverages Market Value (US$ Mn) & Volume (liters) Analysis by Distribution Channel, 2021
Table 99: Japan Ready-to-Drink Beverages Market Value (US$ Mn) & Volume (liters) Analysis by Product Type, 2021
Table 100: Japan Ready-to-Drink Beverages Market Value (US$ Mn) & Volume (liters) Analysis by Distribution Channel, 2021
Table 101: South Korea Ready-to-Drink Beverages Market Value (US$ Mn) & Volume (liters) Analysis by Product Type, 2021
Table 102: South Korea Ready-to-Drink Beverages Market Value (US$ Mn) & Volume (liters) Analysis by Distribution Channel, 2021
Table 103: Australia Ready-to-Drink Beverages Market Value (US$ Mn) & Volume (liters) Analysis by Product Type, 2021
Table 104: Australia Ready-to-Drink Beverages Market Value (US$ Mn) & Volume (liters) Analysis by Distribution Channel, 2021
Table 105: New Zealand Ready-to-Drink Beverages Market Value (US$ Mn) & Volume (liters) Analysis by Product Type, 2021
Table 106: New Zealand Ready-to-Drink Beverages Market Value (US$ Mn) & Volume (liters) Analysis by Distribution Channel, 2021
Table 107: Turkey Ready-to-Drink Beverages Market Value (US$ Mn) & Volume (liters) Analysis by Product Type, 2021
Table 108: Turkey Ready-to-Drink Beverages Market Value (US$ Mn) & Volume (liters) Analysis by Distribution Channel, 2021
Table 109: South Africa Ready-to-Drink Beverages Market Value (US$ Mn) & Volume (liters) Analysis by Product Type, 2021
Table 110: South Africa Ready-to-Drink Beverages Market Value (US$ Mn) & Volume (liters) Analysis by Distribution Channel, 2021
List of Figures:
Figure 01: Global Ready-to-Drink Beverages Market Value (US$ Mn) Forecast, 2022–2032
Figure 02: Global Ready-to-Drink Beverages Market Volume (liters) Forecast, 2022–2032
Figure 03: Global Ready-to-Drink Beverages Market Value Share Analysis by Product Type, 2022 E
Figure 04: Global Ready-to-Drink Beverages Market Y-o-Y Growth Rate by Product Type, 2022-2032
Figure 05: Global Ready-to-Drink Beverages Market Value (US$ Mn) Analysis & Forecast by Product Type, 2022–2032
Figure 06: Global Ready-to-Drink Beverages Market Volume (liters) Analysis & Forecast by Product Type, 2022–2032
Figure 07: Global Ready-to-Drink Beverages Market Value Share Analysis by Distribution Channel, 2021 E
Figure 08: Global Ready-to-Drink Beverages Market Y-o-Y Growth Rate by Distribution Channel, 2022-2032
Figure 09: Global Ready-to-Drink Beverages Market Value (US$ Mn) Analysis & Forecast by Distribution Channel, 2022-2032
Figure 10: Global Ready-to-Drink Beverages Market Volume (liters) Analysis & Forecast by Distribution Channel, 2022-2032
Figure 11: Global Ready-to-Drink Beverages Market Value Share Analysis by Region, 2021 E
Figure 12: Global Ready-to-Drink Beverages Market Y-o-Y Growth Rate by Region, 2022-2032
Figure 13: Global Ready-to-Drink Beverages Market Value (US$ Mn) Analysis & Forecast by Region, 2022-2032
Figure 14: Global Ready-to-Drink Beverages Market Volume (liters) Analysis & Forecast by Region, 2022-2032
Figure 15: Global Ready-to-Drink Beverages Market Attractiveness Analysis by Region, 2022-2032
Figure 16: Global Ready-to-Drink Beverages Market Attractiveness Analysis by Product Type, 2022-2032
Figure 17: Global Ready-to-Drink Beverages Market Attractiveness Analysis by Distribution Channel, 2022-2032
Figure 18: North America Ready-to-Drink Beverages Market Value (US$ Mn) Analysis & Forecast by Product Type, 2022-2032
Figure 19: North America Ready-to-Drink Beverages Market Volume (liters) Analysis & Forecast by Product Type, 2022-2032
Figure 20: North America Ready-to-Drink Beverages Market Value (US$ Mn) Analysis & Forecast by Distribution Channel, 2022-2032
Figure 21: North America Ready-to-Drink Beverages Market Volume (liters) Analysis & Forecast by Distribution Channel, 2022-2032
Figure 22: North America Ready-to-Drink Beverages Market Value (US$ Mn) Analysis & Forecast by Country, 2022-2032
Figure 23: North America Ready-to-Drink Beverages Market Volume (liters) Analysis & Forecast by Country, 2022-2032
Figure 24: North America Ready-to-Drink Beverages Market Attractiveness Analysis by Region, 2022-2032
Figure 25: North America Ready-to-Drink Beverages Market Attractiveness Analysis by Product Type, 2022-2032
Figure 26: North America Ready-to-Drink Beverages Market Attractiveness Analysis by Distribution Channel, 2022-2032
Figure 27: Latin America Ready-to-Drink Beverages Market Value (US$ Mn) Analysis & Forecast by Product Type, 2022-2032
Figure 28: Latin America Ready-to-Drink Beverages Market Volume (liters) Analysis & Forecast by Product Type, 2022-2032
Figure 29: Latin America Ready-to-Drink Beverages Market Value (US$ Mn) Analysis & Forecast by Distribution Channel, 2022-2032
Figure 30: Latin America Ready-to-Drink Beverages Market Volume (liters) Analysis & Forecast by Distribution Channel, 2022-2032
Figure 31: Latin America Ready-to-Drink Beverages Market Value (US$ Mn) Analysis & Forecast by Country, 2022-2032
Figure 32: Latin America Ready-to-Drink Beverages Market Volume (liters) Analysis & Forecast by Country, 2022-2032
Figure 33: Latin America Ready-to-Drink Beverages Market Attractiveness Analysis by Country, 2022-2032
Figure 34: Latin America Ready-to-Drink Beverages Market Attractiveness Analysis by Product Type, 2022-2032
Figure 35: Latin America Ready-to-Drink Beverages Market Attractiveness Analysis by Distribution Channel, 2022-2032
Figure 36: Europe Ready-to-Drink Beverages Market Value (US$ Mn) Analysis & Forecast by Product Type, 2022-2032
Figure 37: Europe Ready-to-Drink Beverages Market Volume (liters) Analysis & Forecast by Product Type, 2022-2032
Figure 38: Europe Ready-to-Drink Beverages Market Value (US$ Mn) Analysis & Forecast by Distribution Channel, 2022-2032
Figure 39: Europe Ready-to-Drink Beverages Market Volume (liters) Analysis & Forecast by Distribution Channel, 2022-2032
Figure 40: Europe Ready-to-Drink Beverages Market Value (US$ Mn) Analysis & Forecast by Country, 2022-2032
Figure 41: Europe Ready-to-Drink Beverages Market Volume (liters) Analysis & Forecast by Country, 2022-2032
Figure 42: Europe Ready-to-Drink Beverages Market Attractiveness Analysis by Country, 2022-2032
Figure 43: Europe Ready-to-Drink Beverages Market Attractiveness Analysis by Product Type, 2022-2032
Figure 44: Europe Ready-to-Drink Beverages Market Attractiveness Analysis by Distribution Channel, 2022-2032
Figure 45: South Asia Ready-to-Drink Beverages Market Value (US$ Mn) Analysis & Forecast by Product Type, 2022-2032
Figure 46: South Asia Ready-to-Drink Beverages Market Volume (liters) Analysis & Forecast by Product Type, 2022-2032
Figure 47: South Asia Ready-to-Drink Beverages Market Value (US$ Mn) Analysis & Forecast by Distribution Channel, 2022-2032
Figure 48: South Asia Ready-to-Drink Beverages Market Volume (liters) Analysis & Forecast by Distribution Channel, 2022-2032
Figure 49: South Asia Ready-to-Drink Beverages Market Value (US$ Mn) Analysis & Forecast by Country, 2022-2032
Figure 50: South Asia Ready-to-Drink Beverages Market Volume (liters) Analysis & Forecast by Country, 2022-2032
Figure 51: South Asia Ready-to-Drink Beverages Market Attractiveness Analysis by Country, 2022-2032
Figure 52: South Asia Ready-to-Drink Beverages Market Attractiveness Analysis by Product Type, 2022-2032
Figure 53: South Asia Ready-to-Drink Beverages Market Attractiveness Analysis by Distribution Channel, 2022-2032
Figure 54: East Asia Ready-to-Drink Beverages Market Value (US$ Mn) Analysis & Forecast by Product Type, 2022-2032
Figure 55: East Asia Ready-to-Drink Beverages Market Volume (liters) Analysis & Forecast by Product Type, 2022-2032
Figure 56: East Asia Ready-to-Drink Beverages Market Value (US$ Mn) Analysis & Forecast by Distribution Channel, 2022-2032
Figure 57: East Asia Ready-to-Drink Beverages Market Volume (liters) Analysis & Forecast by Distribution Channel, 2022-2032
Figure 58: East Asia Ready-to-Drink Beverages Market Value (US$ Mn) Analysis & Forecast by Country, 2022-2032
Figure 59: East Asia Ready-to-Drink Beverages Market Volume (liters) Analysis & Forecast by Country, 2022-2032
Figure 60: East Asia Ready-to-Drink Beverages Market Attractiveness Analysis by Country, 2022-2032
Figure 61: East Asia Ready-to-Drink Beverages Market Attractiveness Analysis by Product Type, 2022-2032
Figure 62: East Asia Ready-to-Drink Beverages Market Attractiveness Analysis by Distribution Channel, 2022-2032
Figure 63: Oceania Ready-to-Drink Beverages Market Value (US$ Mn) Analysis & Forecast by Product Type, 2022-2032
Figure 64: Oceania Ready-to-Drink Beverages Market Volume (liters) Analysis & Forecast by Product Type, 2022-2032
Figure 65: Oceania Ready-to-Drink Beverages Market Value (US$ Mn) Analysis & Forecast by Distribution Channel, 2022-2032
Figure 66: Oceania Ready-to-Drink Beverages Market Volume (liters) Analysis & Forecast by Distribution Channel, 2022-2032
Figure 67: Oceania Ready-to-Drink Beverages Market Value (US$ Mn) Analysis & Forecast by Country, 2022-2032
Figure 68: Oceania Ready-to-Drink Beverages Market Volume (liters) Analysis & Forecast by Country, 2022-2032
Figure 69: Oceania Ready-to-Drink Beverages Market Attractiveness Analysis by Country, 2022-2032
Figure 70: Oceania Ready-to-Drink Beverages Market Attractiveness Analysis by Product Type, 2022-2032
Figure 71: Oceania Ready-to-Drink Beverages Market Attractiveness Analysis by Distribution Channel, 2022-2032
Figure 72: Middle East & Africa Ready-to-Drink Beverages Market Value (US$ Mn) Analysis & Forecast by Product Type, 2022-2032
Figure 73: Middle East & Africa Ready-to-Drink Beverages Market Volume (liters) Analysis & Forecast by Product Type, 2022-2032
Figure 74: Middle East & Africa Ready-to-Drink Beverages Market Value (US$ Mn) Analysis & Forecast by Distribution Channel, 2022-2032
Figure 75: Middle East & Africa Ready-to-Drink Beverages Market Volume (liters) Analysis & Forecast by Distribution Channel, 2022-2032
Figure 76: Middle East & Africa Ready-to-Drink Beverages Market Value (US$ Mn) Analysis & Forecast by Country, 2022-2032
Figure 77: Middle East & Africa Ready-to-Drink Beverages Market Volume (liters) Analysis & Forecast by Country, 2022-2032
Figure 78: Middle East & Africa Ready-to-Drink Beverages Market Attractiveness Analysis by Country, 2022-2032
Figure 79: Middle East & Africa Ready-to-Drink Beverages Market Attractiveness Analysis by Product Type, 2022-2032
Figure 80: Middle East & Africa Ready-to-Drink Beverages Market Attractiveness Analysis by Distribution Channel, 2022-2032
Copyright © Transparency Market Research, Inc. All Rights reserved
Trust Online

Ready-to-Drink Beverages Market