
Reports
Reports
Analysts’ Viewpoint on Global Pulp Market Scenario
The global pulp market is estimated to be driven by rising application of pulp in the packaging of food and beverage, personal care, pharmaceutical, and other products. Leading players in the global pulp market are investing heavily to advance their production technologies and increase their production capacities to meet the growing demand for pulp. They are also focusing on the diversification of their product portfolio to improve global presence. The increasing demand for paper packaging products from the food & beverage industry is projected to be the key growth driver for the pulp market. Moreover, the growing trend of sustainability among the packaging manufacturers is expected to further drive the global pulp market.
The global pulp market is expected to grow, owing to the rising demand for eco-friendly packaging products from end users and developments in the recycling infrastructure in the pulp industry. Moreover, growing anti-plastic sentiments and government initiatives to curb single-use plastics are likely to fuel the demand for pulp-based packaging products in the near future, thereby driving the global pulp market.
The pulp market is anticipated to create an incremental opportunity of US$ 57.1 Bn by 2030, growing at a CAGR of 3.7% between 2022 and 2030. The consumer inclination toward pulp-based products is increasing due to the eco-friendly characteristics of the pulp material. This has created a positive impact on the global demand for pulp-based packaging products. Moreover, the demand for sustainable packaging formats such as “Green Packaging” across the value chain is likely to augment the demand for pulp-based packaging products over the next few years.
Packaging manufacturers across the globe are shifting toward pulp-based packaging, while achieving their sustainability objectives. Packaging experts and consumer product companies are focusing on green packaging formats, as these are biodegradable and help reduce carbon footprint. The ongoing initiatives by government authorities and pulp & paper industries for sustainability are likely to further accelerate the pulp market.
The burgeoning retail sector across the globe is expected to boost the demand for sustainable pulp-based packaging formats in the upcoming years. Sustainable pulp-based packaging maintains the shelf life of the product, while reducing the negative impact of plastic packaging on the environment. Thus, environmental concerns have compelled manufacturers to move toward pulp and paper packaging. This is the main reason for the growing demand for pulp in the past few years.
Although digital marketing turns out to be the cost-effective promotional strategy, print magazines or newspaper ads give more exposure to the brand compared to online advertising. Printed advertisements also increase the brand's favorability and purchase intent toward the product. Printed media is easily re-readable and gives a visual appearance, which increase trust for the content/product. Most of the respondents prefer print media to be tactile and more genuine. All these factors are contributing to the escalating growth of the pulp market.
There have been continuous efforts to reduce or eliminate the usage of plastics in packaging. The anti-plastic sentiment is advantageous to pulp and paper manufacturers, as it encourages the use of biodegradable alternatives. This is being driven by the increasing government initiatives against single-use ban on plastics and the rising awareness among consumers regarding environmental conservation. Moreover, the commitment by consumers to find eco-friendly packaging formats is also one of the factors driving the demand for pulp. The harm caused by plastics to the environment results in tremendous opportunities in the pulp industry. Overall, the growing anti-plastic sentiments among consumers are likely to create significant revenue opportunities for pulp manufacturers during the forecast period.
Chemical pulping accounts for more than ¾ of the pulp market and is estimated to witness growth of 1.5x its current market value by the end of the forecast period. The upsurge in the consumption of high-quality white paper and other quality paper products leads to the increased demand for chemical pulp in the market. Furthermore, the rise in the consumption of paper in the institutional and corporate sectors as well as the increase in application of packaging paper in the food & beverage, pharmaceutical, and personal care industries are factors driving the demand for chemical pulping.
Pulp is used for a diverse range of purposes, making it an integral part of our daily lives. However, the pulp industry is listed as one of the key contributors to pollution. This is partly due to the high consumption of water, which is at the epicentre of the pulp and paper manufacturing process. Thus, there is a need for efficient utilization of pulp to reduce the harmful effects on the environment. The use of recycled paper results in responsible pulp consumption practices. The recycling process reduces the negative impact on the environment, as the sludge produced is repeatedly tested for toxicity. The global push for the use of sustainable materials is expected to aid in the demand for recycled pulp.
The global outbreak of COVID-19 had a negative impact on the pulp market. Key players in the global pulp market have suffered losses amid the pandemic due to supply-chain disruptions, raw material unavailability, and halts in production activities across manufacturing facilities. The demand for pulp is generated mainly by the packaging industry, but amid the pandemic, the demand for packaging products witnessed a decline as people became more aware of spending on essential items only.
The pulp market has witnessed a considerable downfall, mainly due to the decline in the demand for packaging from the food & beverage industry. The increasing awareness among consumers about sustainable packaging is expected to accelerate the demand for pulp. Moreover, the rise in demand for paper and paperboard packaging from end-use industries is likely to augment the growth of the pulp market. As the economy commences its recovery from the pandemic, the pulp market is projected to have a positive outlook in the next few years.
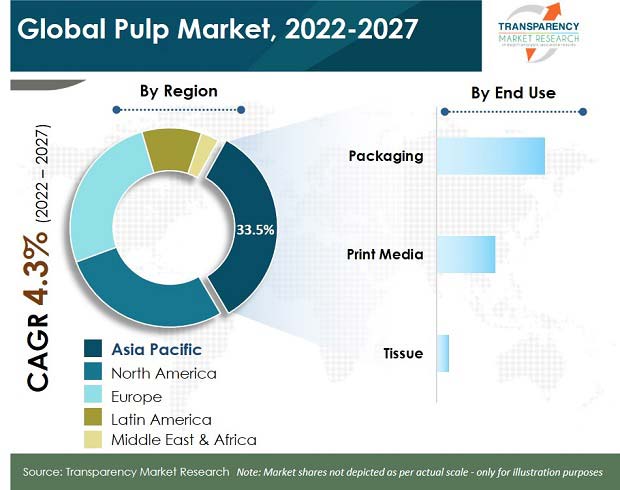
Packaging as an end user holds more than half of the total market share by value and is expected to create the highest incremental opportunity of US$ 22.2 Bn by the end of 2030. Increasing demand for paper-based packaging from the food & beverage, personal care, and pharmaceutical industries is allowing the pulp market to gain impetus over the past few years. Additionally, the increasing consumer shift from plastic packaging to sustainable and eco-friendly packaging is likely to augment the demand for pulp during the forecast period.
The Asia Pacific is expected to remain the dominant region, and the market in the region is projected to grow 1.5x its current market value by 2030. This region is anticipated to represent the highest CAGR of 5.2% over the forecast period. Emerging and developing countries in this region are responsible for shaping the growth of the market.
The increasing consumption of pulp-based products such as tissues, magazines and other paper-based packaging is driving the market in this region. Furthermore, the growing penetration of modern retail formats plays a significant role in fuelling the Asia Pacific pulp market growth.
China is expected to create lucrative opportunities for the manufacturers of pulp. The pulp market in China is estimated to create the highest incremental opportunity of US$ 13.5 Bn by 2030. China holds almost 41.3% of the product market by value. The growth of this market in China can be largely attributed to the huge population base, rapid urbanization rate, and growing penetration of the retail sector. Moreover, rising awareness among end users regarding environmental concerns and favorable government policies are driving the growth of the pulp market in the country.
North America is expected to witness moderate growth during the forecast period. The ongoing efforts by governments in the region against the single-use ban on plastics and the rising preference of consumers for sustainable packaging solutions are driving the pulp market growth in this region.
The global pulp market is highly competitive due to the presence of a large number of regional and local players. Moreover, they are focusing on inorganic growth strategies such as mergers and acquisitions to increase their business reach. The pulp market report concludes with the company profiles section, which includes significant information about key players operating in the global pulp market. Leading players analyzed in the report include Domtar Corporation, International Paper, Stora Enso, UPM Global, WestRock Company, Georgia-Pacific, Mondi plc, Nippon Paper Industries co., ltd., Oji Holdings Corporation, Sappi Global and other prominent players.
Each of these players has been profiled in the pulp market report based on parameters such as company overview, financial overview, business strategies, application portfolio, business segments, and recent developments.
There is an upsurge in investments to acquire mills, and expand and restructure production units by global manufacturers of pulp.
|
Attribute |
Detail |
|
Market Size Value in 2021 |
US$ 146.7 Bn |
|
Market Forecast Value in 2030 |
US$ 203.8 Bn |
|
Growth Rate (CAGR) |
3.7% from Year-to-Year |
|
Forecast Period |
2022–2030 |
|
Quantitative Units |
US$ Mn for Value |
|
Market Analysis |
It includes cross segment analysis at global as well as regional level. Moreover, qualitative analysis includes drivers, restraints, opportunities, key trends, and parent industry overview. |
|
Competition Landscape |
|
|
Format |
Electronic (PDF) + Excel |
|
Market Segmentation |
|
|
Regions Covered |
|
|
Countries Covered |
|
|
Companies Profiled |
|
|
Customization Scope |
Available upon request |
|
Pricing |
Available upon request |
The pulp market was valued at US$ 146.7 Bn in 2021 and is expected to reach US$ 203.8 Bn by 2030.
The pulp market is expected to grow at a CAGR of 3.7% during the forecast period.
Increased consumer preference for sustainable and green packaging products, and recycling reforms in the pulp industry are projected to drive the global pulp market.
Chemical grade of pulp is preferred the most in the global pulp market.
The pulp market in the Asia Pacific is likely to grow at the fastest CAGR of 5.2% during the forecast period.
The packaging end use segment is likely to generate the highest revenue in 2030.
Top three countries contribute around approximately 40% to the total global pulp market.
Georgia-Pacific, WestRock Company, Mondi plc, International Paper, and Stora Enso are the prominent players in the global market.
1. Executive Summary
1.1. Market Overview
1.2. Market Analysis
1.3. TMR Analysis and Recommendations
2. Market Viewpoint
2.1. Market Definition
2.2. Market Taxonomy
3. Pulp Market Overview
3.1. Introduction
3.2. Global Pulp Market Overview
3.3. Value Chain Analysis
3.3.1. Exhaustive List of Active Participants
3.3.1.1. Raw Material Suppliers
3.3.1.2. Pulp Manufacturers
3.3.1.3. End Users
3.3.2. Profitability Margins
3.4. Macro-economic Factors – Correlation Analysis
3.5. Forecast Factors – Relevance & Impact
4. Impact of COVID-19
4.1. Current Statistics and Probable Future Impact
4.2. Impact of COVID-19 on Target Market
5. Pulp Market Analysis
5.1. Pricing Analysis
5.1.1. Pricing Assumption
5.1.2. Price Projections By Region
5.2. Market Size (US$ Mn) and Forecast
5.2.1. Market Size and Y-o-Y Growth
5.2.2. Absolute $ Opportunity
6. Pulp Market Dynamics
6.1. Drivers
6.2. Restraints
6.3. Opportunity Analysis
6.4. Trends
7. Global Pulp Market Analysis and Forecast, By Source
7.1. Introduction
7.1.1. Market share and Basis Points (BPS) Analysis, By Source
7.1.2. Y-o-Y Growth Projections, By Source
7.2. Historical Market Value (US$ Mn) and Volume (Mn Tonnes), 2017-2021, By Source
7.2.1. Wood Pulp / Virgin Fiber Pulp
7.2.1.1. Soft Wood
7.2.1.2. Hard Wood
7.2.2. Non-Wood Pulp
7.2.2.1. Straw (Corn, Wheat, Rice etc.)
7.2.2.2. Bast (Flex, Jute, Hemp, Kenaf, etc.)
7.2.2.3. Leaf (Sisal, Palm, etc.)
7.2.2.4. Seeds (Cotton, Coir, etc.)
7.2.2.5. Grass (Bamboo, Reeds)
7.2.2.6. Others
7.2.3. Recycled Pulp / De-Inked Pulp
7.3. Market Size (US$ Mn) and Volume (Mn Tonnes) Forecast Analysis 2022-2030, By Source
7.3.1. Wood Pulp / Virgin Fiber Pulp
7.3.1.1. Soft Wood
7.3.1.2. Hard Wood
7.3.2. Non-Wood Pulp
7.3.2.1. Straw (Corn, Wheat, Rice etc.)
7.3.2.2. Bast (Flex, Jute, Hemp, Kenaf, etc.)
7.3.2.3. Leaf (Sisal, Palm, etc.)
7.3.2.4. Seeds (Cotton, Coir, etc.)
7.3.2.5. Grass (Bamboo, Reeds)
7.3.2.6. Others
7.3.3. Recycled Pulp / De-Inked Pulp
7.4. Market Attractiveness Analysis, By Source
8. Global Pulp Market Analysis and Forecast, By Grade
8.1. Introduction
8.1.1. Market share and Basis Points (BPS) Analysis, By Grade
8.1.2. Y-o-Y Growth Projections, By Grade
8.2. Historical Market Value (US$ Mn) and Volume (Mn Tonnes), 2017-2021, By Grade
8.2.1. Mechanical Pulping
8.2.2. Chemical Pulping
8.2.3. Others
8.3. Market Size (US$ Mn) and Volume (Mn Tonnes) Forecast Analysis 2022-2030, By Grade
8.3.1. Mechanical Pulping
8.3.2. Chemical Pulping
8.3.3. Others
8.4. Market Attractiveness Analysis, By Grade
9. Global Pulp Market Analysis and Forecast, By End Use
9.1. Introduction
9.1.1. Market share and Basis Points (BPS) Analysis, By End Use
9.1.2. Y-o-Y Growth Projections, By End Use
9.2. Historical Market Value (US$ Mn) and Volume (Mn Tonnes), 2017-2021, By End Use
9.2.1. Packaging
9.2.1.1. Food & Beverages
9.2.1.2. Personal Care & Cosmetics
9.2.1.3. Pharmaceutical
9.2.1.4. Automotive
9.2.1.5. Others
9.2.2. Print Media
9.2.2.1. News Printing
9.2.2.2. Book / Magazine Printing
9.2.2.3. Advanced Printing
9.2.3. Tissue & Hygiene Paper
9.3. Market Size (US$ Mn) and Volume (Mn Tonnes) Forecast Analysis 2022-2030, By End Use
9.3.1. Packaging
9.3.1.1. Food & Beverages
9.3.1.2. Personal Care & Cosmetics
9.3.1.3. Pharmaceutical
9.3.1.4. Automotive
9.3.1.5. Others
9.3.2. Print Media
9.3.2.1. News Printing
9.3.2.2. Book / Magazine Printing
9.3.2.3. Advanced Printing
9.3.3. Tissue & Hygiene Paper
9.4. Market Attractiveness Analysis, By End Use
9.5. Prominent Trends
10. Global Pulp Market Analysis and Forecast, By Region
10.1. Introduction
10.1.1. Market share and Basis Points (BPS) Analysis By Region
10.1.2. Y-o-Y Growth Projections By Region
10.2. Historical Market Value (US$ Mn) and Volume (Mn Tonnes), 2017-2021, By Region
10.2.1. North America
10.2.2. Latin America
10.2.3. Europe
10.2.4. Asia Pacific
10.2.5. Middle East and Africa
10.3. Market Size (US$ Mn) and Volume (Mn Tonnes) Forecast Analysis 2022-2030 By Region
10.3.1. North America
10.3.2. Latin America
10.3.3. Europe
10.3.4. Asia Pacific
10.3.5. Middle East and Africa
10.4. Market Attractiveness Analysis By Region
11. North America Pulp Market Analysis and Forecast
11.1. Introduction
11.1.1. Market share and Basis Points (BPS) Analysis, By Country
11.1.2. Y-o-Y Growth Projections, By Country
11.2. Historical Market Value (US$ Mn) and Volume (Mn Tonnes), 2017-2021, By Country
11.3. Market Size (US$ Mn) and Volume (Mn Tonnes) Forecast Analysis 2022-2030, By Country
11.3.1. U.S.
11.3.2. Canada
11.4. Historical Market Value (US$ Mn) and Volume (Mn Tonnes), 2017-2021, By Source
11.5. Market Size (US$ Mn) and Volume (Mn Tonnes) Forecast Analysis 2022-2030 Analysis 2022-2030, By Source
11.5.1. Wood Pulp / Virgin Fiber Pulp
11.5.1.1. Soft Wood
11.5.1.2. Hard Wood
11.5.2. Non-Wood Pulp
11.5.2.1. Straw (Corn, Wheat, Rice etc.)
11.5.2.2. Bast (Flex, Jute, Hemp, Kenaf, etc.)
11.5.2.3. Leaf (Sisal, Palm, etc.)
11.5.2.4. Seeds (Cotton, Coir, etc.)
11.5.2.5. Grass (Bamboo, Reeds)
11.5.2.6. Others
11.5.3. Recycled Pulp / De-Inked Pulp
11.6. Historical Market Value (US$ Mn) and Volume (Mn Tonnes), 2017-2021, By Grade
11.7. Market Size (US$ Mn) and Volume (Mn Tonnes) Forecast Analysis 2022-2030 Analysis 2022-2030, By Grade
11.7.1. Mechanical Pulping
11.7.2. Chemical Pulping
11.7.3. Others
11.8. Historical Market Value (US$ Mn) and Volume (Mn Tonnes), 2017-2021, By End Use
11.9. Market Size (US$ Mn) and Volume (Mn Tonnes) Forecast Analysis 2022-2030, By End Use
11.9.1. Packaging
11.9.1.1. Food & Beverages
11.9.1.2. Personal Care & Cosmetics
11.9.1.3. Pharmaceutical
11.9.1.4. Automotive
11.9.1.5. Others
11.9.2. Print Media
11.9.2.1. News Printing
11.9.2.2. Book / Magazine Printing
11.9.2.3. Advanced Printing
11.9.3. Tissue & Hygiene Paper
11.10. Market Attractiveness Analysis
11.10.1. By Country
11.10.2. By Source
11.10.3. By Grade
11.10.4. By End Use
12. Latin America Pulp Market Analysis and Forecast
12.1. Introduction
12.1.1. Market share and Basis Points (BPS) Analysis, By Country
12.1.2. Y-o-Y Growth Projections, By Country
12.2. Historical Market Value (US$ Mn) and Volume (Mn Tonnes), 2017-2021, By Country
12.3. Market Size (US$ Mn) and Volume (Mn Tonnes) Forecast Analysis 2022-2030 By Country
12.3.1. Brazil
12.3.2. Mexico
12.3.3. Argentina
12.3.4. Rest of Latin America
12.4. Historical Market Value (US$ Mn) and Volume (Mn Tonnes), 2017-2021, By Source
12.5. Market Size (US$ Mn) and Volume (Mn Tonnes) Forecast Analysis 2022-2030 Analysis 2022-2030, By Source
12.5.1. Wood Pulp / Virgin Fiber Pulp
12.5.1.1. Soft Wood
12.5.1.2. Hard Wood
12.5.2. Non-Wood Pulp
12.5.2.1. Straw (Corn, Wheat, Rice etc.)
12.5.2.2. Bast (Flex, Jute, Hemp, Kenaf, etc.)
12.5.2.3. Leaf (Sisal, Palm, etc.)
12.5.2.4. Seeds (Cotton, Coir, etc.)
12.5.2.5. Grass (Bamboo, Reeds)
12.5.2.6. Others
12.5.3. Recycled Pulp / De-Inked Pulp
12.6. Historical Market Value (US$ Mn) and Volume (Mn Tonnes), 2017-2021, By Grade
12.7. Market Size (US$ Mn) and Volume (Mn Tonnes) Forecast Analysis 2022-2030 Analysis 2022-2030, By Grade
12.7.1. Mechanical Pulping
12.7.2. Chemical Pulping
12.7.3. Others
12.8. Historical Market Value (US$ Mn) and Volume (Mn Tonnes), 2017-2021, By End Use
12.9. Market Size (US$ Mn) and Volume (Mn Tonnes) Forecast Analysis 2022-2030, By End Use
12.9.1. Packaging
12.9.1.1. Food & Beverages
12.9.1.2. Personal Care & Cosmetics
12.9.1.3. Pharmaceutical
12.9.1.4. Automotive
12.9.1.5. Others
12.9.2. Print Media
12.9.2.1. News Printing
12.9.2.2. Book / Magazine Printing
12.9.2.3. Advanced Printing
12.9.3. Tissue & Hygiene Paper
12.10. Market Attractiveness Analysis
12.10.1. By Country
12.10.2. By Source
12.10.3. By Grade
12.10.4. By End Use
13. Europe Pulp Market Analysis and Forecast
13.1. Introduction
13.1.1. Market share and Basis Points (BPS) Analysis, By Country
13.1.2. Y-o-Y Growth Projections, By Country
13.2. Historical Market Value (US$ Mn) and Volume (Mn Tonnes), 2017-2021, By Country
13.3. Market Size (US$ Mn) and Volume (Mn Tonnes) Forecast Analysis 2022-2030 By Country
13.3.1. Germany
13.3.2. Italy
13.3.3. Spain
13.3.4. Russia
13.3.5. U.K.
13.3.6. France
13.3.7. Benelux
13.3.8. Nordic
13.3.9. Poland
13.3.10. Rest of Europe
13.4. Historical Market Value (US$ Mn) and Volume (Mn Tonnes), 2017-2021, By Source
13.5. Market Size (US$ Mn) and Volume (Mn Tonnes) Forecast Analysis 2022-2030 Analysis 2022-2030, By Source
13.5.1. Wood Pulp / Virgin Fiber Pulp
13.5.1.1. Soft Wood
13.5.1.2. Hard Wood
13.5.2. Non-Wood Pulp
13.5.2.1. Straw (Corn, Wheat, Rice etc.)
13.5.2.2. Bast (Flex, Jute, Hemp, Kenaf, etc.)
13.5.2.3. Leaf (Sisal, Palm, etc.)
13.5.2.4. Seeds (Cotton, Coir, etc.)
13.5.2.5. Grass (Bamboo, Reeds)
13.5.2.6. Others
13.5.3. Recycled Pulp / De-Inked Pulp
13.6. Historical Market Value (US$ Mn) and Volume (Mn Tonnes), 2017-2021, By Grade
13.7. Market Size (US$ Mn) and Volume (Mn Tonnes) Forecast Analysis 2022-2030 Analysis 2022-2030, By Grade
13.7.1. Mechanical Pulping
13.7.2. Chemical Pulping
13.7.3. Others
13.8. Historical Market Value (US$ Mn) and Volume (Mn Tonnes), 2017-2021, By End Use
13.9. Market Size (US$ Mn) and Volume (Mn Tonnes) Forecast Analysis 2022-2030, By End Use
13.9.1. Packaging
13.9.1.1. Food & Beverages
13.9.1.2. Personal Care & Cosmetics
13.9.1.3. Pharmaceutical
13.9.1.4. Automotive
13.9.1.5. Others
13.9.2. Print Media
13.9.2.1. News Printing
13.9.2.2. Book / Magazine Printing
13.9.2.3. Advanced Printing
13.9.3. Tissue & Hygiene Paper
13.10. Market Attractiveness Analysis
13.10.1. By Country
13.10.2. By Source
13.10.3. By Grade
13.10.4. By End Use
14. Asia Pacific Pulp Market Analysis and Forecast
14.1. Introduction
14.1.1. Market share and Basis Points (BPS) Analysis, By Country
14.1.2. Y-o-Y Growth Projections, By Country
14.2. Historical Market Value (US$ Mn) and Volume (Mn Tonnes), 2017-2021, By Country
14.3. Market Size (US$ Mn) and Volume (Mn Tonnes) Forecast Analysis 2022-2030 By Country
14.3.1. China
14.3.2. India
14.3.3. ASEAN
14.3.4. Australia & New Zealand
14.3.5. Japan
14.3.6. South Korea
14.3.7. Rest of Asia Pacific
14.4. Historical Market Value (US$ Mn) and Volume (Mn Tonnes), 2017-2021, By Source
14.5. Market Size (US$ Mn) and Volume (Mn Tonnes) Forecast Analysis 2022-2030 Analysis 2022-2030, By Source
14.5.1. Wood Pulp / Virgin Fiber Pulp
14.5.1.1. Soft Wood
14.5.1.2. Hard Wood
14.5.2. Non-Wood Pulp
14.5.2.1. Straw (Corn, Wheat, Rice etc.)
14.5.2.2. Bast (Flex, Jute, Hemp, Kenaf, etc.)
14.5.2.3. Leaf (Sisal, Palm, etc.)
14.5.2.4. Seeds (Cotton, Coir, etc.)
14.5.2.5. Grass (Bamboo, Reeds)
14.5.2.6. Others
14.5.3. Recycled Pulp / De-Inked Pulp
14.6. Historical Market Value (US$ Mn) and Volume (Mn Tonnes), 2017-2021, By Grade
14.7. Market Size (US$ Mn) and Volume (Mn Tonnes) Forecast Analysis 2022-2030 Analysis 2022-2030, By Grade
14.7.1. Mechanical Pulping
14.7.2. Chemical Pulping
14.7.3. Others
14.8. Historical Market Value (US$ Mn) and Volume (Mn Tonnes), 2017-2021, By End Use
14.9. Market Size (US$ Mn) and Volume (Mn Tonnes) Forecast Analysis 2022-2030, By End Use
14.9.1. Packaging
14.9.1.1. Food & Beverages
14.9.1.2. Personal Care & Cosmetics
14.9.1.3. Pharmaceutical
14.9.1.4. Automotive
14.9.1.5. Others
14.9.2. Print Media
14.9.2.1. News Printing
14.9.2.2. Book / Magazine Printing
14.9.2.3. Advanced Printing
14.9.3. Tissue & Hygiene Paper
14.10. Market Attractiveness Analysis
14.10.1. By Country
14.10.2. By Source
14.10.3. By Grade
14.10.4. By End Use
15. Middle East and Africa Pulp Market Analysis and Forecast
15.1. Introduction
15.1.1. Market share and Basis Points (BPS) Analysis, By Country
15.1.2. Y-o-Y Growth Projections, By Country
15.2. Historical Market Value (US$ Mn) and Volume (Mn Tonnes), 2017-2021, By Country
15.3. Market Size (US$ Mn) and Volume (Mn Tonnes) Forecast Analysis 2022-2030, By Country
15.3.1. North Africa
15.3.2. GCC countries
15.3.3. South Africa
15.3.4. Turkey
15.3.5. Rest of MEA
15.4. Historical Market Value (US$ Mn) and Volume (Mn Tonnes), 2017-2021, By Source
15.5. Market Size (US$ Mn) and Volume (Mn Tonnes) Forecast Analysis 2022-2030 Analysis 2022-2030, By Source
15.5.1. Wood Pulp / Virgin Fiber Pulp
15.5.1.1. Soft Wood
15.5.1.2. Hard Wood
15.5.2. Non-Wood Pulp
15.5.2.1. Straw (Corn, Wheat, Rice etc.)
15.5.2.2. Bast (Flex, Jute, Hemp, Kenaf, etc.)
15.5.2.3. Leaf (Sisal, Palm, etc.)
15.5.2.4. Seeds (Cotton, Coir, etc.)
15.5.2.5. Grass (Bamboo, Reeds)
15.5.2.6. Others
15.5.3. Recycled Pulp / De-Inked Pulp
15.6. Historical Market Value (US$ Mn) and Volume (Mn Tonnes), 2017-2021, By Grade
15.7. Market Size (US$ Mn) and Volume (Mn Tonnes) Forecast Analysis 2022-2030 Analysis 2022-2030, By Grade
15.7.1. Mechanical Pulping
15.7.2. Chemical Pulping
15.7.3. Others
15.8. Historical Market Value (US$ Mn) and Volume (Mn Tonnes), 2017-2021, By End Use
15.9. Market Size (US$ Mn) and Volume (Mn Tonnes) Forecast Analysis 2022-2030, By End Use
15.9.1. Packaging
15.9.1.1. Food & Beverages
15.9.1.2. Personal Care & Cosmetics
15.9.1.3. Pharmaceutical
15.9.1.4. Automotive
15.9.1.5. Others
15.9.2. Print Media
15.9.2.1. News Printing
15.9.2.2. Book / Magazine Printing
15.9.2.3. Advanced Printing
15.9.3. Tissue & Hygiene Paper
15.10. Market Attractiveness Analysis
15.10.1. By Country
15.10.2. By Source
15.10.3. By Grade
15.10.4. By End Use
16. Country wise Pulp Market Analysis, 2022-2030
16.1. U.S. Rigid Packaging Containers Market Analysis
16.1.1. By Source
16.1.2. By Grade
16.1.3. By End Use
16.2. Canada Rigid Packaging Containers Market Analysis
16.2.1. By Source
16.2.2. By Grade
16.2.3. By End Use
16.3. Brazil Rigid Packaging Containers Market Analysis
16.3.1. By Source
16.3.2. By Grade
16.3.3. By End Use
16.4. Mexico Rigid Packaging Containers Market Analysis
16.4.1. By Source
16.4.2. By Grade
16.4.3. By End Use
16.5. Argentina Rigid Packaging Containers Market Analysis
16.5.1. By Source
16.5.2. By Grade
16.5.3. By End Use
16.6. Germany Rigid Packaging Containers Market Analysis
16.6.1. By Source
16.6.2. By Grade
16.6.3. By End Use
16.7. Spain Rigid Packaging Containers Market Analysis
16.7.1. By Source
16.7.2. By Grade
16.7.3. By End Use
16.8. France Rigid Packaging Containers Market Analysis
16.8.1. By Source
16.8.2. By Grade
16.8.3. By End Use
16.9. U K Rigid Packaging Containers Market Analysis
16.9.1. By Source
16.9.2. By Grade
16.9.3. By End Use
16.10. Italy Rigid Packaging Containers Market Analysis
16.10.1. By Source
16.10.2. By Grade
16.10.3. By End Use
16.11. Benelux Rigid Packaging Containers Market Analysis
16.11.1. By Source
16.11.2. By Grade
16.11.3. By End Use
16.12. Russia Rigid Packaging Containers Market Analysis
16.12.1. By Source
16.12.2. By Grade
16.12.3. By End Use
16.13. China Rigid Packaging Containers Market Analysis
16.13.1. By Source
16.13.2. By Grade
16.13.3. By End Use
16.14. India Rigid Packaging Containers Market Analysis
16.14.1. By Source
16.14.2. By Grade
16.14.3. By End Use
16.15. Japan Rigid Packaging Containers Market Analysis
16.15.1. By Source
16.15.2. By Grade
16.15.3. By End Use
17. Competitive Landscape
17.1. Market Structure
17.2. Competition Dashboard
17.3. Company Market Share Analysis
17.4. Company Profiles (Details – Overview, Financials, Strategy, Recent Developments, SWOT analysis)
17.5. Competition Deep Dive (Key Global Market Players)
17.5.1. International Paper
17.5.1.1. Overview
17.5.1.2. Financials
17.5.1.3. Strategy
17.5.1.4. Recent Developments
17.5.1.5. SWOT Analysis
17.5.2. Domtar Corporation
17.5.2.1. Overview
17.5.2.2. Financials
17.5.2.3. Strategy
17.5.2.4. Recent Developments
17.5.2.5. SWOT Analysis
17.5.3. Stora Enso
17.5.3.1. Overview
17.5.3.2. Financials
17.5.3.3. Strategy
17.5.3.4. Recent Developments
17.5.3.5. SWOT Analysis
17.5.4. UPM Global
17.5.4.1. Overview
17.5.4.2. Financials
17.5.4.3. Strategy
17.5.4.4. Recent Developments
17.5.4.5. SWOT Analysis
17.5.5. WestRock Company
17.5.5.1. Overview
17.5.5.2. Financials
17.5.5.3. Strategy
17.5.5.4. Recent Developments
17.5.5.5. SWOT Analysis
17.5.6. BillerudKorsnäs AB
17.5.6.1. Overview
17.5.6.2. Financials
17.5.6.3. Strategy
17.5.6.4. Recent Developments
17.5.6.5. SWOT Analysis
17.5.7. Ahlstrom-Munksjö
17.5.7.1. Overview
17.5.7.2. Financials
17.5.7.3. Strategy
17.5.7.4. Recent Developments
17.5.7.5. SWOT Analysis
17.5.8. Georgia-Pacific
17.5.8.1. Overview
17.5.8.2. Financials
17.5.8.3. Strategy
17.5.8.4. Recent Developments
17.5.8.5. SWOT Analysis
17.5.9. Mondi plc
17.5.9.1. Overview
17.5.9.2. Financials
17.5.9.3. Strategy
17.5.9.4. Recent Developments
17.5.9.5. SWOT Analysis
17.5.10. Mercer International Inc.
17.5.10.1. Overview
17.5.10.2. Financials
17.5.10.3. Strategy
17.5.10.4. Recent Developments
17.5.10.5. SWOT Analysis
17.5.11. Nippon Paper Industries co., Ltd.
17.5.11.1. Overview
17.5.11.2. Financials
17.5.11.3. Strategy
17.5.11.4. Recent Developments
17.5.11.5. SWOT Analysis
17.5.12. Oji Holdings Corporation
17.5.12.1. Overview
17.5.12.2. Financials
17.5.12.3. Strategy
17.5.12.4. Recent Developments
17.5.12.5. SWOT Analysis
17.5.13. Mitsubishi Paper Mills Limited
17.5.13.1. Overview
17.5.13.2. Financials
17.5.13.3. Strategy
17.5.13.4. Recent Developments
17.5.13.5. SWOT Analysis
17.5.14. Resolute Forest Products
17.5.14.1. Overview
17.5.14.2. Financials
17.5.14.3. Strategy
17.5.14.4. Recent Developments
17.5.14.5. SWOT Analysis
17.5.15. Svenska Cellulosa AB SCA
17.5.15.1. Overview
17.5.15.2. Financials
17.5.15.3. Strategy
17.5.15.4. Recent Developments
17.5.15.5. SWOT Analysis
17.5.16. Sappi Global
17.5.16.1. Overview
17.5.16.2. Financials
17.5.16.3. Strategy
17.5.16.4. Recent Developments
17.5.16.5. SWOT Analysis
18. Assumptions and Acronyms Used
19. Research Methodology
List of Tables
Table 01: Global Pulp Market Historic Value (US$ Mn), By Source 2017(H)-2021(A)
Table 02: Global Pulp Market Forecast Value (US$ Mn), By Source 2022(E)-2030(F)
Table 03: Global Pulp Market Historic Volume (Mn Tonnes), By Source 2017(H)-2021(A)
Table 04: Global Pulp Market Forecast Volume (Mn Tonnes), By Source 2022(E)-2030(F)
Table 05: Global Pulp Market Historic Value (US$ Mn), By Grade 2017(H)-2021(A)
Table 06: Global Pulp Market Forecast Value (US$ Mn), By Grade 2022(E)-2030(F)
Table 07: Global Pulp Market Historic Volume (Mn Tonnes), By Grade 2017(H)-2021(A)
Table 08: Global Pulp Market Forecast Volume (Mn Tonnes), By Grade 2022(E)-2030(F)
Table 09: Global Pulp Market Historic Value (US$ Mn), By End Use 2017(H)-2021(A)
Table 10: Global Pulp Market Forecast Value (US$ Mn), By End Use 2022(E)-2030(F)
Table 11: Global Pulp Market Historic Volume (Mn Tonnes), By End Use 2017(H)-2021(A)
Table 12: Global Pulp Market Forecast Volume (Mn Tonnes), By End Use 2022(E)-2030(F)
Table 13: Global Pulp Market Historic Value (US$ Mn), By Region Type 2017(H)-2021(A)
Table 14: Global Pulp Market Forecast Value (US$ Mn), By Region Type 2022(E)-2030(F)
Table 15: Global Pulp Market Historic Volume (Mn Tonnes), By Region Type 2017(H)-2021(A)
Table 16: Global Pulp Market Forecast Volume (Mn Tonnes), By Region Type 2022(E)-2030(F)
Table 17: North America Pulp Market Historic Value (US$ Mn), By Source 2017(H)-2021(A)
Table 18: North America Pulp Market Forecast Value (US$ Mn), By Source 2022(E)-2030(F)
Table 19: North America Pulp Market Historic Volume (Mn Tonnes), By Source 2017(H)-2021(A)
Table 20: North America Pulp Market Forecast Volume (Mn Tonnes), By Source 2022(E)-2030(F)
Table 21: North America Pulp Market Historic Value (US$ Mn), By Grade 2017(H)-2021(A)
Table 22: North America Pulp Market Forecast Value (US$ Mn), By Grade 2022(E)-2030(F)
Table 23: North America Pulp Market Historic Volume (Mn Tonnes), By Grade 2017(H)-2021(A)
Table 24: North America Pulp Market Forecast Volume (Mn Tonnes), By Grade 2022(E)-2030(F)
Table 25: North America Pulp Market Historic Value (US$ Mn), By End Use 2017(H)-2021(A)
Table 26: North America Pulp Market Forecast Value (US$ Mn), By End Use 2022(E)-2030(F)
Table 27: North America Pulp Market Historic Volume (Mn Tonnes), By End Use 2017(H)-2021(A)
Table 28: North America Pulp Market Forecast Volume (Mn Tonnes), By End Use 2022(E)-2030(F)
Table 29: Latin America Pulp Market Historic Value (US$ Mn), By Source 2017(H)-2021(A)
Table 30: Latin America Pulp Market Forecast Value (US$ Mn), By Source 2022(E)-2030(F)
Table 31: Latin America Pulp Market Historic Volume (Mn Tonnes), By Source 2017(H)-2021(A)
Table 32: Latin America Pulp Market Forecast Volume (Mn Tonnes), By Source 2022(E)-2030(F)
Table 33: Latin America Pulp Market Historic Value (US$ Mn), By Grade 2017(H)-2021(A)
Table 34: Latin America Pulp Market Forecast Value (US$ Mn), By Grade 2022(E)-2030(F)
Table 35: Latin America Pulp Market Historic Volume (Mn Tonnes), By Grade 2017(H)-2021(A)
Table 36: Latin America Pulp Market Forecast Volume (Mn Tonnes), By Grade 2022(E)-2030(F)
Table 37: Latin America Pulp Market Historic Value (US$ Mn), By End Use 2017(H)-2021(A)
Table 38: Latin America Pulp Market Forecast Value (US$ Mn), By End Use 2022(E)-2030(F)
Table 39: Latin America Pulp Market Historic Volume (Mn Tonnes), By End Use 2017(H)-2021(A)
Table 40: Latin America Pulp Market Forecast Volume (Mn Tonnes), By End Use 2022(E)-2030(F)
Table 41: Europe Pulp Market Historic Value (US$ Mn), By Source 2017(H)-2021(A)
Table 42: Europe Pulp Market Forecast Value (US$ Mn), By Source 2022(E)-2030(F)
Table 43: Europe Pulp Market Historic Volume (Mn Tonnes), By Source 2017(H)-2021(A)
Table 44: Europe Pulp Market Forecast Volume (Mn Tonnes), By Source 2022(E)-2030(F)
Table 45: Europe Pulp Market Historic Value (US$ Mn), By Grade 2017(H)-2021(A)
Table 46: Europe Pulp Market Forecast Value (US$ Mn), By Grade 2022(E)-2030(F)
Table 47: Europe Pulp Market Historic Volume (Mn Tonnes), By Grade 2017(H)-2021(A)
Table 48: Europe Pulp Market Forecast Volume (Mn Tonnes), By Grade 2022(E)-2030(F)
Table 49: Europe Pulp Market Historic Value (US$ Mn), By End Use 2017(H)-2021(A)
Table 50: Europe Pulp Market Forecast Value (US$ Mn), By End Use 2022(E)-2030(F)
Table 51: Europe Pulp Market Historic Volume (Mn Tonnes), By End Use 2017(H)-2021(A)
Table 52: Europe Pulp Market Forecast Volume (Mn Tonnes), By End Use 2022(E)-2030(F)
Table 53: Asia Pacific Pulp Market Historic Value (US$ Mn), By Source 2017(H)-2021(A)
Table 54: Asia Pacific Pulp Market Forecast Value (US$ Mn), By Source 2022(E)-2030(F)
Table 55: Asia Pacific Pulp Market Historic Volume (Mn Tonnes), By Source 2017(H)-2021(A)
Table 56: Asia Pacific Pulp Market Forecast Volume (Mn Tonnes), By Source 2022(E)-2030(F)
Table 57: Asia Pacific Pulp Market Historic Value (US$ Mn), By Grade 2017(H)-2021(A)
Table 58: Asia Pacific Pulp Market Forecast Value (US$ Mn), By Grade 2022(E)-2030(F)
Table 59: Asia Pacific Pulp Market Historic Volume (Mn Tonnes), By Grade 2017(H)-2021(A)
Table 60: Asia Pacific Pulp Market Forecast Volume (Mn Tonnes), By Grade 2022(E)-2030(F)
Table 61: Asia Pacific Pulp Market Historic Value (US$ Mn), By End Use 2017(H)-2021(A)
Table 62: Asia Pacific Pulp Market Forecast Value (US$ Mn), By End Use 2022(E)-2030(F)
Table 63: Asia Pacific Pulp Market Historic Volume (Mn Tonnes), By End Use 2017(H)-2021(A)
Table 64: Asia Pacific Pulp Market Forecast Volume (Mn Tonnes), By End Use 2022(E)-2030(F)
Table 65: MEA Pulp Market Historic Value (US$ Mn), By Source 2017(H)-2021(A)
Table 66: MEA Pulp Market Forecast Value (US$ Mn), By Source 2022(E)-2030(F)
Table 67: MEA Pulp Market Historic Volume (Mn Tonnes), By Source 2017(H)-2021(A)
Table 68: MEA Pulp Market Forecast Volume (Mn Tonnes), By Source 2022(E)-2030(F)
Table 69: MEA Pulp Market Historic Value (US$ Mn), By Grade 2017(H)-2021(A)
Table 70: MEA Pulp Market Forecast Value (US$ Mn), By Grade 2022(E)-2030(F)
Table 71: MEA Pulp Market Historic Volume (Mn Tonnes), By Grade 2017(H)-2021(A)
Table 72: MEA Pulp Market Forecast Volume (Mn Tonnes), By Grade 2022(E)-2030(F)
Table 73: MEA Pulp Market Historic Value (US$ Mn), By End Use 2017(H)-2021(A)
Table 74: MEA Pulp Market Forecast Value (US$ Mn), By End Use 2022(E)-2030(F)
Table 75: MEA Pulp Market Historic Volume (Mn Tonnes), By End Use 2017(H)-2021(A)
Table 76: MEA Pulp Market Forecast Volume (Mn Tonnes), By End Use 2022(E)-2030(F)
List of Figures
Figure 01: Global Pulp Market Value Share Analysis, By Source 2022(E) & 2030(F)
Figure 02: Global Pulp Market Attractiveness Analysis, By Source 2022(E)-2030(F)
Figure 03: Global Pulp Market YoY Growth Analysis, By Source 2017(H)-2030(F)
Figure 04: Global Pulp Market Value Share Analysis, By Grade 2022(E) & 2030(F)
Figure 05: Global Pulp Market Attractiveness Analysis, By Grade 2022(E)-2030(F)
Figure 06: Global Pulp Market YoY Growth Analysis, By Grade 2017(H)-2030(F)
Figure 07: Global Pulp Market Value Share Analysis, By End Use 2022(E) & 2030(F)
Figure 08: Global Pulp Market Attractiveness Analysis, By End Use 2022(E)-2030(F)
Figure 09: Global Pulp Market YoY Growth Analysis, By End Use 2017(H)-2030(F)
Figure 10: Global Pulp Market Value Share Analysis, By Region 2022(E) & 2030(F)
Figure 11: Global Pulp Market Attractiveness Analysis, By Region 2022(E)-2030(F)
Figure 12: Global Pulp Market YoY Growth Analysis, By Region 2017(H)-2030(F)
Figure 13: North America Pulp Market Value Share Analysis, By Country, 2022(E) & 2030(F)
Figure 14: North America Pulp Market Value Share Analysis, By Source, 2022(E) & 2030(F)
Figure 15: North America Pulp Market Value Share Analysis, By Grade, 2022(E) & 2030(F)
Figure 16: North America Pulp Market Value Share Analysis, By End Use, 2022(E) & 2030(F)
Figure 17: North America Pulp Market Attractiveness Analysis, By Country, 2022(E) & 2030(F)
Figure 18: North America Pulp Market Attractiveness Analysis, By Source, 2022(E) & 2030(F)
Figure 19: North America Pulp Market Attractiveness Analysis, By Grade, 2022(E) & 2030(F)
Figure 20: North America Pulp Market Attractiveness Analysis, By End Use, 2022(E) & 2030(F)
Figure 21: Latin America Pulp Market Value Share Analysis, By Country, 2022(E) & 2030(F)
Figure 22: Latin America Pulp Market Value Share Analysis, By Source, 2022(E) & 2030(F)
Figure 23: Latin America Pulp Market Value Share Analysis, By Grade, 2022(E) & 2030(F)
Figure 24: Latin America Pulp Market Value Share Analysis, By End Use, 2022(E) & 2030(F)
Figure 25: Latin America Pulp Market Attractiveness Analysis, By Country, 2022(E) & 2030(F)
Figure 26: Latin America Pulp Market Attractiveness Analysis, By Source, 2022(E) & 2030(F)
Figure 27: Latin America Pulp Market Attractiveness Analysis, By Grade, 2022(E) & 2030(F)
Figure 28: Latin America Pulp Market Attractiveness Analysis, By End Use, 2022(E) & 2030(F)
Figure 29: Europe Pulp Market Value Share Analysis, By Country, 2022(E) & 2030(F)
Figure 30: Europe Pulp Market Value Share Analysis, By Source, 2022(E) & 2030(F)
Figure 31: Europe Pulp Market Value Share Analysis, By Grade, 2022(E) & 2030(F)
Figure 32: Europe Pulp Market Value Share Analysis, By End Use, 2022(E) & 2030(F)
Figure 33: Europe Pulp Market Attractiveness Analysis, By Country, 2022(E) & 2030(F)
Figure 34: Europe Pulp Market Attractiveness Analysis, By Source, 2022(E) & 2030(F)
Figure 35: Europe Pulp Market Attractiveness Analysis, By Grade, 2022(E) & 2030(F)
Figure 36: Europe Pulp Market Attractiveness Analysis, By End Use, 2022(E) & 2030(F)
Figure 37: Asia Pacific Pulp Market Value Share Analysis, By Country, 2022(E) & 2030(F)
Figure 38: Asia Pacific Pulp Market Value Share Analysis, By Source, 2022(E) & 2030(F)
Figure 39: Asia Pacific Pulp Market Value Share Analysis, By Grade, 2022(E) & 2030(F)
Figure 40: Asia Pacific Pulp Market Value Share Analysis, By End Use, 2022(E) & 2030(F)
Figure 41: Asia Pacific Pulp Market Attractiveness Analysis, By Country, 2022(E) & 2030(F)
Figure 42: Asia Pacific Pulp Market Attractiveness Analysis, By Source, 2022(E) & 2030(F)
Figure 43: Asia Pacific Pulp Market Attractiveness Analysis, By Grade, 2022(E) & 2030(F)
Figure 44: Asia Pacific Pulp Market Attractiveness Analysis, By End Use, 2022(E) & 2030(F)
Figure 45: MEA Pulp Market Value Share Analysis, By Country, 2022(E) & 2030(F)
Figure 46: MEA Pulp Market Value Share Analysis, By Source, 2022(E) & 2030(F)
Figure 47: MEA Pulp Market Value Share Analysis, By Grade, 2022(E) & 2030(F)
Figure 48: MEA Pulp Market Value Share Analysis, By End Use, 2022(E) & 2030(F)
Figure 49: MEA Pulp Market Attractiveness Analysis, By Country, 2022(E) & 2030(F)
Figure 50: MEA Pulp Market Attractiveness Analysis, By Source, 2022(E) & 2030(F)
Figure 51: MEA Pulp Market Attractiveness Analysis, By Grade, 2022(E) & 2030(F)
Figure 52: MEA Pulp Market Attractiveness Analysis, By End Use, 2022(E) & 2030(F)
Copyright © Transparency Market Research, Inc. All Rights reserved
Trust Online

Pulp Market