
Reports
Reports
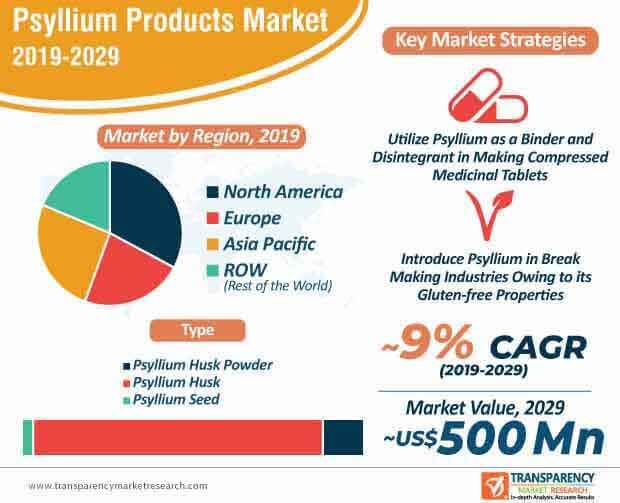
Medicinal advantages of psyllium husk and powder are being noticed in home remedies to regulate cholesterol levels. High prevalence of cardiovascular diseases in individuals worldwide has created a demand for psyllium products. As such, psyllium husk dictates the highest revenue among all product types in the psyllium products market, where the market that is currently valued at ~US$ 215 Mn is anticipated to reach ~US$ 525 Mn by the end of 2029.
Though North America dictates the highest revenue among all regions in the psyllium products market, India is one of the leading producers of psyllium worldwide. Psyllium products are being extensively used in home remedies as a laxative to help stimulate digestion. Apart from managing cholesterol levels, psyllium is being pervasively used to treat diarrhea, blood sugar levels, and it also boosts weight loss. Thus, health-conscious consumers are one of the major target audiences in the psyllium products market.
Gluten-free and Disintegrant Properties of Psyllium Find Application in Bakery Items
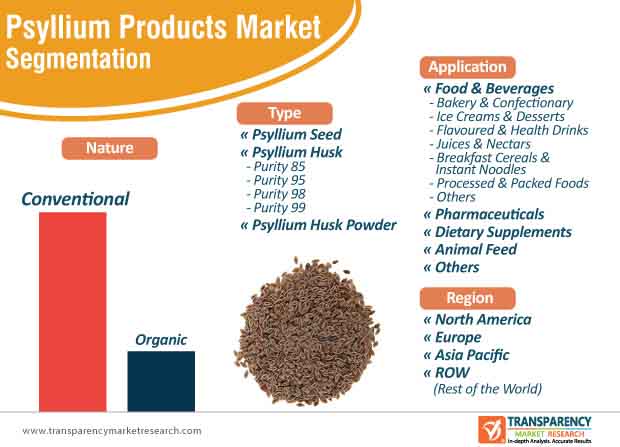
Psyllium acts as an effective binder and disintegrant in making compressed medicinal tablets. This is evident since pharmaceutical application segment dominates the highest revenue in the psyllium products market, where the market is estimated to reach an output of ~121,400 metric tons by the end of 2029. Hence, manufacturers are investing in capacity additions to produce psyllium husk and powder. For instance, Altrafine Gums— an India-based manufacturer of guar gum powder, has an extensive portfolio of psyllium husk powder, cassia tora powder, and fenugreek gum powder, among others. As such, companies are increasing the availability of fiber supplements in the form of capsules and powder.
Apart from pharmaceutical products, companies in the psyllium products market are tapping into opportunities in bakery. Gluten-free properties of psyllium products are being increasingly used as a binding agent in bread making industries. Psyllium is being highly publicized as paleo-friendly food to control and reduce weight.
Gradual Dosage Increase of Psyllium Prevents Gastrointestinal Side Effects
The psyllium products market is projected to expand at a healthy CAGR of ~9% during the forecast period. However, the humble psyllium husk is linked to several health complications due to overconsumption. It has been found that fiber supplements made from psyllium might interfere with the body’s ability to absorb certain medications such as aspirin and carbamazepine. Hence, companies in the psyllium products market are increasing awareness to allow the individual’s body become accustomed to the added amounts of fiber. In order to avoid gastrointestinal side effects, companies are suggesting to gradually increase the consumption of psyllium products to prevent issues of gas and bloating.
Due to psyllium’s high nutritional values such as proteins, vitamin B1, glycosides, and the likes, companies in the market for psyllium products are aiming for their expansion in the global market. They are increasing awareness that gluten-free products are beneficial for brain health. Thus, companies are targeting gluten-free products for individuals suffering from brain fog and fatigue.
Coronavirus Creates Curiosity in Consumers for Fiber Supplements and Other Ayurvedic Products
The psyllium products market is suffering due to the growing COVID-19 (coronavirus) crisis, as several ayurvedic products suppliers have temporarily suspended their routine business activities. However, many individuals are growing increasingly aware about the benefits of psyllium products such as fiber supplements and powder in order to achieve optimum immunity. These efforts by individuals are being taken to combat the life-threatening symptoms of coronavirus. As such, there is a growing demand for tailored health solutions from leading biohackers in the psyllium products market, who are designing personalized regimens for individuals wanting to fight off infections.
Stakeholders in the ayurvedic products sector are increasing efforts to conduct video consultations through popular social media networking mobile apps to educate individuals on the advantages of psyllium and other medicinal fibers.
Stuck in a neck-to-neck competition with other brands? Request a custom report on Psyllium Products Market
Analysts’ Viewpoint
Though the COVID-19 outbreak has paralyzed routine business activities of companies in the psyllium products market, there is an increasing awareness about psyllium-induced fiber supplements and other ayurvedic products. The demand for natural ingredients is being met by pharmaceutical companies that are producing psyllium tablets and capsules for individuals suffering from high cholesterol and blood sugar levels.
Moreover, psyllium has promising growth potential in the bakery and confectionary sector. However, side effects of psyllium such as gastrointestinal complications due to overconsumption pose a barrier for its widespread adoption. Hence, companies should increase awareness about gradual dosage of psyllium products and encourage consumers to follow healthy lifestyle habits for effective results.
Psyllium Products Market: Overview
Psyllium Products: Market Frontrunners
Psyllium Products Market: Trends
Applications of Psyllium Products in Cosmetics and Personal Care Products to Aid Growth
Psyllium Products Market: Strategies
Target Region for Market
Psyllium Products Market: Players
1. Global Psyllium Products Market - Executive Summary
1.1. Global Psyllium Products Market Analysis
1.2. Application – Product Mapping
1.3. Competition Blueprint
1.4. Technology Time Line Mapping
1.5. TMR Analysis and Recommendations
2. Market Overview
2.1. Market Introduction
2.2. Market Definition
2.3. Market Taxonomy
3. Market Dynamics
3.1. Macro-economic Factors
3.1.1. Rise in Consumption of Food Items across Globe
3.1.2. Global and Regional Per Capita Food Consumption (kcal per capita per day)
3.1.3. Change in Consumer Price Indexes (Percentage Change) 2018 (Forecast)
3.1.4. Population of Key Countries
3.1.5. Food and Beverage Industry Overview
3.1.6. Global Retail Dynamics
3.1.7. Per Capita Disposable Income
3.1.8. Organized Retail Penetration
3.1.9. Middle Income Population Group
3.1.10. Global GDP Growth Outlook
3.2. Drivers
3.2.1. Economic Drivers
3.2.2. Supply Side Drivers
3.2.3. Demand Side Drivers
3.3. Market Restraints
3.4. Forecast Factors – Relevance and Impact
3.5. Key Regulations and Claims
3.5.1. Food Packaging Claims
3.5.2. Labeling and Claims
3.5.3. Import/Export Regulations
4. Food and Beverage Market Outlook
4.1. Food and Beverages Industry Overview
4.2. Food & Beverage Industry Key Indicators
4.3. Mega Trends Influencing the Food & Beverages Industry
4.4. Business Environment Outlook
4.4.1. North America
4.4.2. Europe
4.4.3. Asia Pacific
4.4.4. Latin America
4.4.5. Middle East and Africa
4.5. Nutraceuticals: Ways to Achieve Success
4.6. Transformation of Nutraceuticals Market
4.7. Convergence of Food and Pharmaceuticals
5. Product Innovation/ Development Trends
5.1. Cultural Customization to Target Specific Populations and Ethnic Groups
5.2. Creating New Delivery Mechanisms
5.3. Shift towards Natural Ingredients
5.4. Brand Differentiation through Packaging
5.5. Preferential Inclination towards Non-Modified Functional Ingredients
5.6. Transformed Packaging to Suit Customer Orientation
6. Product Oriented Market Buss
6.1. Common Product Categories Yet Influential
6.2. Attractive Segments for all Market Actors
6.3. Rare In Portfolio, Albeit Promises Value Chain
6.4. Transformed Products Attributes
6.5. Branding and Promotion Techniques
6.6. Factors Influencing Target Market Behavior
6.7. Mode of Advertisement
7. Policy and Regulatory Landscape
7.1. A Snapshot Of Global Regulations
7.2. Dietary Supplement Health and Education Act of 1994
7.3. FSSAI
7.4. Federal Food, Drug, and Cosmetic Act
7.5. Europe Food and Safety Authority
7.6. Food Packaging Claims
7.7. Label Claims for Conventional Foods and Dietary Supplements
8. Value Chain Analysis
8.1. Profitability and Gross Margin Analysis By Competition
8.2. List of Exporters from India for Psyllium Seed/Husk
9. Global Psyllium Products Market Analysis and Forecast
9.1. Market Size Analysis (2015-2019) and Forecast (2020-2030)
9.1.1. Market Value (US$ Mn) and Volume (Tons) and Y-o-Y Growth
9.1.2. Absolute $ Opportunity
9.2. Global Psyllium Products Market Scenario Forecast (Optimistic, Likely and Conservative Market Conditions)
9.2.1. Forecast Factors and Relevance of Impact
9.2.2. Regional Psyllium Products Market Business Performance Summary
10. Global Psyllium Products Market Pricing Analysis
10.1. Price Point Assessment by Region
10.1.1. Manufacturer Level Pricing
10.1.2. Distributor Level Pricing
10.1.3. Retailer Level Pricing
10.2. Price Point Assessment by Type
10.3. Price Forecast till 2030
11. Global Psyllium Products Market Analysis By Type
11.1. Introduction
11.1.1. Y-o-Y Growth Comparison By Type
11.1.2. Basis Point Share (BPS) Analysis By Type
11.2. Psyllium Products Market Size (US$ Mn) and Volume (MT) Analysis (2015-2019) & Forecast (2020-2030) By Type
11.2.1. Psyllium Seed
11.2.2. Psyllium Husk
11.2.2.1. Purity 85%
11.2.2.2. Purity 95%
11.2.2.3. Purity 98%
11.2.2.4. Purity 99%
11.2.3. Psyllium Husk Powder
11.3. Market Attractiveness Analysis By Type
12. Global Psyllium Products Market Analysis By Application
12.1. Introduction
12.1.1. Y-o-Y Growth Comparison By Application
12.1.2. Basis Point Share (BPS) Analysis By Application
12.2. Psyllium Products Market Size (US$ Mn) and Volume (MT) Analysis (2015-2019) & Forecast (2020-2030) By Application
12.2.1. Food & Beverage
12.2.1.1. Bakery & Confectionary
12.2.1.2. Ice Cream & Desserts
12.2.1.3. Flavoured & Health Drinks
12.2.1.4. Juice & Nectars
12.2.1.5. Breakfast Cereals & Instant Noodles
12.2.1.6. Processed & Packed Foods
12.2.1.7. Others
12.2.2. Pharmaceuticals
12.2.3. Dietary Supplements
12.2.4. Animal Feed
12.2.5. Others
12.3. Market Attractiveness Analysis By Application
13. Global Psyllium Products Market Analysis By Nature
13.1. Introduction
13.1.1. Y-o-Y Growth Comparison By Nature
13.1.2. Basis Point Share (BPS) Analysis By Nature
13.2. Psyllium Products Market Size (US$ Mn) and Volume (MT) Analysis (2015-2019) & Forecast (2020-2030) By Nature
13.2.1. Organic
13.2.2. Conventional
13.3. Market Attractiveness Analysis By Nature
14. Global Psyllium Products Market Analysis and Forecast, By Region
14.1. Introduction
14.1.1. Basis Point Share (BPS) Analysis By Region
14.1.2. Y-o-Y Growth Projections By Region
14.2. Psyllium Products Market Size (US$ Mn) and Volume (MT) & Forecast (2020-2030) Analysis By Region
14.2.1. North America
14.2.2. Europe
14.2.3. Asia Pacific
14.2.4. ROW
14.3. Market Attractiveness Analysis By Region
15. North America Psyllium Products Market Analysis and Forecast
15.1. Introduction
15.1.1. Basis Point Share (BPS) Analysis By Country
15.1.2. Y-o-Y Growth Projections By Country
15.2. Psyllium Products Market Size (Value (US$) and Volume (MT) Analysis (2015-2019) and Forecast (2020-2030)
15.2.1. Market Attractiveness By Country
15.2.1.1. U.S.
15.2.1.2. Canada
15.2.2. By Type
15.2.3. By Nature
15.2.4. By Application
15.3. Market Attractiveness Analysis
15.3.1. By Country
15.3.2. By Type
15.3.3. By Nature
15.3.4. By Application
15.4. Drivers and Restraints: Impact Analysis
16. Europe Psyllium Products Market Analysis and Forecast
16.1. Introduction
16.1.1. Basis Point Share (BPS) Analysis By Country
16.1.2. Y-o-Y Growth Projections By Country
16.1.3. Key Regulations
16.2. Psyllium Products Market Size (Value (US$) and Volume (MT) Analysis (2015-2019) and Forecast (2020-2030)
16.2.1. By Country
16.2.1.1. Germany
16.2.1.2. Italy
16.2.1.3. United Kingdom
16.2.1.4. France
16.2.1.5. Belgium
16.2.2. By Type
16.2.3. By Nature
16.2.4. By Application
16.3. Market Attractiveness Analysis
16.3.1. By Country
16.3.2. By Type
16.3.3. By Nature
16.3.4. By Application
16.4. Drivers and Restraints: Impact Analysis
17. Asia Pacific Psyllium Products Market Analysis and Forecast
17.1. Introduction
17.1.1. Basis Point Share (BPS) Analysis By Country
17.1.2. Y-o-Y Growth Projections By Country
17.1.3. Key Regulations
17.2. Psyllium Products Market Size (Value (US$) and Volume (MT) Analysis (2015-2019) and Forecast (2020-2030)
17.2.1. By Country
17.2.1.1. India
17.2.1.2. China
17.2.1.3. Pakistan
17.2.2. By Type
17.2.3. By Nature
17.2.4. By Application
17.3. Market Attractiveness Analysis
17.3.1. By Country
17.3.2. By Type
17.3.3. By Nature
17.3.4. By Application
17.4. Drivers and Restraints: Impact Analysis
18. Rest of the World Psyllium Products Market Analysis and Forecast
18.1. Introduction
18.1.1. Basis Point Share (BPS) Analysis By Country
18.1.2. Y-o-Y Growth Projections By Country
18.1.3. Key Regulations
18.2. Psyllium Products Market Size (Value (US$) and Volume (MT) Analysis (2015-2019) and Forecast (2020-2030)
18.2.1. By Country
18.2.1.1. Korea
18.2.1.2. Japan
18.2.1.3. Bangladesh
18.2.1.4. Denmark
18.2.1.5. Others
18.2.2. By Type
18.2.3. By Nature
18.2.4. By Application
18.3. Market Attractiveness Analysis
18.3.1. By Country
18.3.2. By Type
18.3.3. By Nature
18.3.4. By Application
18.4. Drivers and Restraints: Impact Analysis
19. Competition Assessment
19.1. Global Psyllium Products Market Competition - a Dashboard View
19.2. Global Psyllium Products Market Structure Analysis
19.3. Global Psyllium Products Market Country Share Analysis
19.4. Key Participants Market Presence (Intensity Mapping) by Region
20. Brand Assessment
20.1. Brand Identity (Brand as Product, Brand as Organization, Brand as Person, Brand as Symbol)
20.2. Psyllium Products Audience and Positioning (Demographic Segmentation, Geographic Segmentation, Psychographic Segmentation, Situational Segmentation)
20.3. Brand Strategy
21. Competition Deep-dive (Manufacturers/Suppliers)
21.1. Procter & Gamble (Metamucil),
21.1.1. Overview
21.1.2. Product Portfolio
21.1.3. Sales Footprint
21.1.4. Channel Footprint
21.1.4.1. Distributors List
21.1.4.2. Sales Channel (Clients)
21.1.5. Strategy Overview
21.1.5.1. Marketing Strategy
21.1.5.2. Culture Strategy
21.1.5.3. Channel Strategy
21.1.6. SWOT Analysis
21.1.7. Financial Analysis
21.1.8. Revenue Share
21.1.9. Key Clients
21.1.10. Analyst Comments
21.2. Nature’s Sunshine
21.2.1. Overview
21.2.2. Product Portfolio
21.2.3. Sales Footprint
21.2.4. Channel Footprint
21.2.4.1. Distributors List
21.2.4.2. Sales Channel (Clients)
21.2.5. Strategy Overview
21.2.5.1. Marketing Strategy
21.2.5.2. Culture Strategy
21.2.5.3. Channel Strategy
21.2.6. SWOT Analysis
21.2.7. Financial Analysis
21.2.8. Revenue Share
21.2.9. Key Clients
21.2.10. Analyst Comments
21.3. Dabur India Ltd.
21.3.1. Overview
21.3.2. Product Portfolio
21.3.3. Sales Footprint
21.3.4. Channel Footprint
21.3.4.1. Distributors List
21.3.4.2. Sales Channel (Clients)
21.3.5. Strategy Overview
21.3.5.1. Marketing Strategy
21.3.5.2. Culture Strategy
21.3.5.3. Channel Strategy
21.3.6. SWOT Analysis
21.3.7. Financial Analysis
21.3.8. Revenue Share
21.3.9. Key Clients
21.3.10. Analyst Comments
21.4. Nature's Bounty Co. (Puritan’s Pride)
21.4.1. Overview
21.4.2. Product Portfolio
21.4.3. Sales Footprint
21.4.4. Channel Footprint
21.4.4.1. Distributors List
21.4.4.2. Sales Channel (Clients)
21.4.5. Strategy Overview
21.4.5.1. Marketing Strategy
21.4.5.2. Culture Strategy
21.4.5.3. Channel Strategy
21.4.6. SWOT Analysis
21.4.7. Financial Analysis
21.4.8. Revenue Share
21.4.9. Key Clients
21.4.10. Analyst Comments
21.5. Rama Gum Industries (India) Limited
21.5.1. Overview
21.5.2. Product Portfolio
21.5.3. Sales Footprint
21.5.4. Channel Footprint
21.5.4.1. Distributors List
21.5.4.2. Sales Channel (Clients)
21.5.5. Strategy Overview
21.5.5.1. Marketing Strategy
21.5.5.2. Culture Strategy
21.5.5.3. Channel Strategy
21.5.6. SWOT Analysis
21.5.7. Financial Analysis
21.5.8. Revenue Share
21.5.9. Key Clients
21.5.10. Analyst Comments
21.6. Reckitt Benckiser Group plc.
21.6.1. Overview
21.6.2. Product Portfolio
21.6.3. Sales Footprint
21.6.4. Channel Footprint
21.6.4.1. Distributors List
21.6.4.2. Sales Channel (Clients)
21.6.5. Strategy Overview
21.6.5.1. Marketing Strategy
21.6.5.2. Culture Strategy
21.6.5.3. Channel Strategy
21.6.6. SWOT Analysis
21.6.7. Financial Analysis
21.6.8. Revenue Share
21.6.9. Key Clients
21.6.10. Analyst Comments
21.7. Patanjali Ayurveda, and
21.7.1. Overview
21.7.2. Product Portfolio
21.7.3. Sales Footprint
21.7.4. Channel Footprint
21.7.4.1. Distributors List
21.7.4.2. Sales Channel (Clients)
21.7.5. Strategy Overview
21.7.5.1. Marketing Strategy
21.7.5.2. Culture Strategy
21.7.5.3. Channel Strategy
21.7.6. SWOT Analysis
21.7.7. Financial Analysis
21.7.8. Revenue Share
21.7.9. Key Clients
21.7.10. Analyst Comments
21.8. Now Health Group, Inc.
21.8.1. Overview
21.8.2. Product Portfolio
21.8.3. Sales Footprint
21.8.4. Channel Footprint
21.8.4.1. Distributors List
21.8.4.2. Sales Channel (Clients)
21.8.5. Strategy Overview
21.8.5.1. Marketing Strategy
21.8.5.2. Culture Strategy
21.8.5.3. Channel Strategy
21.8.6. SWOT Analysis
21.8.7. Financial Analysis
21.8.8. Revenue Share
21.8.9. Key Clients
21.8.10. Analyst Comments
21.9. Others (On Request)
22. Scenario Assessment of the Impact of COVID-19 on Beverage Industry
22.1 Current Scenario/ Immediate Actions
22.1.1. Prepare for the worst, and be thankful if it doesn’t happen; a wait-and-see approach is a nonstarter
22.1.2. The recovery may not be a quick bounce-back; plan for multiple quarters of lower revenue
22.1.3. Encourage Collaboration and look beyond legacy approach
22.1.4. Address immediate challenges that COVID 19 represents to workforce, customers and partners
22.1.5. Address near Term cash management Challenges
22.2 Customers will change some behaviors permanently- accelerating prior trends; bold action now can set you up for success through the downturn and beyond
22.3 Market Scenario and the Forward Path
22.3.1 Global Beverage Industry Forecast Scenario Comparison of Annual Growth Rates for short Term (2020-2023) and Long Term (2024-2030)
22.3.1.1 Optimistic Scenario
22.3.1.1.1 China
22.3.1.1.2 U.S.
22.3.1.1.3 Euro Zone
22.3.1.1.4 Rest of the World
22.3.1.2 Likely Scenario
22.3.1.2.1 China
22.3.1.2.2 U.S.
22.3.1.2.3 Euro Zone
22.3.1.2.4 Rest of the World
22.3.1.3 Pessimistic Scenario
22.3.1.3.1 China
22.3.1.3.2 US
22.3.1.3.3 Euro Zone
22.3.1.3.4 Rest of the World
22.4 Key Factors Impacting the Market
22.5 Case Studies- Lessons from the companies that survived & thrived in the last recession.
23. Recommendation- Critical Success Factors
24. Research Methodology
25. Assumptions & Acronyms Used
List of Tables
Table 1: Psyllium Products Market Historical Value (US$ Mn) Analysis and Forecast by Type, 2015-2019
Table 2: Psyllium Products Market Historical Volume (MT) Analysis and Forecast by Type, 2015-2019
Table 3: Psyllium Products Market Value (US$ Mn) Analysis and Forecast by Type, 2020-2030
Table 4: Psyllium Products Market Volume (MT) Analysis and Forecast by Type, 2020-2030
Table 5: Psyllium Products Market Historical Value (US$ Mn) Analysis and Forecast by Nature, 2015-2019
Table 6: Psyllium Products Market Historical Volume (MT) Analysis and Forecast by Nature, 2015-2019
Table 7: Psyllium Products Market Value (US$ Mn) Analysis and Forecast by Nature, 2020-2030
Table 8: Psyllium Products Market Volume (MT) Analysis and Forecast by Nature, 2020-2030
Table 9: Psyllium Products Market Historical Value (US$ Mn) Analysis and Forecast by Application, 2015-2019
Table 10: Psyllium Products Market Historical Volume (MT) Analysis and Forecast by Application, 2015-2019
Table 11: Psyllium Products Market Value (US$ Mn) Analysis and Forecast by Application, 2020-2030
Table 12: Psyllium Products Market Volume (MT) Analysis and Forecast by Application, 2020-2030
Table 13: Psyllium Products Market Historical Value (US$ Mn) Analysis by Country, 2015-2019
Table 14: Psyllium Products Market Historical Volume (MT) Analysis by Country, 2015-2019
Table 15: Psyllium Products Market Historical Value (US$ Mn) Analysis and Forecast by Country, 2015-2019
Table 16: Psyllium Products Market Historical Volume (MT) Analysis and Forecast by Country, 2015-2019
Table 17: Psyllium Products Market Historical Value (US$ Mn) Analysis and Forecast by Type, 2015-2019
Table 18: Psyllium Products Market Historical Volume (MT) Analysis and Forecast by Type, 2015-2019
Table 19: Psyllium Products Market Value (US$ Mn) Analysis and Forecast by Type, 2020-2030
Table 20: Psyllium Products Market Volume (MT) Analysis and Forecast by Type, 2020-2030
Table 21: Psyllium Products Market Historical Value (US$ Mn) Analysis and Forecast by Nature, 2015-2019
Table 22: Psyllium Products Market Historical Volume (MT) Analysis and Forecast by Nature, 2015-2019
Table 23: Psyllium Products Market Value (US$ Mn) Analysis and Forecast by Nature, 2020-2030
Table 24: Psyllium Products Market Volume (MT) Analysis and Forecast by Nature, 2020-2030
Table 25: Psyllium Products Market Historical Value (US$ Mn) Analysis and Forecast by Application, 2015-2019
Table 26: Psyllium Products Market Historical Volume (MT) Analysis and Forecast by Application, 2015-2019
Table 27: Psyllium Products Market Value (US$ Mn) Analysis and Forecast by Application, 2020-2030
Table 28: Psyllium Products Market Volume (MT) Analysis and Forecast by Application, 2020-2030
Table 29: Psyllium Products Market Historical Value (US$ Mn) Analysis by Country, 2015-2019
Table 30: Psyllium Products Market Historical Volume (MT) Analysis by Country, 2015-2019
Table 31: Psyllium Products Market Historical Value (US$ Mn) Analysis and Forecast by Country, 2015-2019
Table 32: Psyllium Products Market Historical Volume (MT) Analysis and Forecast by Country, 2015-2019
Table 33: Psyllium Products Market Historical Value (US$ Mn) Analysis and Forecast by Type, 2015-2019
Table 34: Psyllium Products Market Historical Volume (MT) Analysis and Forecast by Type, 2015-2019
Table 35: Psyllium Products Market Value (US$ Mn) Analysis and Forecast by Type, 2020-2030
Table 36: Psyllium Products Market Volume (MT) Analysis and Forecast by Type, 2020-2030
Table 37: Psyllium Products Market Historical Value (US$ Mn) Analysis and Forecast by Nature, 2015-2019
Table 38: Psyllium Products Market Historical Volume (MT) Analysis and Forecast by Nature, 2015-2019
Table 39: Psyllium Products Market Value (US$ Mn) Analysis and Forecast by Nature, 2020-2030
Table 40: Psyllium Products Market Volume (MT) Analysis and Forecast by Nature, 2020-2030
Table 41: Psyllium Products Market Historical Value (US$ Mn) Analysis and Forecast by Application, 2015-2019
Table 42: Psyllium Products Market Historical Volume (MT) Analysis and Forecast by Application, 2015-2019
Table 43: Psyllium Products Market Value (US$ Mn) Analysis and Forecast by Application, 2020-2030
Table 44: Psyllium Products Market Volume (MT) Analysis and Forecast by Application, 2020-2030
Table 45: Psyllium Products Market Historical Value (US$ Mn) Analysis by Country, 2015-2019
Table 46: Psyllium Products Market Historical Volume (MT) Analysis by Country, 2015-2019
Table 47: Psyllium Products Market Historical Value (US$ Mn) Analysis and Forecast by Country, 2015-2019
Table 48: Psyllium Products Market Historical Volume (MT) Analysis and Forecast by Country, 2015-2019
Table 49: Psyllium Products Market Historical Value (US$ Mn) Analysis and Forecast by Type, 2015-2019
Table 50: Psyllium Products Market Historical Volume (MT) Analysis and Forecast by Type, 2015-2019
Table 51: Psyllium Products Market Value (US$ Mn) Analysis and Forecast by Type, 2020-2030
Table 52: Psyllium Products Market Volume (MT) Analysis and Forecast by Type, 2020-2030
Table 53: Psyllium Products Market Historical Value (US$ Mn) Analysis and Forecast by Nature, 2015-2019
Table 54: Psyllium Products Market Historical Volume (MT) Analysis and Forecast by Nature, 2015-2019
Table 55: Psyllium Products Market Value (US$ Mn) Analysis and Forecast by Nature, 2020-2030
Table 56: Psyllium Products Market Volume (MT) Analysis and Forecast by Nature, 2020-2030
Table 57: Psyllium Products Market Historical Value (US$ Mn) Analysis and Forecast by Application, 2015-2019
Table 58: Psyllium Products Market Historical Volume (MT) Analysis and Forecast by Application, 2015-2019
Table 59: Psyllium Products Market Value (US$ Mn) Analysis and Forecast by Application, 2020-2030
Table 60: Psyllium Products Market Volume (MT) Analysis and Forecast by Application, 2020-2030
Table 61: Psyllium Products Market Historical Value (US$ Mn) Analysis by Country, 2015-2019
Table 62: Psyllium Products Market Historical Volume (MT) Analysis by Country, 2015-2019
Table 63: Psyllium Products Market Historical Value (US$ Mn) Analysis and Forecast by Country, 2015-2019
Table 64: Psyllium Products Market Historical Volume (MT) Analysis and Forecast by Country, 2015-2019
Table 65: Psyllium Products Market Historical Value (US$ Mn) Analysis and Forecast by Type, 2015-2019
Table 66: Psyllium Products Market Historical Volume (MT) Analysis and Forecast by Type, 2015-2019
Table 67: Psyllium Products Market Value (US$ Mn) Analysis and Forecast by Type, 2020-2030
Table 68: Psyllium Products Market Volume (MT) Analysis and Forecast by Type, 2020-2030
Table 69: Psyllium Products Market Historical Value (US$ Mn) Analysis and Forecast by Nature, 2015-2019
Table 70: Psyllium Products Market Historical Volume (MT) Analysis and Forecast by Nature, 2015-2019
Table 71: Psyllium Products Market Value (US$ Mn) Analysis and Forecast by Nature, 2020-2030
Table 72: Psyllium Products Market Volume (MT) Analysis and Forecast by Nature, 2020-2030
Table 73: Psyllium Products Market Historical Value (US$ Mn) Analysis and Forecast by Application, 2015-2019
Table 74: Psyllium Products Market Historical Volume (MT) Analysis and Forecast by Application, 2015-2019
Table 75: Psyllium Products Market Value (US$ Mn) Analysis and Forecast by Application, 2020-2030
Table 76: Psyllium Products Market Volume (MT) Analysis and Forecast by Application, 2020-2030
List of Figure
Figure 01: Global Psyllium Products Market Size and Incremental $ Opportunity (US$ Mn), 2020-2030
Figure 02: Global Psyllium Products Market Value (US$ Mn) Scenario Forecast, 2020 & 2030
Figure 03: Global Psyllium Products Market Value Share (%) and BPS Analysis by Type, 2015, 2020 & 2030
Figure 04: Global Psyllium Products Market Volume (MT) Analysis by Type, 2020 & 2030
Figure 05: Global Psyllium Products Market Incremental Value (US$ Mn), by Type, 2015-2030
Figure 06: Global Psyllium Products Market Attractiveness, by Type, 2020-2030
Figure 07: Global Psyllium Products Market Value Share (%) and BPS Analysis by Nature, 2015, 2020 & 2030
Figure 08: Global Psyllium Products Market Volume (MT) Analysis by Nature, 2020 & 2030
Figure 09: Global Psyllium Products Market Incremental Value (US$ Mn), by Nature, 2015-2030
Figure 10: Global Psyllium Products Market Attractiveness, by Nature, 2020-2030
Figure 11: Global Psyllium Products Market Value Share (%) and BPS Analysis by Application, 2015, 2020 & 2030
Figure 12: Global Psyllium Products Market Volume (MT) Analysis by Application, 2020 & 2030
Figure 13: Global Psyllium Products Market Incremental Value (US$ Mn), by Application, 2015-2030
Figure 14: Global Psyllium Products Market Attractiveness, by Application, 2020-2030
Figure 15: Global Psyllium Products Market Value Share (%) and BPS Analysis by Region, 2015, 2020 & 2030
Figure 16: Global Psyllium Products Market Y-o-Y Growth (%) Projections by Segment, 2020-2030
Figure 17: North America Psyllium Products Market Value and Volume Analysis, 2020-2030
Figure 18: Europe Psyllium Products Market Value and Volume Analysis, 2020-2030
Figure 19: Asia Pacific Psyllium Products Market Value and Volume Analysis, 2020-2030
Figure 20: GRest of the World Psyllium Products Market Value and Volume Analysis, 2020-2030
Figure 21: North America Psyllium Products Incremental $ Opportunity Analysis, 2020-2030
Figure 22: Europe Psyllium Products Incremental $ Opportunity Analysis, 2020-2030
Figure 23: Asia Pacific Psyllium Products Incremental $ Opportunity Analysis, 2020-2030
Figure 24: Rest of the World Psyllium Products Incremental $ Opportunity Analysis, 2020-2030
Figure 25: Global Psyllium Products Market Attractiveness Analysis, by Region 2020-2030
Figure 26: North America Psyllium Products Market Value BPS Analysis, by Country, 2020 & 2030
Figure 27: U.S. Psyllium Products Market Incremental $ Opportunity, 2020-2030
Figure 28: GCanada Psyllium Products Market Incremental $ Opportunity, 2020-2030
Figure 29: North America Psyllium Products Market Value Share (%) and BPS Analysis by Type, 2015, 2020 & 2030
Figure 30: North America Psyllium Products Market Volume (MT) Analysis by Type, 2020 & 2030
Figure 31: North America Psyllium Products Market Incremental Value (US$ Mn), by Type, 2015-2030
Figure 32: North America Psyllium Products Market Attractiveness, by Type, 2020-2030
Figure 33: North America Psyllium Products Market Value Share (%) and BPS Analysis by Nature, 2015, 2020 & 2030
Figure 34: North America Psyllium Products Market Volume (MT) Analysis by Nature, 2020 & 2030
Figure 35: North America Psyllium Products Market Incremental Value (US$ Mn), by Nature, 2015-2030
Figure 36: North America Psyllium Products Market Attractiveness, by Nature, 2020-2030
Figure 37: North America Psyllium Products Market Value Share (%) and BPS Analysis by Application, 2015, 2020 & 2030
Figure 38: North America Psyllium Products Market Volume (MT) Analysis by Application, 2020 & 2030
Figure 39: North America Psyllium Products Market Incremental Value (US$ Mn), by Application, 2015-2030
Figure 40: North America Psyllium Products Market Attractiveness, by Application, 2020-2030
Figure 41: Europe Psyllium Products Market Value BPS Analysis, by Country, 2020 & 2030
Figure 42: Europe Psyllium Products Market Value BPS Analysis, by Country, 2020 & 2030
Figure 43: Germany Psyllium Products Incremental $ Opportunity Analysis, 2020-2030
Figure 44: Italy Psyllium Products Incremental $ Opportunity Analysis, 2020-2030
Figure 45: United Kingdom Psyllium Products Incremental $ Opportunity Analysis, 2020-2030
Figure 46: France Psyllium Products Market Incremental $ Opportunity, 2020-2030
Figure 47: Belgium Psyllium Products Market Incremental $ Opportunity, 2020-2030
Figure 48: Europe Psyllium Products Market Value Share (%) and BPS Analysis by Type, 2015, 2020 & 2030
Figure 49: Europe Psyllium Products Market Volume (MT) Analysis by Type, 2020 & 2030
Figure 50: Europe Psyllium Products Market Incremental Value (US$ Mn), by Type, 2015-2030
Figure 51: Europe Psyllium Products Market Attractiveness, by Type, 2020-2030
Figure 52: Europe Psyllium Products Market Value Share (%) and BPS Analysis by Nature, 2015, 2020 & 2030
Figure 53: Europe Psyllium Products Market Volume (MT) Analysis by Nature, 2020 & 2030
Figure 54: Europe Psyllium Products Market Incremental Value (US$ Mn), by Nature, 2015-2030
Figure 55: Europe Psyllium Products Market Attractiveness, by Nature, 2020-2030
Figure 56: Europe Psyllium Products Market Value Share (%) and BPS Analysis by Application, 2015, 2020 & 2030
Figure 57: Europe Psyllium Products Market Volume (MT) Analysis by Application, 2020 & 2030
Figure 58: Europe Psyllium Products Market Incremental Value (US$ Mn), by Application, 2015-2030
Figure 59: Europe Psyllium Products Market Attractiveness, by Application, 2020-2030
Figure 60: Asia Pacific Psyllium Products Market Value BPS Analysis, by Country, 2020 & 2030
Figure 61: India Psyllium Products Incremental $ Opportunity Analysis, 2020-2030
Figure 62: China Psyllium Products Incremental $ Opportunity Analysis, 2020-2030
Figure 63: Pakistan Psyllium Products Incremental $ Opportunity Analysis, 2020-2030
Figure 64: Asia Pacific Psyllium Products Market Value Share (%) and BPS Analysis by Type, 2015, 2020 & 2030
Figure 65: Asia Pacific Psyllium Products Market Volume (MT) Analysis by Type, 2020 & 2030
Figure 66: Asia Pacific Psyllium Products Market Incremental Value (US$ Mn), by Type, 2015-2030
Figure 67: Asia Pacific Psyllium Products Market Attractiveness, by Type, 2020-2030
Figure 68: Asia Pacific Psyllium Products Market Value Share (%) and BPS Analysis by Nature, 2015, 2020 & 2030
Figure 69: Asia Pacific Psyllium Products Market Volume (MT) Analysis by Nature, 2020 & 2030
Figure 70: Asia Pacific Psyllium Products Market Incremental Value (US$ Mn), by Nature, 2015-2030
Figure 71: Asia Pacific Psyllium Products Market Attractiveness, by Nature, 2020-2030
Figure 72: Asia Pacific Psyllium Products Market Value Share (%) and BPS Analysis by Application, 2015, 2020 & 2030
Figure 73: Asia Pacific Psyllium Products Market Volume (MT) Analysis by Application, 2020 & 2030
Figure 74: Asia Pacific Psyllium Products Market Incremental Value (US$ Mn), by Application, 2015-2030
Figure 75: Asia Pacific Psyllium Products Market Attractiveness, by Application, 2020-2030
Figure 76: Rest of the World Psyllium Products Market Value BPS Analysis, by Country, 2020 & 2030
Figure 77: Rest of the World Psyllium Products Market Value BPS Analysis, by Country, 2020 & 2030
Figure 78: Korea Psyllium Products Incremental $ Opportunity Analysis, 2020-2030
Figure 79: Japan Psyllium Products Incremental $ Opportunity Analysis, 2020-2030
Figure 80: Bangladesh Psyllium Products Incremental $ Opportunity Analysis, 2020-2030
Figure 81: Denmark Psyllium Products Market Incremental $ Opportunity, 2020-2030
Figure 82: Rest Psyllium Products Market Incremental $ Opportunity, 2020-2030
Figure 83: Rest of the World Psyllium Products Market Value Share (%) and BPS Analysis by Type, 2015, 2020 & 2030
Figure 84: Rest of the World Psyllium Products Market Volume (MT) Analysis by Type, 2020 & 2030
Figure 85: Rest of the World Psyllium Products Market Incremental Value (US$ Mn), by Type, 2015-2030
Figure 86: Rest of the World Psyllium Products Market Attractiveness, by Type, 2020-2030
Figure 87: Rest of the World Psyllium Products Market Value Share (%) and BPS Analysis by Nature, 2015, 2020 & 2030
Figure 88: Rest of the World Psyllium Products Market Volume (MT) Analysis by Nature, 2020 & 2030
Figure 89: Rest of the World Psyllium Products Market Incremental Value (US$ Mn), by Nature, 2015-2030
Figure 90: Rest of the World Psyllium Products Market Attractiveness, by Nature, 2020-2030
Figure 91: Rest of the World Psyllium Products Market Value Share (%) and BPS Analysis by Application, 2015, 2020 & 2030
Figure 92: Rest of the World Psyllium Products Market Volume (MT) Analysis by Application, 2020 & 2030
Figure 93: Rest of the World Psyllium Products Market Incremental Value (US$ Mn), by Application, 2015-2030
Figure 94: Rest of the World Psyllium Products Market Attractiveness, by Application, 2020-2030
Copyright © Transparency Market Research, Inc. All Rights reserved
Trust Online

Psyllium Products Market