Reports
Reports
PRP (Platelet-Rich Plasma) and PRF (Platelet-Rich Fibrin) are gaining popularity in the cosmetics industry as natural, non-invasive treatments for triggering skin regeneration, collagen formation, and hair growth. The therapies encompass drawing the patient's own blood, processing it to enrich platelets and growth factors, and injecting it back into targeted areas to refine skin texture, erase wrinkles, obliterate scars, and stimulate hair growth.

Their popularity comes in being autologous and minimally invasive, with fewer chances of allergic reactions or complications than with synthetic fillers or surgery. Increasing demand for regenerative and customized beauty coupled with technological innovation in centrifuge devices and treatment protocols are the major drivers of the market.
Increased understanding of anti-aging treatment and high demand for safer, "natural" cosmetic procedures are also driving forces. There are, however, some restraints to the market. High cost of procedures and absence of insurance coverage restrict access for most consumers. Furthermore, the unavailability of standardized treatment protocols can result in variable outcomes, and there remains insufficient large-scale clinical evidence to support the long-term efficacy of PRP and PRF in cosmetic applications.

Platelet-Rich Plasma (PRP) and Platelet-Rich Fibrin (PRF) could be referred to advanced regenerative treatments that utilize the body’s own healing properties for rejuvenating the skin. PRP involves extraction of a small sample of blood, processing it to concentrate the plasma and filter out the red blood cells, and injecting the plasma into targeted areas for stimulating collagen production.
PRF, one of the more advanced forms, not only concentrates platelets but also contains a higher quantity of fibrin and white blood cells, thereby promoting enhanced healing and tissue regeneration. Both the procedures can be performed either through microneedling or through shallow injections into one’s skin.
| Attribute | Detail |
|---|---|
| Market Drivers |
|
Growing awareness about aesthetics and increasing buying power of consumers are likely to help fuel the global PRP and PRF in cosmetics market over the forecast period. With trends shifting toward evolving beauty standards and a role whereby social media changes perceptions around self-image, more number of people are beginning to learn about the availability and advantages of new aesthetic treatments.
This increased consciousness is not restricted to the historically high-end cosmetics markets but quickly spreading throughout emerging markets in which access to information and cosmetic services is growing. In tandem, rising disposable income is making it easier for a greater number of individuals to afford elective cosmetic procedures such as PRP and PRF therapies. These procedures are seen as affordable and appealing alternatives for individuals who want results without the risk of invasive surgery.
According to data published by International Society of Aesthetic Plastic Surgery in 2024, the number of aesthetic procedures worldwide—both surgical and non-surgical—rose by 3.4%, reaching approximately 34.9 million, reflecting the ongoing and expanding interest in cosmetic procedures.
The increasing consumer demand for minimally invasive, natural aesthetic procedures will play a role in global PRP and PRF in cosmetics market growth. People want treatments with subtle, non-invasive natural-looking results over surgery or synthetic product usage. Unlike traditional facial surgeries, PRP and PRF now allow individuals to use one’s own blood or cell component of blood to additionally help the body's process of healing and regenerative effect, thereby providing individuals with more natural and individual measures of patient care and treatment.
Plus, with the current trend of PRP and PRF providing facial rejuvenation, hair restoration, and scar reduction treatments, those who have tried and benefited from treating their skin conditions with PRP and PRF, are happy with the improvement in their skin texture and increased skin tone with little or no downtime or negative side-effects. Additionally, the media, PRP and PRF’s public awareness, and a growing social trend to age gracefully, , have all attributed to more individuals moving toward less invasive and natural options to accepted plastic surgery choices
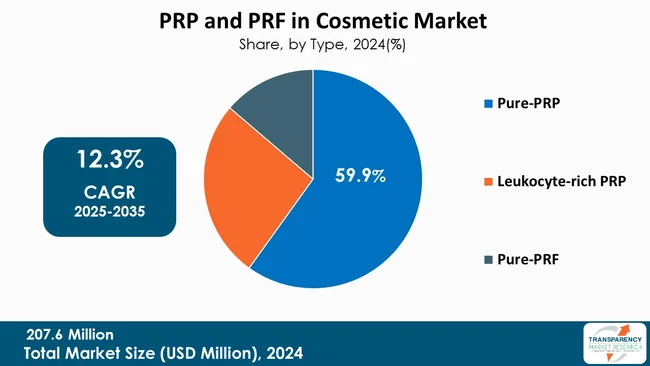
Pure-PRP (Platelet-Rich Plasma) is the dominating type in the PRP and PRF cosmetics market due to its established clinical efficacy across a broad spectrum of aesthetic procedures including skin rejuvenation, acne scar repair, and hair restoration that it holds a major market share. Pure-PRP has been discovered to provide high platelet concentrations with low red and white blood cell contamination, further contributing to its regenerative and healing properties. Its popularity among clinicians and patients has been fueled by the non-invasive treatment modality, minimal downtime, and increasing demand for autologous (natural) treatment. Thus, Pure-PRP has become an early adopter in cosmetic dermatology clinics everywhere, particularly in those countries where high-end aesthetic treatments are the standard of care.
Conversely, the Pure-PRF (Platelet-Rich Fibrin) segment is expected to have the highest Compound Annual Growth Rate (CAGR) in the PRP and PRF cosmetics market. While still relatively new to PRP, Pure-PRF is increasingly being sought out more often with the provision of longer-term regenerative benefits and higher biological activity from utilizing a fibrin matrix releasing growth factors slowly over time. This makes it particularly appealing for tissue repair and skin healing in cosmetic therapy. Pure-PRF is not needed, either when anticoagulants or additives are added, and it's also more biologically compatible and natural. With further development of clinical experience with PRF benefits and new therapeutic applications, more practitioners are resorting to Pure-PRF for use in their own practices. Such growing uptake, added to growing active consumer demand for more natural and longer-term cosmetic treatments, is driving the sector's explosive expansion globally.

| Detail | Attribute |
|---|---|
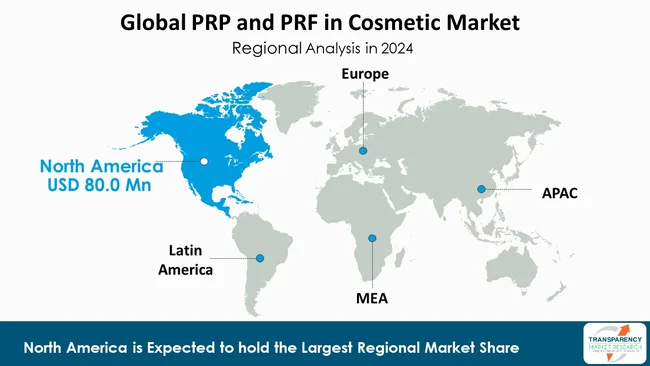
| Leading Region | North America |
North America’s PRP and PRF cosmetics market is driven by the rise of inorganic growth strategies such as strategic distribution agreements, which enhance product availability and accelerate market penetration
For instance, In May 2022, Estar Medical, the maker of Eclipse PRP and Tropocells, signed an exclusive long-term marketing and distribution agreement with Aesthetic Management Partners, LLC (AMP) to sell its PRP products in the U.S. market. Under this agreement, Estar’s globally recognized PRP system Cellenis is distributed across the U.S. market, enhancing its accessibility to clinics and medspas and supporting wider adoption of regenerative aesthetic therapies
The Asia-Pacific is expected to have the highest Compound Annual Growth Rate (CAGR) in the cosmetic sector's Platelet-Rich Plasma (PRP) and Platelet-Rich Fibrin (PRF) markets. This is primarily driven by increasing consumer demand for non-surgical, regenerative cosmetic treatments underpinned by rising disposable incomes, higher beauty consciousness, and rising awareness of advanced cosmetic treatments in China, Japan, South Korea, and India. In addition to that, the fast-paced growth of medical tourism, especially in the case of Thailand and South Korea, along with innovations in technology and the accessibility of certified dermatologists as well as cosmetic surgeons, is also driving market growth. Efforts by the government to improve healthcare infrastructure and increased investment by prominent industry players are also leading the way for the region's staggering CAGR for this segment.
Stryker Corporation, Zimmer Biomet Holdings, Inc., Terumo Medical Corporation, Croma-Pharma GmbH, Isto Biologics, Exactech, Inc., EmCyte Corporation, DePuy Synthes (Johnson & Johnson), ThermoGenesis Holdings, Inc, Arthrex GmbH (Arthrex Aesthetics), Regen Lab, Apex Biologix, Factor Medical, Inc., Fidia Farmaceutici S.p.A. and Estar Technologies Ltd (Estar Medical) are the key players in the PRP and PRF in cosmetics market.
Each of these players has been profiled in the PRP and PRF in cosmetics market research report based on parameters such as company overview, financial overview, business strategies, product portfolio, business segments, and recent developments.
| Attribute | Detail |
|---|---|
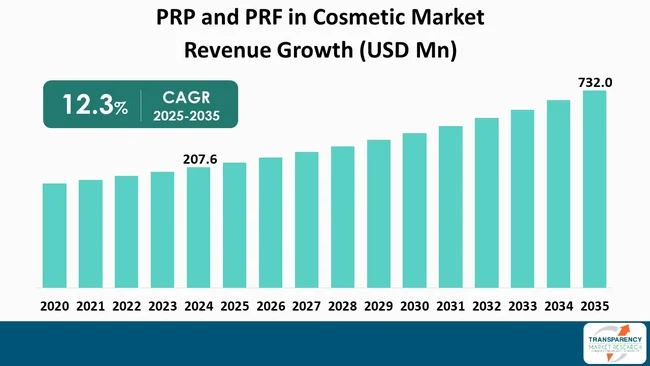
| Size in 2024 | US$ 207.6 Mn |
| Forecast Value in 2035 | More than US$ 732.0 Mn |
| CAGR | 12.3% |
| Forecast Period | 2025–2035 |
| Historical Data Available for | 2020–2023 |
| Quantitative Units | US$ Mn for Value |
| Market Analysis | It includes segment analysis as well as regional level analysis. Moreover, qualitative analysis includes drivers, restraints, opportunities, key trends, value chain analysis, and key trend analysis. |
| Competition Landscape |
|
| Format | Electronic (PDF) + Excel |
| Segmentation | By Type
|
| Regions Covered |
|
| Countries Covered |
|
| Companies Profiled |
|
| Customization Scope | Available upon request |
| Pricing | Available upon request |
It was valued at US$ 207.6 Mn in 2024
It is projected to cross US$ 732.0 Mn by the end of 2035
Increasing awareness about aesthetics & spending power, rising consumer demand for minimally invasive, natural aesthetic procedures and expansion of PRP/PRF into body sculpting applications
It is anticipated to grow at a CAGR of 12.3% from 2025 to 2035
North America is expected to account for the largest share from 2025 to 2035
Stryker Corporation, Zimmer Biomet Holdings, Inc., Terumo Medical Corporation, Croma-Pharma GmbH, Isto Biologics, Exactech, Inc., EmCyte Corporation, DePuy Synthes (Johnson & Johnson), ThermoGenesis Holdings, Inc, Arthrex GmbH (Arthrex Aesthetics), Regen Lab, Apex Biologix, Factor Medical, Inc., Fidia Farmaceutici S.p.A. and Estar Technologies Ltd (Estar Medical)
Table 01: Global Market Value (US$ Mn) Forecast, by Type, 2020 to 2035
Table 02: Global Market Value (US$ Mn) Forecast, by Origin, 2020 to 2035
Table 03: Global Market Value (US$ Mn) Forecast, By Cosmetic Application, 2020 to 2035
Table 04: Global Market Value (US$ Mn) Forecast, By Region, 2020 to 2035
Table 05: North America Market Value (US$ Mn) Forecast, by Country, 2020-2035
Table 06: North America Market Value (US$ Mn) Forecast, By Type, 2020 to 2035
Table 07: North America Market Value (US$ Mn) Forecast, By Origin, 2020 to 2035
Table 08: North America Market Value (US$ Mn) Forecast, By Cosmetic Application, 2020 to 2035
Table 09: Europe Market Value (US$ Mn) Forecast, by Country / Sub-region, 2020-2035
Table 10: Europe Market Value (US$ Mn) Forecast, By Type, 2020 to 2035
Table 11: Europe Market Value (US$ Mn) Forecast, By Origin, 2020 to 2035
Table 12: Europe Market Value (US$ Mn) Forecast, By Cosmetic Application, 2020 to 2035
Table 13: Asia Pacific Market Value (US$ Mn) Forecast, by Country / Sub-region, 2020-2035
Table 14: Asia Pacific Market Value (US$ Mn) Forecast, By Type, 2020 to 2035
Table 15: Asia Pacific Market Value (US$ Mn) Forecast, By Origin, 2020 to 2035
Table 16: Asia Pacific Market Value (US$ Mn) Forecast, By Cosmetic Application, 2020 to 2035
Table 17: Latin America Market Value (US$ Mn) Forecast, by Country / Sub-region, 2020-2035
Table 18: Latin America Market Value (US$ Mn) Forecast, By Type, 2020 to 2035
Table 19: Latin America Market Value (US$ Mn) Forecast, By Origin, 2020 to 2035
Table 20: Latin America Market Value (US$ Mn) Forecast, By Cosmetic Application, 2020 to 2035
Table 21: Middle East & Africa Market Value (US$ Mn) Forecast, by Country / Sub-region, 2020-2035
Table 22: Middle East & Africa Market Value (US$ Mn) Forecast, By Type, 2020 to 2035
Table 23: Middle East & Africa Market Value (US$ Mn) Forecast, By Origin, 2020 to 2035
Table 24: Middle East & Africa Market Value (US$ Mn) Forecast, By Cosmetic Application, 2020 to 2035
Figure 01: Global Market Value Share Analysis, by Type, 2024 and 2035
Figure 02: Global Market Attractiveness Analysis, by Type, 2025 to 2035
Figure 03: Global Market Revenue (US$ Mn), by Pure-PRP, 2020 to 2035
Figure 04: Global Market Revenue (US$ Mn), by Leukocyte-rich PRP, 2020 to 2035
Figure 05: Global Market Revenue (US$ Mn), by Pure-PRF, 2020 to 2035
Figure 06: Global Market Value Share Analysis, by Origin, 2024 and 2035
Figure 07: Global Market Attractiveness Analysis, by Origin, 2025 to 2035
Figure 08: Global Market Revenue (US$ Mn), by Autologous, 2020 to 2035
Figure 09: Global Market Revenue (US$ Mn), by Allogenic, 2020 to 2035
Figure 10: Global Market Revenue (US$ Mn), by Homologous, 2020 to 2035
Figure 11: Global Market Value Share Analysis, By Cosmetic Application, 2024 and 2035
Figure 12: Global Market Attractiveness Analysis, By Cosmetic Application, 2025 to 2035
Figure 13: Global Market Revenue (US$ Mn), by Skin Rejuvenation, 2020 to 2035
Figure 14: Global Market Revenue (US$ Mn), by Face Lift, 2020 to 2035
Figure 15: Global Market Revenue (US$ Mn), by Hair Application, 2020 to 2035
Figure 16: Global Market Revenue (US$ Mn), by Plastic Surgery, 2020 to 2035
Figure 17: Global Market Revenue (US$ Mn), by Scar-Related Treatment, 2020 to 2035
Figure 18: Global Market Revenue (US$ Mn), by Others, 2020 to 2035
Figure 19: Global Market Value Share Analysis, By Region, 2024 and 2035
Figure 20: Global Market Attractiveness Analysis, By Region, 2025 to 2035
Figure 21: North America Market Value (US$ Mn) Forecast, 2020 to 2035
Figure 22: North America Market Value Share Analysis, by Country, 2024 and 2035
Figure 23: North America Market Attractiveness Analysis, by Country, 2025 to 2035
Figure 24: North America Market Value Share Analysis, By Type, 2024 and 2035
Figure 25: North America Market Attractiveness Analysis, By Type, 2025 to 2035
Figure 26: North America Market Value Share Analysis, By Origin, 2024 and 2035
Figure 27: North America Market Attractiveness Analysis, By Origin, 2025 to 2035
Figure 28: North America Market Value Share Analysis, By Cosmetic Application, 2024 and 2035
Figure 29: North America Market Attractiveness Analysis, By Cosmetic Application, 2025 to 2035
Figure 30: Europe Market Value (US$ Mn) Forecast, 2020 to 2035
Figure 31: Europe Market Value Share Analysis, by Country / Sub-region, 2024 and 2035
Figure 32: Europe Market Attractiveness Analysis, by Country / Sub-region, 2025 to 2035
Figure 33: Europe Market Value Share Analysis, By Type, 2024 and 2035
Figure 34: Europe Market Attractiveness Analysis, By Type, 2025 to 2035
Figure 35: Europe Market Value Share Analysis, By Origin, 2024 and 2035
Figure 36: Europe Market Attractiveness Analysis, By Origin, 2025 to 2035
Figure 37: Europe Market Value Share Analysis, By Cosmetic Application, 2024 and 2035
Figure 38: Europe Market Attractiveness Analysis, By Cosmetic Application, 2025 to 2035
Figure 39: Asia Pacific Market Value (US$ Mn) Forecast, 2020 to 2035
Figure 40: Asia Pacific Market Value Share Analysis, by Country/Sub-region, 2024 and 2035
Figure 41: Asia Pacific Market Attractiveness Analysis, by Country/Sub-region, 2025 to 2035
Figure 42: Asia Pacific Market Value Share Analysis, By Type, 2024 and 2035
Figure 43: Asia Pacific Market Attractiveness Analysis, By Type, 2025 to 2035
Figure 44: Asia Pacific Market Value Share Analysis, By Origin, 2024 and 2035
Figure 45: Asia Pacific Market Attractiveness Analysis, By Origin, 2025 to 2035
Figure 46: Asia Pacific Market Value Share Analysis, By Cosmetic Application, 2024 and 2035
Figure 47: Asia Pacific Market Attractiveness Analysis, By Cosmetic Application, 2025 to 2035
Figure 48: Latin America Market Value (US$ Mn) Forecast, 2020 to 2035
Figure 49: Latin America Market Value Share Analysis, by Country / Sub-region, 2024 and 2035
Figure 50: Latin America Market Attractiveness Analysis, by Country / Sub-region, 2025 to 2035
Figure 51: Latin America Market Value Share Analysis, By Type, 2024 and 2035
Figure 52: Latin America Market Attractiveness Analysis, By Type, 2025 to 2035
Figure 53: Latin America Market Value Share Analysis, By Origin, 2024 and 2035
Figure 54: Latin America Market Attractiveness Analysis, By Origin, 2025 to 2035
Figure 55: Latin America Market Value Share Analysis, By Cosmetic Application, 2024 and 2035
Figure 56: Latin America Market Attractiveness Analysis, By Cosmetic Application, 2025 to 2035
Figure 57: Middle East & Africa Market Value (US$ Mn) Forecast, 2020 to 2035
Figure 58: Middle East & Africa Market Value Share Analysis, by Country / Sub-region, 2024 and 2035
Figure 59: Middle East & Africa Market Attractiveness Analysis, by Country / Sub-region, 2025 to 2035
Figure 60: Middle East & Africa Market Value Share Analysis, By Type, 2024 and 2035
Figure 61: Middle East & Africa Market Attractiveness Analysis, By Type, 2025 to 2035
Figure 62: Middle East & Africa Market Value Share Analysis, By Origin, 2024 and 2035
Figure 63: Middle East & Africa Market Attractiveness Analysis, By Origin, 2025 to 2035
Figure 64: Middle East & Africa Market Value Share Analysis, By Cosmetic Application, 2024 and 2035
Figure 65: Middle East & Africa Market Attractiveness Analysis, By Cosmetic Application, 2025 to 2035