
Reports
Reports
Analysts’ Viewpoint on Market Scenario
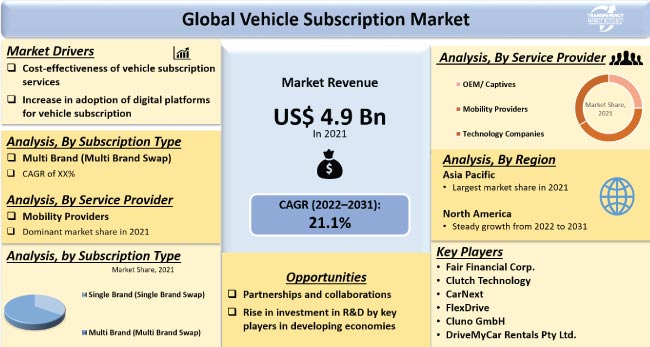
The global automotive subscription industry is witnessing a key transition phase due to the advent of digital platforms. Customer mobility expectations are evolving as a result of the penetration of new technologies that give rise to creative goods and services. This is augmenting vehicle subscription industry growth.
Owning a car is still significant for many people; however, service-oriented businesses are predicted to have tremendous development potential in the near future. Additionally, presently, automakers, rental businesses, and innovators are introducing car subscription programs that are risk-free and highly flexible, owing to the present economic unrest. Among the subscription type, multi-brand subscription services are gaining popularity, as they offer the freedom of switching brands.
Vehicle subscription is an entirely new method of getting a brand new car without having to buy or own one. It is a much more flexible process than conventional car ownership, and even more affordable. Consumers can lease a brand new car of their choice with zero down payment and zero road tax. After completing a lock-in period stated by the service provider, there is an option to keep using it for as long as the consumer wants at flat monthly charges, or he can opt-out anytime between the given time period. Furthermore, if the consumer wants to own the car, he can acquire (buy) it from the service provider at a pre-determined settlement charge.
Automotive OEMs and technology companies are making significant investments to develop their core business models such as own vehicles vs. management of 3rd party fleets and new vs. used vehicles, by variable subscription offerings. Additionally, they are implying brand strategy such as own brand only vs. own brand plus white label offerings for vehicle owners. Based on service type, the mobility providers segment is expected to dominate the global market during the forecast period.
The flexibility and ease of exploring new products and mobility alternatives via online platforms have driven the market for car subscriptions in the last decade. Rising propensity among consumers to use new services has sparked a significant shift in the car retailing industry. Car dealership is one of the most important aspects in determining consumer choices; however, penetration of various digital platforms is likely to increase considerably in the next few years. Additionally, modern consumers are more willing to pay their bills through digital channels, which has led to a consistent rise in demand for vehicle subscriptions, particularly in developed nations.
The advantages offered by vehicle subscription services over the conventional method of car leasing are fueling vehicle subscription market growth. OEMs and car dealers are focused on providing subscription services with zero registrations & road tax liabilities. Zero down payment and no maintenance or registration charges are grabbing the attention of consumers. Rise in number of working professionals who frequently migrate from one state to another and are susceptible to wasting extra time and money to resell and register their vehicles are greatly benefitted through vehicle subscription services.
North America and Europe are the key regions where the vehicle subscription market demand is high. Therefore, the global vehicle subscription market size in increasing with the rise in number of service provides across the globe. China, India, Brazil, and South Korea are also other major countries offering vehicle subscription services.
Asia Pacific is likely to hold major share of the global market during the forecast period, owing to the increase in population, urbanization, industrialization, and improvement in the living standards of people. According to vehicle subscription industry analysis, automobile sales in developing countries such as China and India are rising at a steady pace. Additionally, the launch of vehicle subscription services in various nations in Asia Pacific is anticipated to fuel market development during the forecast period.
Middle-class residents of the region can easily obtain four-wheelers at flexible monthly half yearly or annual packages through subscription services. Based on the package segment, the standard segment is predicted to account for a sizable portion of the market in the near future, as it provides flexible usage models.
The global market is consolidated, with the presence of large players that control majority of the share. Key market players are investing in comprehensive R&D to explore vehicle subscription business opportunities across the globe.
Some of the prominent players identified in the vehicle subscription market across the globe are Fair Financial Corp., Volvo Car Corporation, Access By BMW, Porsche Smart Monility, Inc., DriveMyCar Rentals Pty Ltd., Hyundai Motor Company, Audi on demand, FlexDrive, Mercedes -Benz USA, CarNext, Mobiliti, Inc., Fresh Car, General Motors, Clutch Technology, Cluno GmbH, FlexWheels, Drivemate, Less Technologies Inc., LMP Motors, and Upshift, Inc.
Key players have been profiled in the vehicle subscription market forecast report based on parameters such as company overview, business strategies, business segments, product portfolio, recent developments, and financial overview.
|
Attribute |
Detail |
|
Market Size Value in 2021 |
US$ 4.9 Bn |
|
Market Forecast Value in 2031 |
US$ 33.2 Bn |
|
Growth Rate (CAGR) |
21.1% |
|
Forecast Period |
2022–2031 |
|
Historical Data Available for |
2017–2021 |
|
Quantitative Units |
US$ Bn for Value |
|
Market Analysis |
It includes cross segment analysis at global as well as regional level. Furthermore, qualitative analysis includes drivers, restraints, opportunities, key trends, Porter’s Five Forces analysis, value chain analysis, and key trend analysis. |
|
Competition Landscape |
|
|
Format |
Electronic (PDF) + Excel |
|
Market Segmentation |
|
|
Regions Covered |
|
|
Countries Covered |
|
|
Companies Profile |
|
|
Customization Scope |
Available upon request |
|
Pricing |
Available upon request |
It is valued at US$ 4.9 Bn in 2021.
It is expected to grow at a CAGR of 21.1% by 2031.
It would be worth US$ 33.2 Bn in 2031.
Increase in adoption of digital platforms for vehicle subscription and cost-effectiveness of vehicle subscription services.
The multi brand subscription type segment accounted for largest share in 2021.
Asia Pacific is expected to hold major share during the forecast period.
Fair Financial Corp., Volvo Car Corporation, Access By BMW, Porsche Smart Monility, Inc., Hyundai Motor Company, Audi on demand, Mercedes -Benz USA, Mobiliti, Inc., Fresh Car, General Motors, Clutch Technology, CarNext, FlexDrive, Cluno GmbH, DriveMyCar Rentals Pty Ltd., FlexWheels, Drivemate, Less Technologies Inc., LMP Motors, and Upshift, Inc.
1. Executive Summary
1.1. Global Market Outlook
1.1.1. Market Size in Units, Value US$ Bn, 2017-2031
1.2. TMR Analysis and Recommendations
1.3. Competitive Dashboard Analysis
2. Market Overview
2.1. Market Coverage / Taxonomy
2.2. Market Definition / Scope / Limitations
2.3. Market Dynamics
2.3.1. Drivers
2.3.2. Restraints
2.3.3. Opportunity
2.4. Market Factor Analysis
2.4.1. Porter’s Five Force Analysis
2.4.2. SWOT Analysis
2.5. Regulatory Scenario
2.6. Key Trend Analysis
2.7. Value Chain Analysis
2.8. Cost Structure Analysis
2.9. Profit Margin Analysis
3. COVID-19 Impact Analysis – Vehicle Subscription Market
4. Global Vehicle Subscription Market, By Subscription Type
4.1. Market Snapshot
4.1.1. Introduction, Definition, and Key Findings
4.1.2. Market Growth & Y-o-Y Projections
4.1.3. Base Point Share Analysis
4.2. Global Vehicle Subscription Market Value (US$ Bn) Analysis & Forecast, 2017-2031, By Subscription Type
4.2.1. Single Brand (Single Brand Swap)
4.2.2. Multi Brand (Multi Brand Swap)
5. Global Vehicle Subscription Market, By Service Provider
5.1. Market Snapshot
5.1.1. Introduction, Definition, and Key Findings
5.1.2. Market Growth & Y-o-Y Projections
5.1.3. Base Point Share Analysis
5.2. Global Vehicle Subscription Market Value (US$ Bn) Analysis & Forecast, 2017-2031, By Service Provider
5.2.1. OEM/Captives
5.2.2. Mobility Providers
5.2.3. Technology Companies
6. Global Vehicle Subscription Market, By Package
6.1. Market Snapshot
6.1.1. Introduction, Definition, and Key Findings
6.1.2. Market Growth & Y-o-Y Projections
6.1.3. Base Point Share Analysis
6.2. Global Vehicle Subscription Market Value (US$ Bn) Analysis & Forecast, 2017-2031, By Package
6.2.1. Budget
6.2.2. Standard
6.2.3. Premium
7. Global Vehicle Subscription Market, By End-user
7.1. Market Snapshot
7.1.1. Introduction, Definition, and Key Findings
7.1.2. Market Growth & Y-o-Y Projections
7.1.3. Base Point Share Analysis
7.2. Global Vehicle Subscription Market Value (US$ Bn) Analysis & Forecast, 2017-2031, By End-user
7.2.1. Business
7.2.2. Private
8. Global Vehicle Subscription Market, by Region
8.1. Market Snapshot
8.1.1. Introduction, Definition, and Key Findings
8.1.2. Market Growth & Y-o-Y Projections
8.1.3. Base Point Share Analysis
8.2. Global Vehicle Subscription Market Value (US$ Bn) Analysis & Forecast, 2017-2031, By Region
8.2.1. North America
8.2.2. Europe
8.2.3. Asia Pacific
8.2.4. Middle East & Africa
8.2.5. South America
9. North America Vehicle Subscription Market
9.1. Market Snapshot
9.2. Vehicle Subscription Market Value (US$ Bn) Analysis & Forecast, 2017-2031, By Subscription Type
9.2.1. Single Brand (Single Brand Swap)
9.2.2. Multi Brand (Multi Brand Swap)
9.3. Vehicle Subscription Market Value (US$ Bn) Analysis & Forecast, 2017-2031, By Service Provider
9.3.1. OEM/Captives
9.3.2. Mobility Providers
9.3.3. Technology Companies
9.4. Vehicle Subscription Market Value (US$ Bn) Analysis & Forecast, 2017-2031, By Package
9.4.1. Budget
9.4.2. Standard
9.4.3. Premium
9.5. Vehicle Subscription Market Value (US$ Bn) Analysis & Forecast, 2017-2031, By End-user
9.5.1. Business
9.5.2. Private
9.6. Key Country Analysis – North America Vehicle Subscription Market Value (US$ Bn) Analysis & Forecast, 2017-2031
9.6.1. The U. S.
9.6.2. Canada
9.6.3. Mexico
10. Europe Vehicle Subscription Market
10.1. Market Snapshot
10.2. Vehicle Subscription Market Value (US$ Bn) Analysis & Forecast, 2017-2031, By Subscription Type
10.2.1. Single Brand (Single Brand Swap)
10.2.2. Multi Brand (Multi Brand Swap)
10.3. Vehicle Subscription Market Value (US$ Bn) Analysis & Forecast, 2017-2031, By Service Provider
10.3.1. OEM/Captives
10.3.2. Mobility Providers
10.3.3. Technology Companies
10.4. Vehicle Subscription Market Value (US$ Bn) Analysis & Forecast, 2017-2031, By Package
10.4.1. Budget
10.4.2. Standard
10.4.3. Premium
10.5. Vehicle Subscription Market Value (US$ Bn) Analysis & Forecast, 2017-2031, By End-user
10.5.1. Business
10.5.2. Private
10.6. Key Country Analysis – Europe Vehicle Subscription Market Value (US$ Bn) Analysis & Forecast, 2017-2031
10.6.1. Germany
10.6.2. U. K.
10.6.3. France
10.6.4. Italy
10.6.5. Spain
10.6.6. Nordic Countries
10.6.7. Russia & CIS
10.6.8. Rest of Europe
11. Asia Pacific Vehicle Subscription Market
11.1. Market Snapshot
11.2. Vehicle Subscription Market Value (US$ Bn) Analysis & Forecast, 2017-2031, By Subscription Type
11.2.1. Single Brand (Single Brand Swap)
11.2.2. Multi Brand (Multi Brand Swap)
11.3. Vehicle Subscription Market Value (US$ Bn) Analysis & Forecast, 2017-2031, By Service Provider
11.3.1. OEM/Captives
11.3.2. Mobility Providers
11.3.3. Technology Companies
11.4. Vehicle Subscription Market Value (US$ Bn) Analysis & Forecast, 2017-2031, By Package
11.4.1. Budget
11.4.2. Standard
11.4.3. Premium
11.5. Vehicle Subscription Market Value (US$ Bn) Analysis & Forecast, 2017-2031, By End-user
11.5.1. Business
11.5.2. Private
11.6. Key Country Analysis – Asia Pacific Vehicle Subscription Market Value (US$ Bn) Analysis & Forecast, 2017-2031
11.6.1. China
11.6.2. India
11.6.3. Japan
11.6.4. ASEAN Countries
11.6.5. South Korea
11.6.6. ANZ
11.6.7. Rest of Asia Pacific
12. Middle East & Africa Vehicle Subscription Market
12.1. Market Snapshot
12.2. Vehicle Subscription Market Value (US$ Bn) Analysis & Forecast, 2017-2031, By Subscription Type
12.2.1. Single Brand (Single Brand Swap)
12.2.2. Multi Brand (Multi Brand Swap)
12.3. Vehicle Subscription Market Value (US$ Bn) Analysis & Forecast, 2017-2031, By Service Provider
12.3.1. OEM/Captives
12.3.2. Mobility Providers
12.3.3. Technology Companies
12.4. Vehicle Subscription Market Value (US$ Bn) Analysis & Forecast, 2017-2031, By Package
12.4.1. Budget
12.4.2. Standard
12.4.3. Premium
12.5. Vehicle Subscription Market Value (US$ Bn) Analysis & Forecast, 2017-2031, By End-user
12.5.1. Business
12.5.2. Private
12.6. Key Country Analysis – Middle East & Africa Vehicle Subscription Market Value (US$ Bn) Analysis & Forecast, 2017-2031
12.6.1. GCC
12.6.2. South Africa
12.6.3. Turkey
12.6.4. Rest of Middle East & Africa
13. South America Vehicle Subscription Market
13.1. Market Snapshot
13.2. Vehicle Subscription Market Value (US$ Bn) Analysis & Forecast, 2017-2031, By Subscription Type
13.2.1. Single Brand (Single Brand Swap)
13.2.2. Multi Brand (Multi Brand Swap)
13.3. Vehicle Subscription Market Value (US$ Bn) Analysis & Forecast, 2017-2031, By Service Provider
13.3.1. OEM/Captives
13.3.2. Mobility Providers
13.3.3. Technology Companies
13.4. Vehicle Subscription Market Value (US$ Bn) Analysis & Forecast, 2017-2031, By Package
13.4.1. Budget
13.4.2. Standard
13.4.3. Premium
13.5. Vehicle Subscription Market Value (US$ Bn) Analysis & Forecast, 2017-2031, By End-user
13.5.1. Business
13.5.2. Private
13.6. Key Country Analysis – South America Vehicle Subscription Market Value (US$ Bn) Analysis & Forecast, 2017-2031
13.6.1. Brazil
13.6.2. Argentina
13.6.3. Rest of South America
14. Competitive Landscape
14.1. Company Share Analysis/ Brand Share Analysis, 2021
14.2. Key Strategy Analysis
14.2.1. Strategic Overview - Expansion, M&A, Partnership
14.2.2. Product & Marketing Strategy
14.3. Company Analysis for each player (Company Overview, Company Footprints, Production Locations, Product Portfolio, Competitors & Customers, Subsidiaries & Parent Organization, Recent Developments, Financial Analysis, Profitability, Revenue Share)
15. Company Profile/ Key Players
15.1. Fair Financial Corp.
15.1.1. Company Overview
15.1.2. Company Footprints
15.1.3. Production Locations
15.1.4. Product Portfolio
15.1.5. Competitors & Customers
15.1.6. Subsidiaries & Parent Organization
15.1.7. Recent Developments
15.1.8. Financial Analysis
15.1.9. Profitability
15.1.10. Revenue Share
15.2. Volvo Car Corporation
15.2.1. Company Overview
15.2.2. Company Footprints
15.2.3. Production Locations
15.2.4. Product Portfolio
15.2.5. Competitors & Customers
15.2.6. Subsidiaries & Parent Organization
15.2.7. Recent Developments
15.2.8. Financial Analysis
15.2.9. Profitability
15.2.10. Revenue Share
15.3. Access By BMW
15.3.1. Company Overview
15.3.2. Company Footprints
15.3.3. Production Locations
15.3.4. Product Portfolio
15.3.5. Competitors & Customers
15.3.6. Subsidiaries & Parent Organization
15.3.7. Recent Developments
15.3.8. Financial Analysis
15.3.9. Profitability
15.3.10. Revenue Share
15.4. Porsche Smart Monility, Inc.
15.4.1. Company Overview
15.4.2. Company Footprints
15.4.3. Production Locations
15.4.4. Product Portfolio
15.4.5. Competitors & Customers
15.4.6. Subsidiaries & Parent Organization
15.4.7. Recent Developments
15.4.8. Financial Analysis
15.4.9. Profitability
15.4.10. Revenue Share
15.5. Hyundai Motor Company
15.5.1. Company Overview
15.5.2. Company Footprints
15.5.3. Production Locations
15.5.4. Product Portfolio
15.5.5. Competitors & Customers
15.5.6. Subsidiaries & Parent Organization
15.5.7. Recent Developments
15.5.8. Financial Analysis
15.5.9. Profitability
15.5.10. Revenue Share
15.6. Audi on demand
15.6.1. Company Overview
15.6.2. Company Footprints
15.6.3. Production Locations
15.6.4. Product Portfolio
15.6.5. Competitors & Customers
15.6.6. Subsidiaries & Parent Organization
15.6.7. Recent Developments
15.6.8. Financial Analysis
15.6.9. Profitability
15.6.10. Revenue Share
15.7. Mercedes -Benz USA
15.7.1. Company Overview
15.7.2. Company Footprints
15.7.3. Production Locations
15.7.4. Product Portfolio
15.7.5. Competitors & Customers
15.7.6. Subsidiaries & Parent Organization
15.7.7. Recent Developments
15.7.8. Financial Analysis
15.7.9. Profitability
15.7.10. Revenue Share
15.8. Mobiliti, Inc.
15.8.1. Company Overview
15.8.2. Company Footprints
15.8.3. Production Locations
15.8.4. Product Portfolio
15.8.5. Competitors & Customers
15.8.6. Subsidiaries & Parent Organization
15.8.7. Recent Developments
15.8.8. Financial Analysis
15.8.9. Profitability
15.8.10. Revenue Share
15.9. Fresh Car
15.9.1. Company Overview
15.9.2. Company Footprints
15.9.3. Production Locations
15.9.4. Product Portfolio
15.9.5. Competitors & Customers
15.9.6. Subsidiaries & Parent Organization
15.9.7. Recent Developments
15.9.8. Financial Analysis
15.9.9. Profitability
15.9.10. Revenue Share
15.10. General Motors
15.10.1. Company Overview
15.10.2. Company Footprints
15.10.3. Production Locations
15.10.4. Product Portfolio
15.10.5. Competitors & Customers
15.10.6. Subsidiaries & Parent Organization
15.10.7. Recent Developments
15.10.8. Financial Analysis
15.10.9. Profitability
15.10.10. Revenue Share
15.11. Clutch Technology
15.11.1. Company Overview
15.11.2. Company Footprints
15.11.3. Production Locations
15.11.4. Product Portfolio
15.11.5. Competitors & Customers
15.11.6. Subsidiaries & Parent Organization
15.11.7. Recent Developments
15.11.8. Financial Analysis
15.11.9. Profitability
15.11.10. Revenue Share
15.12. CarNext
15.12.1. Company Overview
15.12.2. Company Footprints
15.12.3. Production Locations
15.12.4. Product Portfolio
15.12.5. Competitors & Customers
15.12.6. Subsidiaries & Parent Organization
15.12.7. Recent Developments
15.12.8. Financial Analysis
15.12.9. Profitability
15.12.10. Revenue Share
15.13. FlexDrive
15.13.1. Company Overview
15.13.2. Company Footprints
15.13.3. Production Locations
15.13.4. Product Portfolio
15.13.5. Competitors & Customers
15.13.6. Subsidiaries & Parent Organization
15.13.7. Recent Developments
15.13.8. Financial Analysis
15.13.9. Profitability
15.13.10. Revenue Share
15.14. Cluno GmbH
15.14.1. Company Overview
15.14.2. Company Footprints
15.14.3. Production Locations
15.14.4. Product Portfolio
15.14.5. Competitors & Customers
15.14.6. Subsidiaries & Parent Organization
15.14.7. Recent Developments
15.14.8. Financial Analysis
15.14.9. Profitability
15.14.10. Revenue Share
15.15. DriveMyCar Rentals Pty Ltd.
15.15.1. Company Overview
15.15.2. Company Footprints
15.15.3. Production Locations
15.15.4. Product Portfolio
15.15.5. Competitors & Customers
15.15.6. Subsidiaries & Parent Organization
15.15.7. Recent Developments
15.15.8. Financial Analysis
15.15.9. Profitability
15.15.10. Revenue Share
15.16. FlexWheels
15.16.1. Company Overview
15.16.2. Company Footprints
15.16.3. Production Locations
15.16.4. Product Portfolio
15.16.5. Competitors & Customers
15.16.6. Subsidiaries & Parent Organization
15.16.7. Recent Developments
15.16.8. Financial Analysis
15.16.9. Profitability
15.16.10. Revenue Share
15.17. Drivemate
15.17.1. Company Overview
15.17.2. Company Footprints
15.17.3. Production Locations
15.17.4. Product Portfolio
15.17.5. Competitors & Customers
15.17.6. Subsidiaries & Parent Organization
15.17.7. Recent Developments
15.17.8. Financial Analysis
15.17.9. Profitability
15.17.10. Revenue Share
15.18. Less Technologies Inc.
15.18.1. Company Overview
15.18.2. Company Footprints
15.18.3. Production Locations
15.18.4. Product Portfolio
15.18.5. Competitors & Customers
15.18.6. Subsidiaries & Parent Organization
15.18.7. Recent Developments
15.18.8. Financial Analysis
15.18.9. Profitability
15.18.10. Revenue Share
15.19. LMP Motors
15.19.1. Company Overview
15.19.2. Company Footprints
15.19.3. Production Locations
15.19.4. Product Portfolio
15.19.5. Competitors & Customers
15.19.6. Subsidiaries & Parent Organization
15.19.7. Recent Developments
15.19.8. Financial Analysis
15.19.9. Profitability
15.19.10. Revenue Share
15.20. Upshift, Inc.
15.20.1. Company Overview
15.20.2. Company Footprints
15.20.3. Production Locations
15.20.4. Product Portfolio
15.20.5. Competitors & Customers
15.20.6. Subsidiaries & Parent Organization
15.20.7. Recent Developments
15.20.8. Financial Analysis
15.20.9. Profitability
15.20.10. Revenue Share
15.21. Others
15.21.1. Company Overview
15.21.2. Company Footprints
15.21.3. Production Locations
15.21.4. Product Portfolio
15.21.5. Competitors & Customers
15.21.6. Subsidiaries & Parent Organization
15.21.7. Recent Developments
15.21.8. Financial Analysis
15.21.9. Profitability
15.21.10. Revenue Share
List of Tables
Table 1: Global Vehicle Subscription Market Value (US$ Bn) Forecast, by Subscription Type, 2017-2031
Table 2: Global Vehicle Subscription Market Value (US$ Bn) Forecast, by Service Provider, 2017-2031
Table 3: Global Vehicle Subscription Market Value (US$ Bn) Forecast, by Package, 2017-2031
Table 4: Global Vehicle Subscription Market Value (US$ Bn) Forecast, by End-user, 2017-2031
Table 5: Global Vehicle Subscription Market Value (US$ Bn) Forecast, by Region, 2017-2031
Table 6: North America Vehicle Subscription Market Value (US$ Bn) Forecast, by Subscription Type, 2017-2031
Table 7: North America Vehicle Subscription Market Value (US$ Bn) Forecast, by Service Provider, 2017-2031
Table 8: North America Vehicle Subscription Market Value (US$ Bn) Forecast, by Package, 2017-2031
Table 9: North America Vehicle Subscription Market Value (US$ Bn) Forecast, by End-user, 2017-2031
Table 10: North America Vehicle Subscription Market Value (US$ Bn) Forecast, by Country, 2017-2031
Table 11: Europe Vehicle Subscription Market Value (US$ Bn) Forecast, by Subscription Type, 2017-2031
Table 12: Europe Vehicle Subscription Market Value (US$ Bn) Forecast, by Service Provider, 2017-2031
Table 13: Europe Vehicle Subscription Market Value (US$ Bn) Forecast, by Package, 2017-2031
Table 14: Europe Vehicle Subscription Market Value (US$ Bn) Forecast, by End-user, 2017-2031
Table 15: Europe Vehicle Subscription Market Value (US$ Bn) Forecast, by Country, 2017-2031
Table 16: Asia Pacific Vehicle Subscription Market Value (US$ Bn) Forecast, by Subscription Type, 2017-2031
Table 17: Asia Pacific Vehicle Subscription Market Value (US$ Bn) Forecast, by Service Provider, 2017-2031
Table 18: Asia Pacific Vehicle Subscription Market Value (US$ Bn) Forecast, by Package, 2017-2031
Table 19: Asia Pacific Vehicle Subscription Market Value (US$ Bn) Forecast, by End-user, 2017-2031
Table 20: Asia Pacific Vehicle Subscription Market Value (US$ Bn) Forecast, by Country, 2017-2031
Table 21: Middle East & Africa Vehicle Subscription Market Value (US$ Bn) Forecast, by Subscription Type, 2017-2031
Table 22: Middle East & Africa Vehicle Subscription Market Value (US$ Bn) Forecast, by Service Provider, 2017-2031
Table 23: Middle East & Africa Vehicle Subscription Market Value (US$ Bn) Forecast, by Package, 2017-2031
Table 24: Middle East & Africa Vehicle Subscription Market Value (US$ Bn) Forecast, by End-user, 2017-2031
Table 25: Middle East & Africa Vehicle Subscription Market Value (US$ Bn) Forecast, by Country, 2017-2031
Table 26: South America Vehicle Subscription Market Value (US$ Bn) Forecast, by Subscription Type, 2017-2031
Table 27: South America Vehicle Subscription Market Value (US$ Bn) Forecast, by Service Provider, 2017-2031
Table 28: South America Vehicle Subscription Market Value (US$ Bn) Forecast, by Package, 2017-2031
Table 29: South America Vehicle Subscription Market Value (US$ Bn) Forecast, by End-user, 2017-2031
Table 30: South America Vehicle Subscription Market Value (US$ Bn) Forecast, by Country, 2017-2031
List of Figures
Figure 1: Global Vehicle Subscription Market Value (US$ Bn) Forecast, by Subscription Type, 2017-2031
Figure 2: Global Vehicle Subscription Market, Incremental Opportunity, by Subscription Type, Value (US$ Bn), 2022-2031
Figure 3: Global Vehicle Subscription Market Value (US$ Bn) Forecast, by Service Provider, 2017-2031
Figure 4: Global Vehicle Subscription Market, Incremental Opportunity, by Service Provider, Value (US$ Bn), 2022-2031
Figure 5: Global Vehicle Subscription Market Value (US$ Bn) Forecast, by Package, 2017-2031
Figure 6: Global Vehicle Subscription Market, Incremental Opportunity, by Package, Value (US$ Bn), 2022-2031
Figure 7: Global Vehicle Subscription Market Value (US$ Bn) Forecast, by End-user, 2017-2031
Figure 8: Global Vehicle Subscription Market, Incremental Opportunity, by End-user, Value (US$ Bn), 2022-2031
Figure 9: Global Vehicle Subscription Market Value (US$ Bn) Forecast, by Region, 2017-2031
Figure 10: Global Vehicle Subscription Market, Incremental Opportunity, by Region, Value (US$ Bn), 2022-2031
Figure 11: North America Vehicle Subscription Market Value (US$ Bn) Forecast, by Subscription Type, 2017-2031
Figure 12: North America Vehicle Subscription Market, Incremental Opportunity, by Subscription Type, Value (US$ Bn), 2022-2031
Figure 13: North America Vehicle Subscription Market Value (US$ Bn) Forecast, by Service Provider, 2017-2031
Figure 14: North America Vehicle Subscription Market, Incremental Opportunity, by Service Provider, Value (US$ Bn), 2022-2031
Figure 15: North America Vehicle Subscription Market Value (US$ Bn) Forecast, by Package, 2017-2031
Figure 16: North America Vehicle Subscription Market, Incremental Opportunity, by Package, Value (US$ Bn), 2022-2031
Figure 17: North America Vehicle Subscription Market Value (US$ Bn) Forecast, by End-user, 2017-2031
Figure 18: North America Vehicle Subscription Market, Incremental Opportunity, by End-user, Value (US$ Bn), 2022-2031
Figure 19: North America Vehicle Subscription Market Value (US$ Bn) Forecast, by Country, 2017-2031
Figure 20: North America Vehicle Subscription Market, Incremental Opportunity, by Country, Value (US$ Bn), 2022-2031
Figure 21: Europe Vehicle Subscription Market Value (US$ Bn) Forecast, by Subscription Type, 2017-2031
Figure 22: Europe Vehicle Subscription Market, Incremental Opportunity, by Subscription Type, Value (US$ Bn), 2022-2031
Figure 23: Europe Vehicle Subscription Market Value (US$ Bn) Forecast, by Service Provider, 2017-2031
Figure 24: Europe Vehicle Subscription Market, Incremental Opportunity, by Service Provider, Value (US$ Bn), 2022-2031
Figure 25: Europe Vehicle Subscription Market Value (US$ Bn) Forecast, by Package, 2017-2031
Figure 26: Europe Vehicle Subscription Market, Incremental Opportunity, by Package, Value (US$ Bn), 2022-2031
Figure 27: Europe Vehicle Subscription Market Value (US$ Bn) Forecast, by End-user, 2017-2031
Figure 28: Europe Vehicle Subscription Market, Incremental Opportunity, by End-user, Value (US$ Bn), 2022-2031
Figure 29: Europe Vehicle Subscription Market Value (US$ Bn) Forecast, by Country, 2017-2031
Figure 30: Europe Vehicle Subscription Market, Incremental Opportunity, by Country, Value (US$ Bn), 2022-2031
Figure 31: Asia Pacific Vehicle Subscription Market Value (US$ Bn) Forecast, by Subscription Type, 2017-2031
Figure 32: Asia Pacific Vehicle Subscription Market, Incremental Opportunity, by Subscription Type, Value (US$ Bn), 2022-2031
Figure 33: Asia Pacific Vehicle Subscription Market Value (US$ Bn) Forecast, by Service Provider, 2017-2031
Figure 34: Asia Pacific Vehicle Subscription Market, Incremental Opportunity, by Service Provider, Value (US$ Bn), 2022-2031
Figure 35: Asia Pacific Vehicle Subscription Market Value (US$ Bn) Forecast, by Package, 2017-2031
Figure 36: Asia Pacific Vehicle Subscription Market, Incremental Opportunity, by Package, Value (US$ Bn), 2022-2031
Figure 37: Asia Pacific Vehicle Subscription Market Value (US$ Bn) Forecast, by End-user, 2017-2031
Figure 38: Asia Pacific Vehicle Subscription Market, Incremental Opportunity, by End-user, Value (US$ Bn), 2022-2031
Figure 39: Asia Pacific Vehicle Subscription Market Value (US$ Bn) Forecast, by Country, 2017-2031
Figure 40: Asia Pacific Vehicle Subscription Market, Incremental Opportunity, by Country, Value (US$ Bn), 2022-2031
Figure 41: Middle East & Africa Vehicle Subscription Market Value (US$ Bn) Forecast, by Subscription Type, 2017-2031
Figure 42: Middle East & Africa Vehicle Subscription Market, Incremental Opportunity, by Subscription Type, Value (US$ Bn), 2022-2031
Figure 43: Middle East & Africa Vehicle Subscription Market Value (US$ Bn) Forecast, by Service Provider, 2017-2031
Figure 44: Middle East & Africa Vehicle Subscription Market, Incremental Opportunity, by Service Provider, Value (US$ Bn), 2022-2031
Figure 45: Middle East & Africa Vehicle Subscription Market Value (US$ Bn) Forecast, by Package, 2017-2031
Figure 46: Middle East & Africa Vehicle Subscription Market, Incremental Opportunity, by Package, Value (US$ Bn), 2022-2031
Figure 47: Middle East & Africa Vehicle Subscription Market Value (US$ Bn) Forecast, by End-user, 2017-2031
Figure 48: Middle East & Africa Vehicle Subscription Market, Incremental Opportunity, by End-user, Value (US$ Bn), 2022-2031
Figure 49: Middle East & Africa Vehicle Subscription Market Value (US$ Bn) Forecast, by Country, 2017-2031
Figure 50: Middle East & Africa Vehicle Subscription Market, Incremental Opportunity, by Country, Value (US$ Bn), 2022-2031
Figure 51: South America Vehicle Subscription Market Value (US$ Bn) Forecast, by Subscription Type, 2017-2031
Figure 52: South America Vehicle Subscription Market, Incremental Opportunity, by Subscription Type, Value (US$ Bn), 2022-2031
Figure 53: South America Vehicle Subscription Market Value (US$ Bn) Forecast, by Service Provider, 2017-2031
Figure 54: South America Vehicle Subscription Market, Incremental Opportunity, by Service Provider, Value (US$ Bn), 2022-2031
Figure 55: South America Vehicle Subscription Market Value (US$ Bn) Forecast, by Package, 2017-2031
Figure 56: South America Vehicle Subscription Market, Incremental Opportunity, by Package, Value (US$ Bn), 2022-2031
Figure 57: South America Vehicle Subscription Market Value (US$ Bn) Forecast, by End-user, 2017-2031
Figure 58: South America Vehicle Subscription Market, Incremental Opportunity, by End-user, Value (US$ Bn), 2022-2031
Figure 59: South America Vehicle Subscription Market Value (US$ Bn) Forecast, by Country, 2017-2031
Figure 60: South America Vehicle Subscription Market, Incremental Opportunity, by Country, Value (US$ Bn), 2022-2031
Copyright © Transparency Market Research, Inc. All Rights reserved
Trust Online

Vehicle Subscription Market