
Reports
Reports
Analysts’ Viewpoint on Market Scenario
The global turbidimeter industry is estimated to grow at a decent pace during the forecast period, due to the rise in adoption of turbidimeters in wastewater treatment facilities. Turbidity meter manufacturers and suppliers are launching new software upgrades, collaborating with different companies to expand their product portfolio and global reach as well as to keep their businesses growing post the peak of the COVID-19 pandemic. These companies are striving to carry out R&D activities for technological advancement and product innovation. An increase in the penetration of online sales channels, such as e-commerce portals, is likely to fuel market growth during the forecast period, as these channels offer extensive product range and bulk deals and discounts to grab the attention of consumers. Manufacturers should tap into incremental opportunities in portable turbidimeters to broaden their revenue streams.
A turbidity meter, or turbidimeter, is a tool used to measure the level of turbidity of analyzed water or solutions. Turbidimeter checks for the suspended solids present in liquids and improves the quality of water. Turbidimeter instruments are usually installed in the field and continuously analyze the sample stream overflowing from the process sampling unit. Benchtop or portable instruments are used to analyze grab samples, while process instruments are plumbed and wired into a system to provide a continuous reading from a sampling point. An increase in applications of turbidimeters in end-use industries such as chemicals & materials, pharmaceuticals, and pulp & paper, etc., is expected to drive the global turbidimeter industry share during the forecast period.
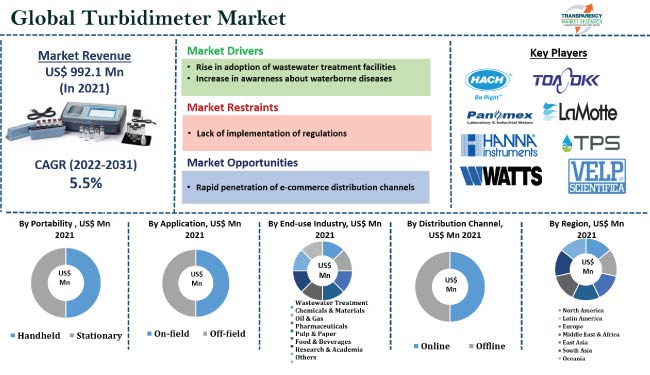
The majority of water usage in human activities results in generating wastewater. The amount of wastewater produced along with its overall pollutant load is rising consistently due to the global increase in usage of water. In some of the most developed nations, a large percentage of wastewater is dumped into the environment untreated. However, several countries are focusing on the development of wastewater treatment plants to conserve fresh water and reduce the amount of wastewater. Increase in efforts of several governments to construct effluent treatment plants in their manufacturing and processing facilities in order to release clean water is projected to drive the global turbidimeter business during the forecast period. The need for turbidimeters has grown as a result of the expansion of wastewater treatment facilities. According to the United States Environmental Protection Agency, approximately 34 billion gallons of wastewater is produced every day, and over 16,000 centralized wastewater treatment plants cater to approximately 74% of the population. This leads to the rapid adoption of turbidimeters in order to purify water.
About 80% of industrial and municipal wastewater is discharged into the environment without any prior treatment, with adverse effects on human health and the ecosystem. Chemicals, including natural or manmade (xenobiotic), get released into the water and raise serious health concerns. Pesticides, chlorinated solvents, petroleum chemicals, mercury, PCBs, dioxins, and other persisting organic pollutants present in water cause serious health illnesses. Increase in prevalence of waterborne diseases such as cholera, diarrhea, dysentery, hepatitis A, typhoid, and polio is majorly due to contaminated water and poor sanitation. According to the World Health Organization (WHO), an estimated 829 000 people are likely to die each year from diarrhea as a result of unsafe drinking water in the near future. The turbidimeter is used to measure the cloudiness or haziness of water. Turbidimeters have been used as a simple and basic indicator of water quality and have been used for monitoring drinking water, including filtration. Therefore, increase in awareness about waterborne diseases among people is anticipated to accelerate the turbidimeter industry growth in the next few years.
Consumers are more concerned about their health, and their purchasing pattern is also changing post the peak of the COVID-19 pandemic. Consumers are presently more inclined toward purchasing products from online distribution channels due to their easy availability and convenience. The rise in the penetration of the internet across the globe has led to an increase in the sale of turbidimeters through online channels. According to International Telecommunication Union (ITU), the number of internet users is increasing rapidly across the globe, leading to the rapid adoption of purchasing turbidimeters from online websites. This is projected to fuel the global turbidimeter industry during the forecast period.
In terms of portability, the handheld segment is expected to hold major share of the global turbidimeter business during the forecast period. Handheld turbidity meters are easy to use and convenient to carry. Portability has been one of the prime reasons behind the increase in demand for handheld turbidimeters. Additionally, these devices are technologically advanced. Stationary turbidimeters are more precisely used for off-field applications such as laboratories. Demand for stationary devices is anticipated to rise at a sluggish pace, as compared to handheld turbidimeters, in the near future.
East Asia accounted for a key share of the global turbidimeter industry in 2021. Rise in population led to an increase in amount of waste generated by industries which drive the East Asia turbidimeter business during the forecast period. According to ASCE’s Infrastructure Report Card, demand for wastewater treatment plants is anticipated to grow by 23% by 2032. Presence of some of the key manufacturers having superior technological advancement in water quality checks is projected to boost the market share in Europe and North America during the forecast period.
Majority of the firms operating in the global turbidimeter industry are spending significantly on comprehensive R&D activities, primarily to develop innovative products. Expansion of product portfolios and mergers & acquisitions are notable strategies adopted by manufacturers of the global turbidimeter business. Key players operating in the global turbidimeter manufacture are Hach Company, Panomex Inc, Hanna Instruments, Watts Water Technologies Inc. (HF Scientific), AQUALYTIC, DKK-TOA Corporation, OPTEX CO., LTD, Palintest, Tintometer GmbH, TPS PTY Ltd., and LaMotte Compa.
Key players have been profiled in the turbidimeter industry report based on parameters such as company overview, financial overview, business strategies, product portfolio, business segments, and recent developments.
|
Attribute |
Detail |
|
Market Size Value in 2021 (Base Year) |
US$ 992.1 Mn |
|
Market Forecast Value in 2031 |
US$ 1.7 Bn |
|
Growth Rate (CAGR) |
5.5% |
|
Forecast Period |
2022-2031 |
|
Quantitative Units |
US$ Mn/Bn for value and Thousand Units for Volume |
|
Market Analysis |
It includes cross-segment analysis at the global as well as regional levels. Furthermore, the qualitative analysis includes drivers, restraints, opportunities, key trends, Porter’s Five Forces analysis, value chain analysis, and key trend analysis. |
|
Competition Landscape |
|
|
Regions Covered |
|
|
Market Segmentation |
|
|
Companies Profile |
|
|
Customization Scope |
Available upon Request |
|
Pricing |
Available upon Request |
It stood at US$ 992.1 Mn in 2021
The global turbidimeter market is expected to reach US$ 1.7 Bn by 2031
Rise in adoption of wastewater treatment facilities and increase in awareness about waterborne diseases
The handheld segment contributed the highest share of the global turbidimeter market in 2021
East Asia held 28% share of the global turbidimeter market in 2021
Hach Company, Panomex Inc, Hanna Instruments, Watts Water Technologies Inc. (HF Scientific), AQUALYTIC, DKK-TOA Corporation, OPTEX CO., LTD, Palintest, Tintometer GmbH, TPS PTY Ltd., and LaMotte Company
1. Preface
1.1. Market Definition and Scope
1.2. Market Segmentation
1.3. Key Research Objectives
1.4. Research Highlights
2. Assumptions
3. Research Methodology
4. Executive Summary
5. Market Overview
5.1. Introduction
5.2. Market Dynamics
5.2.1. Drivers
5.2.2. Restraints
5.2.3. Opportunities
5.3. Key Trends Analysis
5.3.1. Demand Side Analysis
5.3.2. Supply Side Analysis
5.4. Key Market Indicators
5.5. Value Chain Analysis
5.6. Porter’s Five Forces Analysis
5.7. Industry SWOT Analysis
5.8. Covid-19 Impact Analysis
5.9. Technology Overview
5.10. Regulatory Framework and Guidelines
5.11. Global Turbidimeter Market Analysis and Forecast, 2017-2031
5.11.1. Market Value Projections (US$ Mn)
5.11.2. Market Volume Projections (Thousand Units)
6. Global Turbidimeter Market Analysis and Forecast, by Portability
6.1. Global Turbidimeter Market Size (US$ Mn and Thousand Units) Forecast, by Portability, 2017 - 2031
6.1.1. Handheld
6.1.2. Stationary
6.2. Incremental Opportunity, by Portability
7. Global Turbidimeter Market Analysis and Forecast, by Application
7.1. Global Turbidimeter Market Size (US$ Mn and Thousand Units) Forecast, by Application, 2017 - 2031
7.1.1. On-field
7.1.2. Off-field
7.2. Incremental Opportunity, by Application
8. Global Turbidimeter Market Analysis and Forecast, by End-use Industry
8.1. Global Turbidimeter Market Size (US$ Mn and Thousand Units) Forecast, by End-use Industry, 2017 - 2031
8.1.1. Wastewater Treatment
8.1.2. Chemicals & Materials
8.1.3. Oil & Gas
8.1.4. Pharmaceuticals
8.1.5. Pulp & Paper
8.1.6. Food & Beverage
8.1.7. Research & Academia
8.1.8. Others
8.2. Incremental Opportunity, by End-use Industry
9. Global Turbidimeter Market Analysis and Forecast, by Distribution Channel
9.1. Global Turbidimeter Market Size (US$ Mn and Thousand Units) Forecast, by Distribution Channel, 2017 - 2031
9.1.1. Online
9.1.1.1. E-commerce Websites
9.1.1.2. Company-owned Websites
9.1.2. Offline
9.1.2.1. Specialty Stores
9.1.2.2. Other Retail Stores
9.2. Incremental Opportunity, by Distribution Channel
10. Global Turbidimeter Market Analysis and Forecast, by Region
10.1. Turbidimeter Market Size (US$ Mn and Thousand Units) Forecast, by Region, 2017-2031
10.1.1. North America
10.1.2. Latin America
10.1.3. Europe
10.1.4. Middle East & Africa
10.1.5. East Asia
10.1.6. South Asia
10.1.7. Oceania
10.2. Incremental Opportunity, by Region
11. North America Turbidimeter Market Analysis and Forecast
11.1. Regional Snapshot
11.2. Key Supplier Analysis
11.3. COVID-19 Impact Analysis
11.4. Key Trends Analysis
11.5. Price Trend Analysis
11.5.1. Weighted Average Price
11.6. Turbidimeter Market Size (US$ Mn and Thousand Units) Forecast, by Portability, 2017-2031
11.6.1. Handheld
11.6.2. Stationary
11.7. Turbidimeter Market Size (US$ Mn and Thousand Units) Forecast, by Application, 2017-2031
11.7.1. On-field
11.7.2. Off-field
11.8. Turbidimeter Market Size (US$ Mn and Thousand Units) Forecast, by End-use Industry, 2017-2031
11.8.1. Wastewater Treatment
11.8.2. Chemicals & Materials
11.8.3. Oil & Gas
11.8.4. Pharmaceuticals
11.8.5. Pulp & Paper
11.8.6. Food & Beverage
11.8.7. Research & Academia
11.8.8. Others
11.9. Turbidimeter Market Size (US$ Mn and Thousand Units) Forecast, by Distribution Channel, 2017 - 2031
11.9.1. Online
11.9.1.1. E-commerce Websites
11.9.1.2. Company-owned Websites
11.9.2. Offline
11.9.2.1. Specialty Stores
11.9.2.2. Other Retail Stores
11.10. Turbidimeter Market Size (US$ Mn) (Thousand Units) Forecast, by Country, 2017-2031
11.10.1. U.S.
11.10.2. Canada
11.10.3. Rest of North America
11.11. Incremental Opportunity Analysis
12. Europe Turbidimeter Market Analysis and Forecast
12.1. Regional Snapshot
12.2. Key Supplier Analysis
12.3. COVID-19 Impact Analysis
12.4. Key Trends Analysis
12.5. Price Trend Analysis
12.5.1. Weighted Average Price
12.6. Turbidimeter Market Size (US$ Mn and Thousand Units) Forecast, by Portability, 2017-2031
12.6.1. Handheld
12.6.2. Stationary
12.7. Turbidimeter Market Size (US$ Mn and Thousand Units) Forecast, by Application, 2017-2031
12.7.1. On-field
12.7.2. Off-field
12.8. Turbidimeter Market Size (US$ Mn and Thousand Units) Forecast, by End-use Industry, 2017-2031
12.8.1. Wastewater Treatment
12.8.2. Chemicals & Materials
12.8.3. Oil & Gas
12.8.4. Pharmaceuticals
12.8.5. Pulp & Paper
12.8.6. Food & Beverage
12.8.7. Research & Academia
12.8.8. Others
12.9. Turbidimeter Market Size (US$ Mn and Thousand Units) Forecast, by Distribution Channel, 2017 - 2031
12.9.1. Online
12.9.1.1. E-commerce Websites
12.9.1.2. Company-owned Websites
12.9.2. Offline
12.9.2.1. Specialty Stores
12.9.2.2. Other Retail Stores
12.10. Turbidimeter Market Size (US$ Mn) (Thousand Units) Forecast, by Country, 2017-2031
12.10.1. Germany
12.10.2. Italy
12.10.3. France
12.10.4. U.K.
12.10.5. Spain
12.10.6. Benelux
12.10.7. Russia
12.10.8. Rest of Europe
12.11. Incremental Opportunity Analysis
13. Latin America Turbidimeter Market Analysis and Forecast
13.1. Regional Snapshot
13.2. Key Supplier Analysis
13.3. COVID-19 Impact Analysis
13.4. Key Trends Analysis
13.5. Price Trend Analysis
13.5.1. Weighted Average Price
13.6. Turbidimeter Market Size (US$ Mn and Thousand Units) Forecast, by Portability, 2017-2031
13.6.1. Handheld
13.6.2. Stationary
13.7. Turbidimeter Market Size (US$ Mn and Thousand Units) Forecast, by Application, 2017-2031
13.7.1. On-field
13.7.2. Off-field
13.8. Turbidimeter Market Size (US$ Mn and Thousand Units) Forecast, by End-use Industry, 2017-2031
13.8.1. Wastewater Treatment
13.8.2. Chemicals & Materials
13.8.3. Oil & Gas
13.8.4. Pharmaceuticals
13.8.5. Pulp & Paper
13.8.6. Food & Beverage
13.8.7. Research & Academia
13.8.8. Others
13.9. Turbidimeter Market Size (US$ Mn and Thousand Units) Forecast, by Distribution Channel, 2017 - 2031
13.9.1. Online
13.9.1.1. E-commerce Websites
13.9.1.2. Company-owned Websites
13.9.2. Offline
13.9.2.1. Specialty Stores
13.9.2.2. Other Retail Stores
13.10. Turbidimeter Market Size (US$ Mn) (Thousand Units) Forecast, by Country, 2017-2031
13.10.1. Brazil
13.10.2. Mexico
13.10.3. Rest of Latin America
13.11. Incremental Opportunity Analysis
14. Middle East & Africa Turbidimeter Market Analysis and Forecast
14.1. Regional Snapshot
14.2. Key Supplier Analysis
14.3. COVID-19 Impact Analysis
14.4. Key Trends Analysis
14.5. Price Trend Analysis
14.5.1. Weighted Average Price
14.6. Turbidimeter Market Size (US$ Mn and Thousand Units) Forecast, by Portability, 2017-2031
14.6.1. Handheld
14.6.2. Stationary
14.7. Turbidimeter Market Size (US$ Mn and Thousand Units) Forecast, by Application, 2017-2031
14.7.1. On-field
14.7.2. Off-field
14.8. Turbidimeter Market Size (US$ Mn and Thousand Units) Forecast, by End-use Industry, 2017-2031
14.8.1. Wastewater Treatment
14.8.2. Chemicals & Materials
14.8.3. Oil & Gas
14.8.4. Pharmaceuticals
14.8.5. Pulp & Paper
14.8.6. Food & Beverage
14.8.7. Research & Academia
14.8.8. Others
14.9. Turbidimeter Market Size (US$ Mn and Thousand Units) Forecast, by Distribution Channel, 2017 - 2031
14.9.1. Online
14.9.1.1. E-commerce Websites
14.9.1.2. Company-owned Websites
14.9.2. Offline
14.9.2.1. Specialty Stores
14.9.2.2. Other Retail Stores
14.10. Turbidimeter Market Size (US$ Mn) (Thousand Units) Forecast, by Country, 2017-2031
14.10.1. GCC Countries
14.10.2. Turkey
14.10.3. Northern Africa
14.10.4. South Africa
14.10.5. Rest of Middle East & Africa
14.11. Incremental Opportunity Analysis
15. East Asia Turbidimeter Market Analysis and Forecast
15.1. Regional Snapshot
15.2. Key Supplier Analysis
15.3. COVID-19 Impact Analysis
15.4. Key Trends Analysis
15.5. Price Trend Analysis
15.5.1. Weighted Average Price
15.6. Turbidimeter Market Size (US$ Mn and Thousand Units) Forecast, by Portability, 2017-2031
15.6.1. Handheld
15.6.2. Stationary
15.7. Turbidimeter Market Size (US$ Mn and Thousand Units) Forecast, by Application, 2017-2031
15.7.1. On-field
15.7.2. Off-field
15.8. Turbidimeter Market Size (US$ Mn and Thousand Units) Forecast, by End-use Industry, 2017-2031
15.8.1. Wastewater Treatment
15.8.2. Chemicals & Materials
15.8.3. Oil & Gas
15.8.4. Pharmaceuticals
15.8.5. Pulp & Paper
15.8.6. Food & Beverage
15.8.7. Research & Academia
15.8.8. Others
15.9. Turbidimeter Market Size (US$ Mn and Thousand Units) Forecast, by Distribution Channel, 2017 - 2031
15.9.1. Online
15.9.1.1. E-commerce Websites
15.9.1.2. Company-owned Websites
15.9.2. Offline
15.9.2.1. Specialty Stores
15.9.2.2. Other Retail Stores
15.10. Turbidimeter Market Size (US$ Mn) (Thousand Units) Forecast, by Country, 2017-2031
15.10.1. China
15.10.2. Japan
15.10.3. South Korea
15.10.4. Rest of East Asia
15.11. Incremental Opportunity Analysis
16. South Asia Turbidimeter Market Analysis and Forecast
16.1. Regional Snapshot
16.2. Key Supplier Analysis
16.3. COVID-19 Impact Analysis
16.4. Key Trends Analysis
16.5. Price Trend Analysis
16.5.1. Weighted Average Price
16.6. Turbidimeter Market Size (US$ Mn and Thousand Units) Forecast, by Portability, 2017-2031
16.6.1. Handheld
16.6.2. Stationary
16.7. Turbidimeter Market Size (US$ Mn and Thousand Units) Forecast, by Application, 2017-2031
16.7.1. On-field
16.7.2. Off-field
16.8. Turbidimeter Market Size (US$ Mn and Thousand Units) Forecast, by End-use Industry, 2017-2031
16.8.1. Wastewater Treatment
16.8.2. Chemicals & Materials
16.8.3. Oil & Gas
16.8.4. Pharmaceuticals
16.8.5. Pulp & Paper
16.8.6. Food & Beverage
16.8.7. Research & Academia
16.8.8. Others
16.9. Turbidimeter Market Size (US$ Mn and Thousand Units) Forecast, by Distribution Channel, 2017 - 2031
16.9.1. Online
16.9.1.1. E-commerce Websites
16.9.1.2. Company-owned Websites
16.9.2. Offline
16.9.2.1. Specialty Stores
16.9.2.2. Other Retail Stores
16.10. Turbidimeter Market Size (US$ Mn) (Thousand Units) Forecast, by Country, 2017-2031
16.10.1. India
16.10.2. Thailand
16.10.3. Indonesia
16.10.4. Malaysia
16.10.5. Rest of South Asia
16.11. Incremental Opportunity Analysis
17. Oceania Turbidimeter Market Analysis and Forecast
17.1. Regional Snapshot
17.2. Key Supplier Analysis
17.3. COVID-19 Impact Analysis
17.4. Key Trends Analysis
17.5. Price Trend Analysis
17.5.1. Weighted Average Price
17.6. Turbidimeter Market Size (US$ Mn and Thousand Units) Forecast, by Portability, 2017-2031
17.6.1. Handheld
17.6.2. Stationary
17.7. Turbidimeter Market Size (US$ Mn and Thousand Units) Forecast, by Application, 2017-2031
17.7.1. On-field
17.7.2. Off-field
17.8. Turbidimeter Market Size (US$ Mn and Thousand Units) Forecast, by End-use Industry, 2017-2031
17.8.1. Wastewater Treatment
17.8.2. Chemicals & Materials
17.8.3. Oil & Gas
17.8.4. Pharmaceuticals
17.8.5. Pulp & Paper
17.8.6. Food & Beverage
17.8.7. Research & Academia
17.8.8. Others
17.9. Turbidimeter Market Size (US$ Mn and Thousand Units) Forecast, by Distribution Channel, 2017 - 2031
17.9.1. Online
17.9.1.1. E-commerce Websites
17.9.1.2. Company-owned Websites
17.9.2. Offline
17.9.2.1. Specialty Stores
17.9.2.2. Other Retail Stores
17.10. Turbidimeter Market Size (US$ Mn) (Thousand Units) Forecast, by Country, 2017-2031
17.10.1. Australia
17.10.2. New Zealand
17.10.3. Rest of Oceania
17.11. Incremental Opportunity Analysis
18. Competition Landscape
18.1. Market Player – Competition Dashboard
18.2. Market Share Analysis – 2021 (%)
18.3. Company Profiles (Details – Company Overview, Sales Area/Geographical Presence, Revenue, Strategy & Business Overview, Go-To-Market Strategy)
18.3.1. AQUALYTIC
18.3.1.1. Company Overview
18.3.1.2. Sales Area/Geographical Presence
18.3.1.3. Revenue
18.3.1.4. Strategy & Business Overview
18.3.1.5. Go-To-Market Strategy
18.3.2. DKK-TOA
18.3.2.1. Company Overview
18.3.2.2. Sales Area/Geographical Presence
18.3.2.3. Revenue
18.3.2.4. Strategy & Business Overview
18.3.2.5. Go-To-Market Strategy
18.3.3. Hach
18.3.3.1. Company Overview
18.3.3.2. Sales Area/Geographical Presence
18.3.3.3. Revenue
18.3.3.4. Strategy & Business Overview
18.3.3.5. Go-To-Market Strategy
18.3.4. Hanna Instruments Ltd
18.3.4.1. Company Overview
18.3.4.2. Sales Area/Geographical Presence
18.3.4.3. Revenue
18.3.4.4. Strategy & Business Overview
18.3.4.5. Go-To-Market Strategy
18.3.5. HF Scientific
18.3.5.1. Company Overview
18.3.5.2. Sales Area/Geographical Presence
18.3.5.3. Revenue
18.3.5.4. Strategy & Business Overview
18.3.5.5. Go-To-Market Strategy
18.3.6. OPTEX Environment
18.3.6.1. Company Overview
18.3.6.2. Sales Area/Geographical Presence
18.3.6.3. Revenue
18.3.6.4. Strategy & Business Overview
18.3.6.5. Go-To-Market Strategy
18.3.7. Palintest
18.3.7.1. Company Overview
18.3.7.2. Sales Area/Geographical Presence
18.3.7.3. Revenue
18.3.7.4. Strategy & Business Overview
18.3.7.5. Go-To-Market Strategy
18.3.8. Panomex Inc
18.3.8.1. Company Overview
18.3.8.2. Sales Area/Geographical Presence
18.3.8.3. Revenue
18.3.8.4. Strategy & Business Overview
18.3.8.5. Go-To-Market Strategy
18.3.9. Tintometer
18.3.9.1. Company Overview
18.3.9.2. Sales Area/Geographical Presence
18.3.9.3. Revenue
18.3.9.4. Strategy & Business Overview
18.3.9.5. Go-To-Market Strategy
18.3.10. TPS
18.3.10.1. Company Overview
18.3.10.2. Sales Area/Geographical Presence
18.3.10.3. Revenue
18.3.10.4. Strategy & Business Overview
18.3.10.5. Go-To-Market Strategy
18.3.11. VELP Scientifica
18.3.11.1. Company Overview
18.3.11.2. Sales Area/Geographical Presence
18.3.11.3. Revenue
18.3.11.4. Strategy & Business Overview
18.3.11.5. Go-To-Market Strategy
18.3.12. WTW
18.3.12.1. Company Overview
18.3.12.2. Sales Area/Geographical Presence
18.3.12.3. Revenue
18.3.12.4. Strategy & Business Overview
18.3.12.5. Go-To-Market Strategy
19. Key Takeaways
19.1. Identification of Potential Market Spaces
19.1.1. Type
19.1.2. Portability
19.1.3. Application
19.1.4. End-use Industry
19.1.5. Distribution Channel
19.1.6. Region
19.2. Prevailing Market Risks
List of Tables
Table 1: Global Turbidimeter Market Value, by Portability, US$ Mn, 2017-2031
Table 2: Global Turbidimeter Market Volume, by Portability, Thousand Units, 2017-2031
Table 3: Global Turbidimeter Market Value, by Application, US$ Mn, 2017-2031
Table 4: Global Turbidimeter Market Volume, by Application, Thousand Units, 2017-2031
Table 5: Global Turbidimeter Market Value, by End-use Industry, US$ Mn, 2017-2031
Table 6: Global Turbidimeter Market Volume, by End-use Industry, Thousand Units, 2017-2031
Table 7: Global Turbidimeter Market Value, by Distribution Channel, US$ Mn, 2017-2031
Table 8: Global Turbidimeter Market Volume, by Distribution Channel, Thousand Units, 2017-2031
Table 9: Global Turbidimeter Market Value, by Region, US$ Mn, 2017-2031
Table 10: Global Turbidimeter Market Volume, by Region, Thousand Units, 2017-2031
Table 11: North America Turbidimeter Market Value, by Portability, US$ Mn, 2017-2031
Table 12: North America Turbidimeter Market Volume, by Portability, Thousand Units, 2017-2031
Table 13: North America Turbidimeter Market Value, by Application, US$ Mn, 2017-2031
Table 14: North America Turbidimeter Market Volume, by Application, Thousand Units, 2017-2031
Table 15: North America Turbidimeter Market Value, by End-use Industry, US$ Mn, 2017-2031
Table 16: North America Turbidimeter Market Volume, by End-use Industry, Thousand Units, 2017-2031
Table 17: North America Turbidimeter Market Value, by Distribution Channel, US$ Mn, 2017-2031
Table 18: North America Turbidimeter Market Volume, by Distribution Channel, Thousand Units, 2017-2031
Table 19: North America Turbidimeter Market Value, by Country/Sub-Region, US$ Mn, 2017-2031
Table 20: North America Turbidimeter Market Volume, by Country/Sub-Region, Thousand Units, 2017-2031
Table 21: Europe Turbidimeter Market Value, by Portability, US$ Mn, 2017-2031
Table 22: Europe Turbidimeter Market Volume, by Portability, Thousand Units, 2017-2031
Table 23: Europe Turbidimeter Market Value, by Application, US$ Mn, 2017-2031
Table 24: Europe Turbidimeter Market Volume, by Application, Thousand Units, 2017-2031
Table 25: Europe Turbidimeter Market Value, by End-use Industry, US$ Mn, 2017-2031
Table 26: Europe Turbidimeter Market Volume, by End-use Industry, Thousand Units, 2017-2031
Table 27: Europe Turbidimeter Market Value, by Distribution Channel, US$ Mn, 2017-2031
Table 28: Europe Turbidimeter Market Volume, by Distribution Channel, Thousand Units, 2017-2031
Table 29: Europe Turbidimeter Market Value, by Country/Sub-Region, US$ Mn, 2017-2031
Table 30: Europe Turbidimeter Market Volume, by Country/Sub-Region, Thousand Units, 2017-2031
Table 31: Latin America Turbidimeter Market Volume, by Portability, US$ Mn, 2017-2031
Table 32: Latin America Turbidimeter Market Volume, by Portability, Thousand Units, 2017-2031
Table 33: Latin America Turbidimeter Market Value, by Application, US$ Mn, 2017-2031
Table 34: Latin America Turbidimeter Market Volume, by Application, Thousand Units, 2017-2031
Table 35: Latin America Turbidimeter Market Value, by End-use Industry, US$ Mn, 2017-2031
Table 36: Latin America Turbidimeter Market Volume, by End-use Industry, Thousand Units, 2017-2031
Table 37: Latin America Turbidimeter Market Value, by Distribution Channel, US$ Mn, 2017-2031
Table 38: Latin America Turbidimeter Market Volume, by Distribution Channel, Thousand Units, 2017-2031
Table 39: Latin America Turbidimeter Market Value, by Country/Sub-Region, US$ Mn, 2017-2031
Table 40: Latin America Turbidimeter Market Volume, by Country/Sub-Region, Thousand Units, 2017-2031
Table 41: MEA Turbidimeter Market Value, by Portability, US$ Mn, 2017-2031
Table 42: MEA Turbidimeter Market Volume, by Portability, Thousand Units, 2017-2031
Table 43: MEA Turbidimeter Market Value, by Application, US$ Mn, 2017-2031
Table 44: MEA Turbidimeter Market Volume, by Application, Thousand Units, 2017-2031
Table 45: MEA Turbidimeter Market Value, by End-use Industry, US$ Mn, 2017-2031
Table 46: MEA Turbidimeter Market Volume, by End-use Industry, Thousand Units, 2017-2031
Table 47: MEA Turbidimeter Market Value, by Distribution Channel, US$ Mn, 2017-2031
Table 48: MEA Turbidimeter Market Volume, by Distribution Channel, Thousand Units, 2017-2031
Table 49: MEA Turbidimeter Market Value, by Country/Sub-Region, US$ Mn, 2017-2031
Table 50: MEA Turbidimeter Market Volume, by Country/Sub-Region, Thousand Units, 2017-2031
Table 51: East Asia Turbidimeter Market Value, by Portability, US$ Mn, 2017-2031
Table 52: East Asia Turbidimeter Market Volume, by Portability, Thousand Units, 2017-2031
Table 53: East Asia Turbidimeter Market Value, by Application, US$ Mn, 2017-2031
Table 54: East Asia Turbidimeter Market Volume, by Application, Thousand Units, 2017-2031
Table 55: East Asia Turbidimeter Market Value, by End-use Industry, US$ Mn, 2017-2031
Table 56: East Asia Turbidimeter Market Volume, by End-use Industry, Thousand Units, 2017-2031
Table 57: East Asia Turbidimeter Market Value, by Distribution Channel, US$ Mn, 2017-2031
Table 58: East Asia Turbidimeter Market Volume, by Distribution Channel, Thousand Units, 2017-2031
Table 59: East Asia Turbidimeter Market Value, by Country/Sub-Region, US$ Mn, 2017-2031
Table 60: East Asia Turbidimeter Market Volume, by Country/Sub-Region, Thousand Units, 2017-2031
Table 61: South Asia Turbidimeter Market Value, by Portability, US$ Mn, 2017-2031
Table 62: South Asia Turbidimeter Market Volume, by Portability, Thousand Units, 2017-2031
Table 63: South Asia Turbidimeter Market Value, by Application, US$ Mn, 2017-2031
Table 64: South Asia Turbidimeter Market Volume, by Application, Thousand Units, 2017-2031
Table 65: South Asia Turbidimeter Market Value, by End-use Industry, US$ Mn, 2017-2031
Table 66: South Asia Turbidimeter Market Volume, by End-use Industry, Thousand Units, 2017-2031
Table 67: South Asia Turbidimeter Market Value, by Distribution Channel, US$ Mn, 2017-2031
Table 68: South Asia Turbidimeter Market Volume, by Distribution Channel, Thousand Units, 2017-2031
Table 69: South Asia Turbidimeter Market Value, by Country/Sub-Region, US$ Mn, 2017-2031
Table 70: South Asia Turbidimeter Market Volume, by Country/Sub-Region, Thousand Units, 2017-2031
Table 71: Oceania Turbidimeter Market Value, by Portability, US$ Mn, 2017-2031
Table 72: Oceania Turbidimeter Market Volume, by Portability, Thousand Units, 2017-2031
Table 73: Oceania Turbidimeter Market Value, by Application, US$ Mn, 2017-2031
Table 74: Oceania Turbidimeter Market Volume, by Application, Thousand Units, 2017-2031
Table 75: Oceania Turbidimeter Market Value, by End-use Industry, US$ Mn, 2017-2031
Table 76: Oceania Turbidimeter Market Volume, by End-use Industry, Thousand Units, 2017-2031
Table 77: Oceania Turbidimeter Market Value, by Distribution Channel, US$ Mn, 2017-2031
Table 78: Oceania Turbidimeter Market Volume, by Distribution Channel, Thousand Units, 2017-2031
Table 79: Oceania Turbidimeter Market Value, by Country/Sub-Region, US$ Mn, 2017-2031
Table 80: Oceania Turbidimeter Market Volume, by Country/Sub-Region, Thousand Units, 2017-2031
List of Figures
Figure 1: Global Turbidimeter Market Value, by Portability, US$ Mn, 2017-2031
Figure 2: Global Turbidimeter Market Volume, by Portability, Thousand Units, 2017-2031
Figure 3: Global Turbidimeter Market Incremental Opportunity, by Portability, 2021-2031
Figure 4: Global Turbidimeter Market Value, by Application, US$ Mn, 2017-2031
Figure 5: Global Turbidimeter Market Volume, by Application, Thousand Units, 2017-2031
Figure 6: Global Turbidimeter Market Incremental Opportunity, by Application, 2021-2031
Figure 7: Global Turbidimeter Market Value, by End-use Industry, US$ Mn, 2017-2031
Figure 8: Global Turbidimeter Market Volume, by End-use Industry, Thousand Units, 2017-2031
Figure 9: Global Turbidimeter Market Incremental Opportunity, by End-use Industry, 2021-2031
Figure 10: Global Turbidimeter Market Value, by Distribution Channel, US$ Mn, 2017-2031
Figure 11: Global Turbidimeter Market Volume, by Distribution Channel, Thousand Units, 2017-2031
Figure 12: Global Turbidimeter Market Incremental Opportunity, by Distribution Channel, 2021-2031
Figure 13: Global Turbidimeter Market Value, by Region, US$ Mn, 2017-2031
Figure 14: Global Turbidimeter Market Volume, by Region, Thousand Units, 2017-2031
Figure 15: Global Turbidimeter Market Incremental Opportunity, by Region,2021-2031
Figure 16: North America Turbidimeter Market Value, by Portability, US$ Mn, 2017-2031
Figure 17: North America Turbidimeter Market Volume, by Portability, Thousand Units, 2017-2031
Figure 18: North America Turbidimeter Market Incremental Opportunity, by Portability, 2021-2031
Figure 19: North America Turbidimeter Market Value, by Application, US$ Mn, 2017-2031
Figure 20: North America Turbidimeter Market Volume, by Application, Thousand Units, 2017-2031
Figure 21: North America Turbidimeter Market Incremental Opportunity, by Application, 2021-2031
Figure 22: North America Turbidimeter Market Value, by End-use Industry, US$ Mn, 2017-2031
Figure 23: North America Turbidimeter Market Volume, by End-use Industry, Thousand Units, 2017-2031
Figure 24: North America Turbidimeter Market Incremental Opportunity, by End-use Industry, 2021-2031
Figure 25: North America Turbidimeter Market Value, by Distribution Channel, US$ Mn, 2017-2031
Figure 26: North America Turbidimeter Market Volume, by Distribution Channel, Thousand Units, 2017-2031
Figure 27: North America Turbidimeter Market Incremental Opportunity, by Distribution Channel, 2021-2031
Figure 28: North America Turbidimeter Market Value, by Country/Sub-Region, US$ Mn, 2017-2031
Figure 29: North America Turbidimeter Market Volume, by Country/Sub-Region, Thousand Units, 2017-2031
Figure 30: North America Turbidimeter Market Incremental Opportunity, by Country/Sub-Region, 2021-2031
Figure 31: Europe Turbidimeter Market Value, by Portability, US$ Mn, 2017-2031
Figure 32: Europe Turbidimeter Market Volume, by Portability, Thousand Units, 2017-2031
Figure 33: Europe Turbidimeter Market Incremental Opportunity, by Portability, 2021-2031
Figure 34: Europe Turbidimeter Market Value, by Application, US$ Mn, 2017-2031
Figure 35: Europe Turbidimeter Market Volume, by Application, Thousand Units, 2017-2031
Figure 36: Europe Turbidimeter Market Incremental Opportunity, by Application, 2021-2031
Figure 37: Europe Turbidimeter Market Value, by End-use Industry, US$ Mn, 2017-2031
Figure 38: Europe Turbidimeter Market Volume, by End-use Industry, Thousand Units, 2017-2031
Figure 39: Europe Turbidimeter Market Incremental Opportunity, by End-use Industry, 2021-2031
Figure 40: Europe Turbidimeter Market Value, by Distribution Channel, US$ Mn, 2017-2031
Figure 41: Europe Turbidimeter Market Volume, by Distribution Channel, Thousand Units, 2017-2031
Figure 42: Europe Turbidimeter Market Incremental Opportunity, by Distribution Channel, 2021-2031
Figure 43: Europe Turbidimeter Market Value, by Country/Sub-Region, US$ Mn, 2017-2031
Figure 44: Europe Turbidimeter Market Volume, by Country/Sub-Region, Thousand Units, 2017-2031
Figure 45: Europe Turbidimeter Market Incremental Opportunity, by Country/Sub-Region, 2021-2031
Figure 46: Latin America Turbidimeter Market Value, by Portability, US$ Mn, 2017-2031
Figure 47: Latin America Turbidimeter Market Volume, by Portability, Thousand Units, 2017-2031
Figure 48: Latin America Turbidimeter Market Incremental Opportunity, by Portability, 2021-2031
Figure 49: Latin America Turbidimeter Market Value, by Application, US$ Mn, 2017-2031
Figure 50: Latin America Turbidimeter Market Volume, by Application, Thousand Units, 2017-2031
Figure 51: Latin America Turbidimeter Market Incremental Opportunity, by Application, 2021-2031
Figure 52: Latin America Turbidimeter Market Value, by End-use Industry, US$ Mn, 2017-2031
Figure 53: Latin America Turbidimeter Market Volume, by End-use Industry, Thousand Units, 2017-2031
Figure 54: Latin America Turbidimeter Market Incremental Opportunity, by End-use Industry, 2021-2031
Figure 55: Latin America Turbidimeter Market Value, by Distribution Channel, US$ Mn, 2017-2031
Figure 56: Latin America Turbidimeter Market Volume, by Distribution Channel, Thousand Units, 2017-2031
Figure 57: Latin America Turbidimeter Market Incremental Opportunity, by Distribution Channel, 2021-2031
Figure 58: Latin America Turbidimeter Market Value, by Country/Sub-Region, US$ Mn, 2017-2031
Figure 59: Latin America Turbidimeter Market Volume, by Country/Sub-Region, Thousand Units, 2017-2031
Figure 60: Latin America Turbidimeter Market Incremental Opportunity, by Country/Sub-Region, 2021-2031
Figure 61: MEA Turbidimeter Market Value, by Portability, US$ Mn, 2017-2031
Figure 62: MEA Turbidimeter Market Volume, by Portability, Thousand Units, 2017-2031
Figure 63: MEA Turbidimeter Market Incremental Opportunity, by Portability, 2021-2031
Figure 64: MEA Turbidimeter Market Value, by Application, US$ Mn, 2017-2031
Figure 65: MEA Turbidimeter Market Volume, by Application, Thousand Units, 2017-2031
Figure 66: MEA Turbidimeter Market Incremental Opportunity, by Application, 2021-2031
Figure 67: MEA Turbidimeter Market Value, by End-use Industry, US$ Mn, 2017-2031
Figure 68: MEA Turbidimeter Market Volume, by End-use Industry, Thousand Units, 2017-2031
Figure 69: MEA Turbidimeter Market Incremental Opportunity, by End-use Industry, 2021-2031
Figure 70: MEA Turbidimeter Market Value, by Distribution Channel, US$ Mn, 2017-2031
Figure 71: MEA Turbidimeter Market Volume, by Distribution Channel, Thousand Units, 2017-2031
Figure 72: MEA Turbidimeter Market Incremental Opportunity, by Distribution Channel, 2021-2031
Figure 73: MEA Turbidimeter Market Value, by Country/Sub-Region, US$ Mn, 2017-2031
Figure 74: MEA Turbidimeter Market Volume, by Country/Sub-Region, Thousand Units, 2017-2031
Figure 75: MEA Turbidimeter Market Incremental Opportunity, by Country/Sub-Region, 2021-2031
Figure 76: East Asia Turbidimeter Market Value, by Portability, US$ Mn, 2017-2031
Figure 77: East Asia Turbidimeter Market Volume, by Portability, Thousand Units, 2017-2031
Figure 78: East Asia Turbidimeter Market Incremental Opportunity, by Portability, 2021-2031
Figure 79: East Asia Turbidimeter Market Value, by Application, US$ Mn, 2017-2031
Figure 80: East Asia Turbidimeter Market Volume, by Application, Thousand Units, 2017-2031
Figure 81: East Asia Turbidimeter Market Incremental Opportunity, by Application, 2021-2031
Figure 82: East Asia Turbidimeter Market Value, by End-use Industry, US$ Mn, 2017-2031
Figure 83: East Asia Turbidimeter Market Volume, by End-use Industry, Thousand Units, 2017-2031
Figure 84: East Asia Turbidimeter Market Incremental Opportunity, by End-use Industry, 2021-2031
Figure 85: East Asia Turbidimeter Market Value, by Distribution Channel, US$ Mn, 2017-2031
Figure 86: East Asia Turbidimeter Market Volume, by Distribution Channel, Thousand Units, 2017-2031
Figure 87: East Asia Turbidimeter Market Incremental Opportunity, by Distribution Channel, 2021-2031
Figure 88: East Asia Turbidimeter Market Value, by Country/Sub-Region, US$ Mn, 2017-2031
Figure 89: East Asia Turbidimeter Market Volume, by Country/Sub-Region, Thousand Units, 2017-2031
Figure 90: East Asia Turbidimeter Market Incremental Opportunity, by Country/Sub-Region, 2021-2031
Figure 91: South Asia Turbidimeter Market Value, by Portability, US$ Mn, 2017-2031
Figure 92: South Asia Turbidimeter Market Volume, by Portability, Thousand Units, 2017-2031
Figure 93: South Asia Turbidimeter Market Incremental Opportunity, by Portability, 2021-2031
Figure 94: South Asia Turbidimeter Market Value, by Application, US$ Mn, 2017-2031
Figure 95: South Asia Turbidimeter Market Volume, by Application, Thousand Units, 2017-2031
Figure 96: South Asia Turbidimeter Market Incremental Opportunity, by Application, 2021-2031
Figure 97: South Asia Turbidimeter Market Value, by End-use Industry, US$ Mn, 2017-2031
Figure 98: South Asia Turbidimeter Market Volume, by End-use Industry, Thousand Units, 2017-2031
Figure 99: South Asia Turbidimeter Market Incremental Opportunity, by End-use Industry, 2021-2031
Figure 100: South Asia Turbidimeter Market Value, by Distribution Channel, US$ Mn, 2017-2031
Figure 101: South Asia Turbidimeter Market Volume, by Distribution Channel, Thousand Units, 2017-2031
Figure 102: South Asia Turbidimeter Market Incremental Opportunity, by Distribution Channel, 2021-2031
Figure 103: South Asia Turbidimeter Market Value, by Country/Sub-Region, US$ Mn, 2017-2031
Figure 104: South Asia Turbidimeter Market Volume, by Country/Sub-Region, Thousand Units, 2017-2031
Figure 105: South Asia Turbidimeter Market Incremental Opportunity, by Country/Sub-Region, 2021-2031
Figure 106: Oceania Turbidimeter Market Value, by Portability, US$ Mn, 2017-2031
Figure 107: Oceania Turbidimeter Market Volume, by Portability, Thousand Units, 2017-2031
Figure 108: Oceania Turbidimeter Market Incremental Opportunity, by Portability, 2021-2031
Figure 109: Oceania Turbidimeter Market Value, by Application, US$ Mn, 2017-2031
Figure 110: Oceania Turbidimeter Market Volume, by Application, Thousand Units, 2017-2031
Figure 111: Oceania Turbidimeter Market Incremental Opportunity, by Application, 2021-2031
Figure 112: Oceania Turbidimeter Market Value, by End-use Industry, US$ Mn, 2017-2031
Figure 113: Oceania Turbidimeter Market Volume, by End-use Industry, Thousand Units, 2017-2031
Figure 114: Oceania Turbidimeter Market Incremental Opportunity, by End-use Industry, 2021-2031
Figure 115: Oceania Turbidimeter Market Value, by Distribution Channel, US$ Mn, 2017-2031
Figure 116: Oceania Turbidimeter Market Volume, by Distribution Channel, Thousand Units, 2017-2031
Figure 117: Oceania Turbidimeter Market Incremental Opportunity, by Distribution Channel, 2021-2031
Figure 118: Oceania Turbidimeter Market Value, by Country/Sub-Region, US$ Mn, 2017-2031
Figure 119: Oceania Turbidimeter Market Volume, by Country/Sub-Region, Thousand Units, 2017-2031
Figure 120: Oceania Turbidimeter Market Incremental Opportunity, by Country/Sub-Region, 2021-2031
Copyright © Transparency Market Research, Inc. All Rights reserved
Trust Online

Turbidimeter Market