
Reports
Reports
The global traction equipment market is extremely technology-centric and is immensely fragmented. Despite the fact that only companies that can provide cost-effective and high-efficiency products can sustain in this market, the degree of competition is anticipated to remain high during the forecast period owing to the constant demand for traction equipment, especially from emerging markets.
The global rise in the demand for mass transportation can be attributed to the surge in investments in the expansion of railway networks across both developing and developed economies. Traction equipment is what drives locomotives and countries such as China, India, the U.S., and Germany have been presenting an increased demand for the same.
In terms of volume, the global traction equipment market was pegged at 1.18 million units in 2018. Expanding at a subdued CAGR of 2.14% from 2019 to 2027, the demand is expected to reach 1.40 million units by 2027. By cumulative revenue, the market is forecast to register a 2.40% CAGR during the same period.
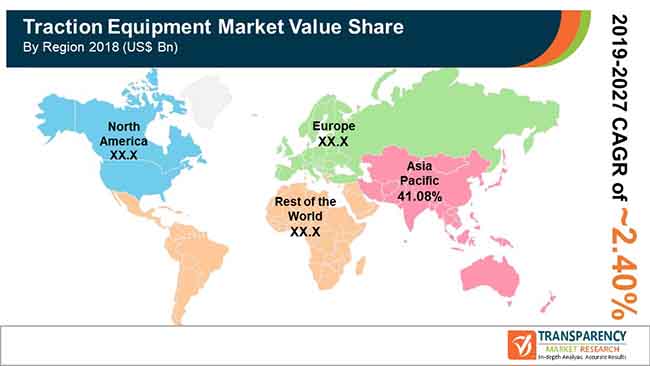
In terms of geography, the global traction equipment market has been segmented into North America, Europe, Asia Pacific, and Rest of the World. In 2018, Asia Pacific a share of around 41% both by revenue and volume and has emerged as the leading revenue generator. The region is expected to remain one of the most attractive markets for traction equipment. The significant development of trade and rapidly growing economies have contributed toward the expansion of this market. China is building a major transcontinental cargo rail service under the Silk Road Economic Belt project, which is likely to increase China’s trade with European countries. India recently announced its plans for the electrification of its existing railway network with a US$ 137 Bn investment. Australia is working toward expanding its light rail transit systems as well as intercity trains. This increased focus on expanding and upgrading railway networks and systems has boosted the APAC traction equipment market over the years.
Europe is one of the oldest markets for traction equipment as the first steam, electric, and diesel locomotives were invented in this region. The region is anticipated to trail Asia Pacific in terms of volume and revenue during the forecast period. The strengthening of emission control policies in Europe has made railways an attractive alternative to other modes of transport and this anticipated to fuel the demand for traction equipment in the region.
By type of equipment, the traction equipment market was led by traction motors. This segment accounted for a massive share of nearly 80% in 2018 and is expected to retain its lead through 2027. Traction motors are used in electric and diesel locomotives and the key suppliers of traction motors, such as ABB Ltd. and Siemens AG, have been offering customized traction motors to suit the unique requirements of locomotives. Traction converters and transformers are used in electric locomotives as well as in traction substations. The market for these will grow in the forecast period due to various projects being undertaken for the electrification of railway lines across the globe.
Leading vendors in the traction equipment market include
Traction Equipment Market is projected to reach US$ 284 Bn by the end of 2027
Traction Equipment Market is expected to grow at a CAGR of 2.40% during 2019 – 2027
Expansion and Upgrade of Rail Transit Systems is expect to drive the traction equipment market
Asia Pacific is a more attractive region for vendors in the Traction Equipment Market
Key vendors in the Traction Equipment Market are Toshiba International Corporation, TTM Rail – Transtech Melbourne Pty Ltd., Caterpillar Inc., VEM Group, Kawasaki Heavy Industries, and ABB Ltd. etc
1. Executive Summary
1.1. Market Outlook
1.2. Key Facts and Figures
1.3. Key Trends
2. Market Overview
2.1. Market Segmentation
2.2. Market Indicators
3. Market Dynamics
3.1. Drivers and Restraints Snapshot Analysis
3.1.1. Drivers
3.1.2. Restraints
3.1.3. Opportunities
3.2. Porter’s Five Forces Analysis
3.2.1. Threat of Substitutes
3.2.2. Bargaining Power of Buyers
3.2.3. Bargaining Power of Suppliers
3.2.4. Threat of New Entrants
3.2.5. Degree of Competition
3.3. Global Traction Equipment Market Outlook
3.4. Regulatory Scenario
3.5. Value Chain Analysis
4. Global Traction Equipment Market Value (US$ Mn) and Volume (Units) Analysis, by Equipment Type
4.1. Key Findings and Introduction
4.2. Global Traction Equipment Market Value (US$ Mn) and Volume (Units) Forecast, by Equipment Type, 2018–2027
4.2.1. Global Traction Equipment Market Value (US$ Mn) and Volume (Units) Forecast, by Traction Transformer, 2018–2027
4.2.2. Global Traction Equipment Market Value (US$ Mn) and Volume (Units) Forecast, by Traction Motor, 2018–2027
4.2.3. Global Traction Equipment Market Value (US$ Mn) and Volume (Units) Forecast, by Traction Converter, 2018–2027
4.3. Global Traction Equipment Market Attractiveness Analysis, by Equipment Type
5. Global Traction Equipment Market Analysis, by Region
5.1. Key Findings
5.2. Global Traction Equipment Market Value (US$ Mn) and Volume (Units) Forecast, by Region
5.2.1. North America
5.2.2. Europe
5.2.3. Asia Pacific
5.2.4. Latin America
5.2.5. Middle East
5.3. Global Traction Equipment Market Attractiveness Analysis, by Region
6. North America Traction Equipment Market Overview
6.1. Key Findings
6.2. North America Traction Equipment Market Value (US$ Mn) and Volume (Units) Forecast, by Equipment Type, 2018–2027
6.3. North America Traction Equipment Market Value (US$ Mn) and Volume (Units) Forecast, by Country
6.3.1. U.S. Traction Equipment Market Value (US$ Mn) and Volume (Units) Forecast, by Equipment Type, 2018–2027
6.3.2. Canada Traction Equipment Market Value (US$ Mn) and Volume (Units) Forecast, by Equipment Type, 2018–2027
6.4. North America Traction Equipment Market Attractiveness Analysis, by Equipment Type
6.5. North America Traction Equipment Market Attractiveness Analysis, by Country
7. Europe Traction Equipment Market Overview
7.1. Key Findings
7.2. Europe Traction Equipment Market Value (US$ Mn) and Volume (Units) Forecast, by Equipment Type, 2018–2027
7.3. Europe Traction Equipment Market Value (US$ Mn) and Volume (Units) Forecast, by Country and Sub-region
7.3.1. Germany Traction Equipment Market Value (US$ Mn) and Volume (Units) Forecast, by Equipment Type, 2018–2027
7.3.2. U.K. Traction Equipment Market Value (US$ Mn) and Volume (Units) Forecast, by Equipment Type, 2018–2027
7.3.3. France Traction Equipment Market Value (US$ Mn) and Volume (Units) Forecast, by Equipment Type, 2018–2027
7.3.4. Spain Traction Equipment Market Value (US$ Mn) and Volume (Units) Forecast, by Equipment Type, 2018–2027
7.3.5. Russia Traction Equipment Market Value (US$ Mn) and Volume (Units) Forecast, by Equipment Type, 2018–2027
7.3.6. Rest of Europe Traction Equipment Market Value (US$ Mn) and Volume (Units) Forecast, by Equipment Type, 2018–2027
7.4. Europe Traction Equipment Market Attractiveness Analysis, by Equipment Type
7.5. Europe Traction Equipment Market Attractiveness Analysis, by Country and Sub-region
8. Asia Pacific Traction Equipment Market Overview
8.1. Key Findings
8.2. Asia Pacific Traction Equipment Market Value (US$ Mn) and Volume (Units) Forecast, by Equipment Type, 2018–2027
8.3. Asia Pacific Traction Equipment Market Value (US$ Mn) and Volume (Units) Forecast, by Country and Sub-region
8.3.1. China Traction Equipment Market Value (US$ Mn) and Volume (Units) Forecast, by Equipment Type, 2018–2027
8.3.2. Japan Traction Equipment Market Value (US$ Mn) and Volume (Units) Forecast, by Equipment Type, 2018–2027
8.3.3. India Traction Equipment Market Value (US$ Mn) and Volume (Units) Forecast, by Equipment Type, 2018–2027
8.3.4. Australia Traction Equipment Market Value (US$ Mn) and Volume (Units) Forecast, by Equipment Type, 2018–2027
8.3.5. Rest of Asia Pacific Traction Equipment Market Value (US$ Mn) and Volume (Units) Forecast, by Equipment Type, 2018–2027
8.4. Asia Pacific Traction Equipment Market Attractiveness Analysis, by Equipment Type
8.5. Asia Pacific Traction Equipment Market Attractiveness Analysis, by Country and Sub-region
9. Rest of the World Traction Equipment Market Overview
9.1. Key Findings
9.2. Rest of the World Traction Equipment Market Value (US$ Mn) and Volume (Units) Forecast, by Equipment Type, 2018–2027
9.3. Rest of the World Traction Equipment Market Value (US$ Mn) and Volume (Units) Forecast, by Country and Sub-region
9.3.1. Brazil Traction Equipment Market Value (US$ Mn) and Volume (Units) Forecast, by Equipment Type, 2018–2027
9.3.2. Other Countries Traction Equipment Market Value (US$ Mn) and Volume (Units) Forecast, by Equipment Type, 2018–2027
9.4. Rest of the World Traction Equipment Market Attractiveness Analysis, by Equipment Type
9.5. Rest of the World Traction Equipment Market Attractiveness Analysis, by Country and Sub-region
10. Competition Landscape
10.1. Competition Matrix
10.2. Global Traction Equipment Market Share Analysis, by Company (2018)
10.3. Market Footprint Analysis
10.4. Company Profiles
10.4.1. ABB Group
10.4.1.1. Company Details
10.4.1.2. Company Description
10.4.1.3. Business Overview
10.4.1.4. Financial Overview
10.4.1.5. Recent Developments
10.4.2. Alstom SA
10.4.2.1. Company Details
10.4.2.2. Company Description
10.4.2.3. Business Overview
10.4.2.4. Financial Overview
10.4.2.5. Recent Developments
10.4.3. American Traction Systems
10.4.3.1. Company Details
10.4.3.2. Company Description
10.4.3.3. Business Overview
10.4.3.4. Financial Overview
10.4.3.5. Recent Developments
10.4.4. Bombardier Inc.
10.4.4.1. Company Details
10.4.4.2. Company Description
10.4.4.3. Business Overview
10.4.4.4. Financial Details
10.4.4.5. Recent Developments
10.4.5. Caterpillar Inc.
10.4.5.1. Company Details
10.4.5.2. Company Description
10.4.5.3. Business Overview
10.4.5.4. Financial Overview
10.4.5.5. Recent Developments
10.4.6. Crompton Greaves Limited
10.4.6.1. Company Details
10.4.6.2. Company Description
10.4.6.3. Business Overview
10.4.6.4. Financial Overview
10.4.6.5. Recent Developments
10.4.7. Siemens AG
10.4.7.1. Company Details
10.4.7.2. Company Description
10.4.7.3. Business Overview
10.4.7.4. Financial Details
10.4.7.5. Recent Developments
10.4.8. General Electric Company
10.4.8.1. Company Details
10.4.8.2. Company Description
10.4.8.3. Business Overview
10.4.8.4. Financial Details
10.4.8.5. Recent Developments
10.4.9. Kawasaki Heavy Industries Ltd.
10.4.9.1. Company Details
10.4.9.2. Company Description
10.4.9.3. Business Overview
10.4.9.4. Financial Overview
10.4.9.5. Recent Developments
10.4.10. Mitsubishi Electric Corporation
10.4.10.1. Company Details
10.4.10.2. Company Description
10.4.10.3. Business Overview
10.4.10.4. Financial Details
10.4.10.5. Recent Developments
10.4.11. VEM Group
10.4.11.1. Company Details
10.4.11.2. Company Description
10.4.11.3. Business Overview
10.4.11.4. Financial Overview
10.4.11.5. Recent Developments
10.4.12. Toshiba International Corporation
10.4.12.1. Company Details
10.4.12.2. Company Description
10.4.12.3. Business Overview
10.4.12.4. Financial Overview
10.4.12.5. Recent Developments
10.4.13. TTM Rail - Transtech Melbourne Pty Ltd.
10.4.13.1. Company Details
10.4.13.2. Company Description
10.4.13.3. Business Overview
10.4.13.4. Financial Overview
10.4.13.5. Recent Developments
11. Primary Research – Key Insights
12. Appendix
12.1. Research Methodology and Assumptions
List of Table
Table 1 Global Traction Equipment Market Snapshot
Table 2 Global Traction Equipment Market, By Equipment Type, Volume (Unit), 2018-2027
Table 3 Global Traction Equipment Market, By Equipment Type, Revenue (US$ Bn), 2018-2027
Table 4 Global Traction Equipment Market, Traction Transformer, Volume (Unit), 2018-2027
Table 5 Global Traction Equipment Market, Traction Transformer, Revenue (US$ Bn), 2018-2027
Table 6 Global Traction Equipment Market, Traction Motor, Volume (Unit), 2018-2027
Table 7 Global Traction Equipment Market, Traction Motor, Revenue (US$ Bn), 2018-2027
Table 8 Global Traction Equipment Market, Traction Converter, Volume (Unit), 2018-2027
Table 9 Global Traction Equipment Market, Traction Converter, Revenue (US$ Bn), 2018-2027
Table 10 Global Traction Equipment Market, By Region, Volume (Unit), 2018-2027
Table 11 Global Traction Equipment Market, By Region, Revenue (US$ Bn), 2018-2027
Table 12 North America Traction Equipment Market, By Equipment Type, Volume (Unit), 2018-2027
Table 13 North America Traction Equipment Market, By Equipment Type, Revenue (US$ Bn), 2018-2027
Table 14 U.S. Traction Equipment Market, By Equipment Type, Volume (Unit), 2018-2027
Table 15 U.S. Traction Equipment Market, By Equipment Type, Revenue (US$ Bn), 2018-2027
Table 16 Canada Traction Equipment Market, By Equipment Type, Volume (Unit), 2018-2027
Table 17 Canada Traction Equipment Market, By Equipment Type, Revenue (US$ Bn), 2018-2027
Table 18 Europe Traction Equipment Market, By Equipment Type, Volume (Unit), 2018-2027
Table 19 Europe Traction Equipment Market, By Equipment Type, Revenue (US$ Bn), 2018-2027
Table 20 Germany Traction Equipment Market, By Equipment Type, Volume (Unit), 2018-2027
Table 21 Germany Traction Equipment Market, By Equipment Type, Revenue (US$ Bn), 2018-2027
Table 22 U.K. Traction Equipment Market, By Equipment Type, Volume (Unit), 2018-2027
Table 23 U.K. Traction Equipment Market, By Equipment Type, Revenue (US$ Bn), 2018-2027
Table 24 Spain Traction Equipment Market, By Equipment Type, Volume (Unit), 2018-2027
Table 25 Spain Traction Equipment Market, By Equipment Type, Revenue (US$ Bn), 2018-2027
Table 26 France Traction Equipment Market, By Equipment Type, Volume (Unit), 2018-2027
Table 27 France Traction Equipment Market, By Equipment Type, Revenue (US$ Bn), 2018-2027
Table 28 Russia Traction Equipment Market, By Equipment Type, Volume (Unit), 2018-2027
Table 29 Russia Traction Equipment Market, By Equipment Type, Revenue (US$ Bn), 2018-2027
Table 30 Rest of Europe Traction Equipment Market, By Equipment Type, Volume (Unit), 2018-2027
Table 31 Rest of Europe Traction Equipment Market, By Equipment Type, Revenue (US$ Bn), 2018-2027
Table 32 Asia Pacific Traction Equipment Market, By Equipment Type, Volume (Unit), 2018-2027
Table 33 Asia Pacific Traction Equipment Market, By Equipment Type, Revenue (US$ Bn), 2018-2027
Table 34 China Traction Equipment Market, By Equipment Type, Volume (Unit), 2018-2027
Table 35 China Traction Equipment Market, By Equipment Type, Revenue (US$ Bn), 2018-2027
Table 36 India Traction Equipment Market, By Equipment Type, Volume (Unit), 2018-2027
Table 37 India Traction Equipment Market, By Equipment Type, Revenue (US$ Bn), 2018-2027
Table 38 Japan Traction Equipment Market, By Equipment Type, Volume (Unit), 2018-2027
Table 39 Japan Traction Equipment Market, By Equipment Type, Revenue (US$ Bn), 2018-2027
Table 40 Australia Traction Equipment Market, By Equipment Type, Volume (Unit), 2018-2027
Table 41 Australia Traction Equipment Market, By Equipment Type, Revenue (US$ Bn), 2018-2027
Table 42 Rest of Asia Pacific Traction Equipment Market, By Equipment Type, Volume (Unit), 2018-2027
Table 43 Rest of Asia Pacific Traction Equipment Market, By Equipment Type, Revenue (US$ Bn), 2018-2027
Table 44 Rest of the World Traction Equipment Market, By Equipment Type, Volume (Unit), 2018-2027
Table 45 Rest of the World Traction Equipment Market, By Equipment Type, Revenue (US$ Bn), 2018-2027
Table 46 Brazil Traction Equipment Market, By Equipment Type, Volume (Unit), 2018-2027
Table 47 Brazil Traction Equipment Market, By Equipment Type, Revenue (US$ Bn), 2018-2027
Table 48 Other Countries Traction Equipment Market, By Equipment Type, Volume (Unit), 2018-2027
Table 49 Other Countries Traction Equipment Market, By Equipment Type, Revenue (US$ Bn), 2018-2027
List of Figure
Figure 1 Traction Equipment Market: Market Segmentation
Figure 2 Global Traction Equipment Market, Estimates and Forecast, Volume (Unit), 2018–2027
Figure 3 Global Traction Equipment Market, Estimates and Forecast, Revenue (US$), 2018–2027
Figure 4 Value Chain Analysis of Traction Equipment Market
Figure 5 U.S. Freight Demand, in Bn Tons, 2015–2045
Figure 6 U.S. Greenhouse Gas Emissions from Transportation Sector, in Mn Tons, 2014–2018
Figure 7 Global Car Market, by Sales Number, Mn Units, 2014–2018
Figure 8 Global Planned and Under Construction of High-Speed Rail Lines, in Kilometers, 2015
Figure 9 Porters Five Forces Traction Equipment Market
Figure 10 Market Attractiveness Analysis of Traction Equipment Market, By Region
Figure 11 Traction Equipment Market, Company Market Share (%), 2018
Figure 12 Global Traction Equipment, Market Share, By Equipment Type, Revenue (%), 2018 & 2027
Figure 13 Global Traction Equipment Market, Traction Transformer, Volume (Unit), 2018-2027
Figure 14 Global Traction Equipment Market, Traction Transformer, Revenue (US$ Bn), 2018-2027
Figure 15 Traction Equipment Market, Traction Transformer, By Region, Volume (%), 2018 & 2027
Figure 16 Global Traction Equipment Market, Traction Motor, Volume (Unit), 2018-2027
Figure 17 Global Traction Equipment Market, Traction Motor, Revenue (US$ Bn), 2018-2027
Figure 18 Traction Equipment Market, Traction Motor, By Region, Volume (%), 2018 & 2027
Figure 19 Global Traction Equipment Market, Traction Converter, Volume (Unit), 2018-2027
Figure 20 Global Traction Equipment Market, Traction Converter, Revenue (US$ Bn), 2018-2027
Figure 21 Traction Equipment Market, Traction Converter, By Region, Volume (%), 2018 & 2027
Figure 22 Global Traction Equipment Market, By Region, Volume (Unit), 2018 & 2027
Figure 23 Global Traction Equipment Market, By Region, Revenue (US$ Bn), 2018 & 2027
Figure 24 Global Traction Equipment, Regions Market Share, Revenue (%), 2018
Figure 25 Global Traction Equipment, Regions Market Share, Revenue (%), 2027
Figure 26 North America Traction Equipment, Countries Market Share, Revenue (%), 2018
Figure 27 North America Traction Equipment, Countries Market Share, Revenue (%), 2027
Figure 28 North America Traction Equipment Market, Volume (Unit), 2018-2027
Figure 29 North America Traction Equipment Market, Revenue (US$ Bn), 2018-2027
Figure 30 U.S. Traction Equipment Market Share, Volume (Unit) and Revenue (US$ Bn), 2018-2027
Figure 31 Canada Traction Equipment Market Share, Volume (Unit) and Revenue (US$ Bn), 2018-2027
Figure 32 Europe Traction Equipment, Countries Market Share, Revenue (%), 2018
Figure 33 Europe Traction Equipment, Countries Market Share, Revenue (%), 2027
Figure 34 Europe Traction Equipment Market, Volume (Unit), 2018-2027
Figure 35 Europe Traction Equipment Market, Revenue (US$ Bn), 2018-2027
Figure 36 Germany Traction Equipment Market Share, Volume (Unit) and Revenue (US$ Bn), 2018-2027
Figure 37 U.K. Traction Equipment Market Share, Volume (Unit) and Revenue (US$ Bn), 2018-2027 U.S.
Figure 38 Spain Traction Equipment Market Share, Volume (Unit) and Revenue (US$ Bn), 2018-2027
Figure 39 France Traction Equipment Market Share, Volume (Unit) and Revenue (US$ Bn), 2018-2027
Figure 40 Russia Traction Equipment Market Share, Volume (Unit) and Revenue (US$ Bn), 2018-2027
Figure 41 Rest of Europe Traction Equipment Market Share, Volume (Unit) and Revenue (US$ Bn), 2018-2027
Figure 42 Asia Pacific Traction Equipment, Countries Market Share, Revenue (%), 2018
Figure 43 Asia Pacific Traction Equipment, Countries Market Share, Revenue (%), 2027
Figure 44 Asia Pacific Traction Equipment Market, Volume (Unit), 2018-2027
Figure 45 Asia Pacific Traction Equipment Market, Revenue (US$ Bn), 2018-2027
Figure 46 China Traction Equipment Market Share, Volume (Unit) and Revenue (US$ Bn), 2018-2027
Figure 47 India Traction Equipment Market Share, Volume (Unit) and Revenue (US$ Bn), 2018-2027 U.S.
Figure 48 Japan Traction Equipment Market Share, Volume (Unit) and Revenue (US$ Bn), 2018-2027
Figure 49 Australia Traction Equipment Market Share, Volume (Unit) and Revenue (US$ Bn), 2018-2027
Figure 50 Rest of Asia Pacific Traction Equipment Market Share, Volume (Unit) and Revenue (US$ Bn), 2018-2027
Figure 51 Rest of the World Traction Equipment, Countries Market Share, Revenue (%), 2018
Figure 52 Rest of the World Traction Equipment, Countries Market Share, Revenue (%), 2027
Figure 53 Rest of the World Traction Equipment Market, Volume (Unit), 2018-2027
Figure 54 Rest of the World Traction Equipment Market, Revenue (US$ Bn), 2018-2027
Figure 55 Brazil Traction Equipment Market Share, Volume (Unit) and Revenue (US$ Bn), 2018-2027
Figure 56 Other Countries Traction Equipment Market Share, Volume (Unit) and Revenue (US$ Bn), 2018-2027
Figure 57 ABB Ltd., Net Sales Share (%), By Region, 2015
Figure 58 ABB Ltd, By Revenue (US$ Mn), 2013-2018
Figure 59 Alstom SA, Net Sales Share (%), By Region, 2018
Figure 60 Alstom SA, Net Sales Share (%), By Product, 2018
Figure 61 Bombardier Inc., Net Sales Share (%), By Region, 2018
Figure 62 Bombardier Inc., Net Sales Share (%), By Business Segment, 2018
Figure 63 Caterpillar Inc., Net Sales Share (%), By Business Segment, 2018
Figure 64 Caterpillar Inc., By Revenue (US$ Mn), 2013-2018
Figure 65 Crompton Greaves Limited, Net Sales Share (%), By Region, 2018
Figure 66 Crompton Greaves Limited, Ltd., Net Sales Share (%), By Business Segment, 2018
Figure 67 General Electric Company, Net Sales Share (%), By Operating Segment, 2018
Figure 68 General Electric Company, Net Sales Share (%), By Region, 2018
Figure 69 Kawasaki Heavy Industries, Ltd., Net Sales Share (%), By Region, 2018
Figure 70 Kawasaki Heavy Industries, Ltd., Net Sales Share (%), By Business Segment, 2018
Figure 71 Siemens AG, By Revenue (US$ Mn), 2013-2018
Figure 72 Siemens AG, Net Sales Share (%), By Business Segment, 2018
Copyright © Transparency Market Research, Inc. All Rights reserved
Trust Online

Traction Equipment Market