
Reports
Reports
Analysts’ Viewpoint on Specialty Carbon Black Market Scenario
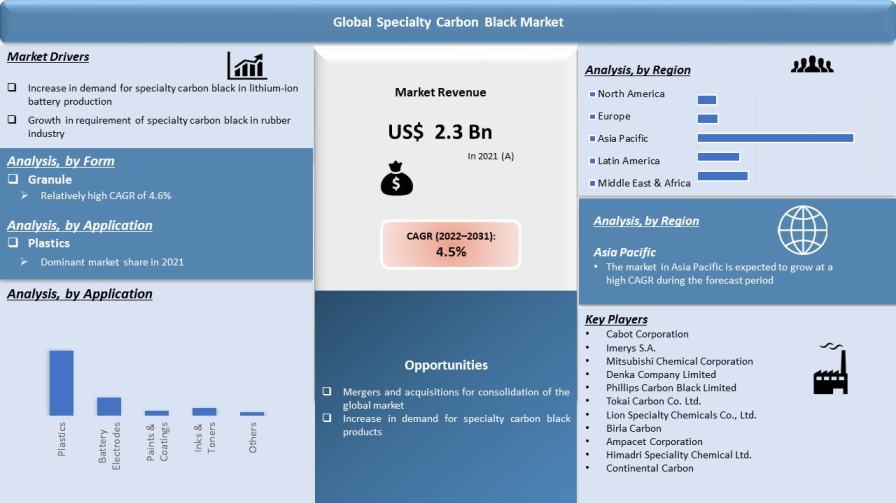
Increase in demand for specialty carbon black due to its structural integrity, cost-effectiveness, high loadability, and excellent abrasion resistance is driving the global specialty carbon black market. Specialty carbon black is used as a coloring and conductive agent in automotive coatings and industrial coatings. A key feature of specialty carbon black is its low ash content (less than 1%). Several companies are primarily focusing on manufacturing specialty carbon black, specifically for lead batteries and rubber carbon black in thermoplastics. Key players are investing in R&D activities, collaborations with other businesses, and expansion of their production capacities to strengthen their position in the market.
Specialty carbon black is a highly opaque, finely divided form of amorphous carbon that is used as a high-coverage pigment in printing inks, paints & coatings, and carbon papers. It is produced as soot from the partial combustion of hydrocarbons and is primarily used as a reinforcing agent in car tires and other rubber products. Carbon black particles are typically spherical and less consistently crystalline compared to graphite. Carbon black turns into graphite when heated over an extended period at 3,000°C (5,400°F). It has some of the largest particle sizes of any known materials, depending on the method of production.
Hydrocarbons such as oil and natural gas are used as raw materials in the thermal breakdown method or partial combustion method to create carbon black. The term ‘furnace black’ is used to distinguish carbon black that is generated using the furnace process from carbon black created using other procedures. Currently, furnace process is the most popular method used to generate carbon black.
Conductive carbon black is used in modest dosages in the cathode of modern lithium-ion batteries to establish a 3D conductive network in order to ensure that the non-conductive active materials (such as lithium-nickel-manganese-cobalt oxide) are electrically coupled to one another and the current collector. Electrical current would not flow and the battery would not function without a conductive carbon black that coats the surface of the active material in a fine network. Conductive additives must possess low resistance, high conductivity, and effective dispersibility to obtain the lowest loading in cathode preparation.
Specialty carbon black provides improved battery capacity and rate capability, which enhances the battery lifecycle. It is non-toxic, low weight, and cost effective; and offers high chemical inertness. Conductive carbon black additives can also have a significant impact on properties of anode and cathode formulation. In traditional lithium-ion battery formulations, where the active material, conductive additive, and binder are mixed into a viscous slurry, the carbon black must be well dispersed in the slurry. High-structure carbon black demonstrates easier dispersion, which can have a profound effect on the viscosity and achievable solid loading of the slurry. Slurries with higher solid loading use less solvent, which can significantly improve the efficiency of battery production. Thus, increase in demand for specialty carbon black in the electronics industry is driving the market.
Specialty carbon black is used as filler in tires and as reinforcement in other rubber goods. The interaction of elastomer molecules, rubber carbon black particles, and carbon black particles with the elastomer matrix affects the reinforcing effect. Qualities of the resulting rubber composites can be influenced by the type of carbon black used. This explains the wide range of standardized industrial carbon black grades used in tire tread and tire body rubber compounds. Carbon black filler rubber strengthens vulcanization, increases volume, and improves the physical properties of rubber.
Industrial rubber carbon black provides a wide array of product qualities - each unique to the desired application. Key features of specialty carbon black in everyday rubber applications include resistance to harsh weather and abrasion; and capacity to absorb UV light and convert it into heat.
Based on form, the global specialty carbon black market has been bifurcated into granule and powder. The granule segment accounted for 65.4% share of the global market in 2021. Carbon black granules can be easily transformed into the powder form as per requirement. Therefore, buyers prefer them over the powder form of specialty carbon black. The granule segment is likely to grow due to ease of handling, wide range of applications, and cost-effectiveness of carbon black granules.
Asia Pacific accounted for 52.8% share of the global market in 2021. Market share of the region is estimated to rise to 53.8% by 2031. Growth of the market can be ascribed to the low cost of production, rise in demand for specialty carbon black, and increase in large-volume exports by countries in the region.
Market share of North America is anticipated to decline by 0.1% during the forecast period due to stringent regulations imposed by the U.S. Environmental Protection Agency on hazardous chemicals released from specialty carbon black manufacturing facilities. Europe is also expected to record a 0.3% decrease in market share, due to the introduction of stringent regulations on environment, energy efficiency, and safe manufacturing of tires in the region in 2021. The market in Latin America and Middle East & Africa is anticipated to grow at a sluggish pace due to the lack of established end-use industries in the regions.
The global market is highly competitive, owing to the presence of several small- and medium-scale manufacturers and suppliers of specialty carbon black. Key players are investing significantly in R&D activities to introduce new products in the market. Expansion of product portfolios and mergers and acquisitions are key strategies adopted by players. Cabot Corporation, Imerys S.A., Mitsubishi Chemical Corporation, Denka Company Limited, Phillips Carbon Black Limited, Tokai Carbon Co. Ltd., Lion Specialty Chemicals Co., Ltd., Birla Carbon, Ampacet Corporation, Himadri Speciality Chemical Ltd., Continental Carbon, Orion Engineered Carbons, Asbury Carbons, Pyrolex AG, and Black Bear Carbon B.V. are leading specialty carbon black market players.
Each of these players has been profiled in the global specialty carbon black market report based on parameters such as company overview, financial overview, business strategies, product portfolio, business segments, and recent developments.
|
Attribute |
Detail |
|
Market Size Value in 2021 |
US$ 2.3 Bn |
|
Market Forecast Value in 2031 |
US$ 3.2 Bn |
|
Growth Rate (CAGR) |
4.5% |
|
Forecast Period |
2022–2031 |
|
Historical Data Available for |
2020 |
|
Quantitative Units |
US$ Bn for Value & Kilo Tons for Volume |
|
Market Analysis |
It includes cross segment analysis at global as well as regional level. Furthermore, qualitative analysis includes drivers, restraints, opportunities, key trends, Porter’s Five Forces analysis, value chain analysis, and key trend analysis. |
|
Competition Landscape |
|
|
Format |
Electronic (PDF) + Excel |
|
Market Segmentation |
|
|
Regions Covered |
|
|
Countries Covered |
|
|
Companies Profiled |
|
|
Customization Scope |
Available upon request |
|
Pricing |
Available upon request |
The specialty carbon black market stood at US$ 2.3 Bn in 2021
The specialty carbon black market is expected to grow at a CAGR of 4.5% from 2022 to 2031
Increase in demand for specialty carbon black in electronics and rubber industries
The granule segment accounted for the largest value share of 65.4% of the market in 2021
Asia Pacific was the most lucrative region with value share of 53.8% of the specialty carbon black market in 2021
Cabot Corporation, Imerys S.A., Mitsubishi Chemical Corporation, Denka Company Limited, Phillips Carbon Black Limited, Tokai Carbon Co. Ltd., Lion Specialty Chemicals Co., Ltd., Birla Carbon, Ampacet Corporation, Himadri Speciality Chemical Ltd., Continental Carbon, Orion Engineered Carbons, Asbury Carbons, Pyrolex AG, and Black Bear Carbon B.V.
1. Executive Summary
1.1. Specialty Carbon Black Market Snapshot
1.2. Current Market and Future Potential
2. Market Overview
2.1. Market Segmentation
2.2. Market Trends
2.3. Market Dynamics
2.3.1. Drivers
2.3.2. Restraints
2.3.3. Opportunities
2.4. Porter’s Five Forces Analysis
2.5. Regulatory Analysis
2.6. Value Chain Analysis
2.6.1. List of Raw Material Providers
2.6.2. List of Specialty Carbon Black Manufacturers
2.6.3. List of Dealers/Distributors
2.6.4. List of Potential Customer
3. COVID-19 Impact Analysis
4. Specialty Carbon Black Market Analysis and Forecast, by Form, 2022–2031
4.1. Introduction and Definitions
4.2. Global Specialty Carbon Black Market Volume (Kilo Tons) and Value (US$ Bn) Forecast, by Form, 2022–2031
4.2.1. Granule
4.2.2. Powder
4.3. Global Specialty Carbon Black Market Attractiveness, by Form
5. Global Specialty Carbon Black Market Analysis and Forecast, Application, 2022–2031
5.1. Introduction and Definitions
5.2. Global Specialty Carbon Black Market Volume (Kilo Tons) and Value (US$ Bn) Forecast, by Application, 2022–2031
5.2.1. Plastics
5.2.1.1. Wires & Cables
5.2.1.2. Conductive & Electrostatic Dissipative (ESD)
5.2.1.3. Other Conductive Applications
5.2.2. Battery Electrodes
5.2.2.1. Lithium-ion Batteries
5.2.2.2. Others
5.2.3. Paints & Coatings
5.2.4. Inks & Toners
5.2.5. Others (Rubber, etc.)
5.3. Global Specialty Carbon Black Market Attractiveness, by Application
6. Global Specialty Carbon Black Market Analysis and Forecast, by Region, 2022–2031
6.1. Key Findings
6.2. Global Specialty Carbon Black Market Volume (Kilo Tons) and Value (US$ Bn) Forecast, by Region, 2022–2031
6.2.1. North America
6.2.2. Europe
6.2.3. Asia Pacific
6.2.4. Latin America
6.2.5. Middle East & Africa
6.3. Global Specialty Carbon Black Market Attractiveness, by Region
7. North America Specialty Carbon Black Market Analysis and Forecast, 2022–2031
7.1. Key Findings
7.2. North America Specialty Carbon Black Market Volume (Kilo Tons) and Value (US$ Bn) Forecast, by Form, 2022–2031
7.3. North America Specialty Carbon Black Market Volume (Kilo Tons) and Value (US$ Bn) Forecast, by Application, 2022–2031
7.4. North America Specialty Carbon Black Market Volume (Kilo Tons) and Value (US$ Bn) Forecast, by Country, 2022–2031
7.4.1. U.S. Specialty Carbon Black Market Volume (Kilo Tons) and Value (US$ Bn) Forecast, by Form, 2022–2031
7.4.2. U.S. Specialty Carbon Black Market Volume (Kilo Tons) and Value (US$ Bn) Forecast, Application, 2022–2031
7.4.3. Canada Specialty Carbon Black Market Volume (Kilo Tons) and Value (US$ Bn) Forecast, by Form, 2022–2031
7.4.4. Canada Specialty Carbon Black Market Volume (Kilo Tons) and Value (US$ Bn) Forecast, Application, 2022–2031
7.5. North America Specialty Carbon Black Market Attractiveness Analysis
8. Europe Specialty Carbon Black Market Analysis and Forecast, 2022–2031
8.1. Key Findings
8.2. Europe Specialty Carbon Black Market Volume (Kilo Tons) and Value (US$ Bn) Forecast, by Form, 2022–2031
8.3. Europe Specialty Carbon Black Market Volume (Kilo Tons) and Value (US$ Bn) Forecast, by Application, 2022–2031
8.4. Europe Specialty Carbon Black Market Volume (Kilo Tons) and Value (US$ Bn) Forecast, by Country and Sub-region, 2021-2031
8.4.1. Germany Specialty Carbon Black Market Volume (Kilo Tons) and Value (US$ Bn) Forecast, by Form, 2022–2031
8.4.2. Germany Specialty Carbon Black Market Volume (Kilo Tons) and Value (US$ Bn) Forecast, Application, 2022–2031
8.4.3. France Specialty Carbon Black Market Volume (Kilo Tons) and Value (US$ Bn) Forecast, by Form, 2022–2031
8.4.4. France. Specialty Carbon Black Market Volume (Kilo Tons) and Value (US$ Bn) Forecast, Application, 2022–2031
8.4.5. U.K. Specialty Carbon Black Market Volume (Kilo Tons) and Value (US$ Bn) Forecast, by Form, 2022–2031
8.4.6. U.K. Specialty Carbon Black Market Volume (Kilo Tons) and Value (US$ Bn) Forecast, Application, 2022–2031
8.4.7. Italy Specialty Carbon Black Market Volume (Kilo Tons) and Value (US$ Bn) Forecast, by Form, 2022–2031
8.4.8. Italy Specialty Carbon Black Market Volume (Kilo Tons) and Value (US$ Bn) Forecast, Application, 2022–2031
8.4.9. Russia & CIS Specialty Carbon Black Market Volume (Kilo Tons) and Value (US$ Bn) Forecast, by Form, 2022–2031
8.4.10. Russia & CIS Specialty Carbon Black Market Volume (Kilo Tons) and Value (US$ Bn) Forecast, Application, 2022–2031
8.4.11. Rest of Europe Specialty Carbon Black Market Volume (Kilo Tons) and Value (US$ Bn) Forecast, by Form, 2022–2031
8.4.12. Rest of Europe Specialty Carbon Black Market Volume (Kilo Tons) and Value (US$ Bn) Forecast, Application, 2022–2031
8.5. Europe Specialty Carbon Black Market Attractiveness Analysis
9. Asia Pacific Specialty Carbon Black Market Analysis and Forecast, 2022–2031
9.1. Key Findings
9.2. Asia Pacific Specialty Carbon Black Market Volume (Kilo Tons) and Value (US$ Bn) Forecast, by Form
9.3. Asia Pacific Specialty Carbon Black Market Volume (Kilo Tons) and Value (US$ Bn) Forecast, by Application, 2022–2031
9.4. Asia Pacific Specialty Carbon Black Market Volume (Kilo Tons) and Value (US$ Bn) Forecast, by Country and Sub-region, 2021-2031
9.4.1. China Specialty Carbon Black Market Volume (Kilo Tons) and Value (US$ Bn) Forecast, by Form, 2022–2031
9.4.2. China Specialty Carbon Black Market Volume (Kilo Tons) and Value (US$ Bn) Forecast, Application, 2022–2031
9.4.3. Japan Specialty Carbon Black Market Volume (Kilo Tons) and Value (US$ Bn) Forecast, by Form, 2022–2031
9.4.4. Japan Specialty Carbon Black Market Volume (Kilo Tons) and Value (US$ Bn) Forecast, Application, 2022–2031
9.4.5. India Specialty Carbon Black Market Volume (Kilo Tons) and Value (US$ Bn) Forecast, by Form, 2022–2031
9.4.6. India Specialty Carbon Black Market Volume (Kilo Tons) and Value (US$ Bn) Forecast, Application, 2022–2031
9.4.7. ASEAN Specialty Carbon Black Market Volume (Kilo Tons) and Value (US$ Bn) Forecast, by Form, 2022–2031
9.4.8. ASEAN Specialty Carbon Black Market Volume (Kilo Tons) and Value (US$ Bn) Forecast, Application, 2022–2031
9.4.9. Rest of Asia Pacific Specialty Carbon Black Market Volume (Kilo Tons) and Value (US$ Bn) Forecast, by Form, 2022–2031
9.4.10. Rest of Asia Pacific Specialty Carbon Black Market Volume (Kilo Tons) and Value (US$ Bn) Forecast, Application, 2022–2031
9.5. Asia Pacific Specialty Carbon Black Market Attractiveness Analysis
10. Latin America Specialty Carbon Black Market Analysis and Forecast, 2022–2031
10.1. Key Findings
10.2. Latin America Specialty Carbon Black Market Volume (Kilo Tons) and Value (US$ Bn) Forecast, by Form, 2022–2031
10.3. Latin America Specialty Carbon Black Market Volume (Kilo Tons) and Value (US$ Bn) Forecast, by Application, 2022–2031
10.4. Latin America Specialty Carbon Black Market Volume (Kilo Tons) and Value (US$ Bn) Forecast, by Country and Sub-region, 2021-2031
10.4.1. Brazil Specialty Carbon Black Market Volume (Kilo Tons) and Value (US$ Bn) Forecast, by Form, 2022–2031
10.4.2. Brazil Specialty Carbon Black Market Volume (Kilo Tons) and Value (US$ Bn) Forecast, Application, 2022–2031
10.4.3. Mexico Specialty Carbon Black Market Volume (Kilo Tons) and Value (US$ Bn) Forecast, by Form, 2022–2031
10.4.4. Mexico Specialty Carbon Black Market Volume (Kilo Tons) and Value (US$ Bn) Forecast, Application, 2022–2031
10.4.5. Rest of Latin America Specialty Carbon Black Market Volume (Kilo Tons) and Value (US$ Bn) Forecast, by Form, 2022–2031
10.4.6. Rest of Latin America Specialty Carbon Black Market Volume (Kilo Tons) and Value (US$ Bn) Forecast, Application, 2022–2031
10.5. Latin America Specialty Carbon Black Market Attractiveness Analysis
11. Middle East & Africa Specialty Carbon Black Market Analysis and Forecast, 2022–2031
11.1. Key Findings
11.2. Middle East & Africa Specialty Carbon Black Market Volume (Kilo Tons) and Value (US$ Bn) Forecast, by Form, 2022–2031
11.3. Middle East & Africa Specialty Carbon Black Market Volume (Kilo Tons) and Value (US$ Bn) Forecast, by Application, 2022–2031
11.4. Middle East & Africa Specialty Carbon Black Market Volume (Kilo Tons) and Value (US$ Bn) Forecast, by Country and Sub-region, 2021-2031
11.4.1. GCC Specialty Carbon Black Market Volume (Kilo Tons) and Value (US$ Bn) Forecast, by Form, 2022–2031
11.4.2. GCC Specialty Carbon Black Market Volume (Kilo Tons) and Value (US$ Bn) Forecast, Application, 2022–2031
11.4.3. South Africa Specialty Carbon Black Market Volume (Kilo Tons) and Value (US$ Bn) Forecast, by Form, 2022–2031
11.4.4. South Africa Specialty Carbon Black Market Volume (Kilo Tons) and Value (US$ Bn) Forecast, Application, 2022–2031
11.4.5. Rest of Middle East & Africa Specialty Carbon Black Market Volume (Kilo Tons) and Value (US$ Bn) Forecast, by Form, 2022–2031
11.4.6. Rest of Middle East & Africa Specialty Carbon Black Market Volume (Kilo Tons) and Value (US$ Bn) Forecast, Application, 2022–2031
11.5. Middle East & Africa Specialty Carbon Black Market Attractiveness Analysis
12. Competition Landscape
12.1. Global Specialty Carbon Black Company Market Share Analysis, 2021
12.2. Company Profiles (Details – Overview, Financials, Recent Developments, and Strategy)
12.2.1. Cabot Corporation
12.2.1.1. Company Description
12.2.1.2. Business Overview
12.2.1.3. Financial Overview
12.2.1.4. Strategic Overview
12.2.2. Imerys S.A.
12.2.2.1. Company Description
12.2.2.2. Business Overview
12.2.2.3. Financial Overview
12.2.2.4. Strategic Overview
12.2.3. Mitsubishi Chemical Corporation
12.2.3.1. Company Description
12.2.3.2. Business Overview
12.2.3.3. Financial Overview
12.2.3.4. Strategic Overview
12.2.4. Denka Company Limited
12.2.4.1. Company Description
12.2.4.2. Business Overview
12.2.4.3. Financial Overview
12.2.4.4. Strategic Overview
12.2.5. Phillips Carbon Black Limited
12.2.5.1. Company Description
12.2.5.2. Business Overview
12.2.5.3. Financial Overview
12.2.5.4. Strategic Overview
12.2.6. Tokai Carbon Co., Ltd.
12.2.6.1. Company Description
12.2.6.2. Business Overview
12.2.6.3. Financial Overview
12.2.6.4. Strategic Overview
12.2.7. Lion Specialty Chemicals Co., Ltd.
12.2.7.1. Company Description
12.2.7.2. Business Overview
12.2.7.3. Financial Overview
12.2.7.4. Strategic Overview
12.2.8. Birla Carbon
12.2.8.1. Company Description
12.2.8.2. Business Overview
12.2.8.3. Financial Overview
12.2.8.4. Strategic Overview
12.2.9. Ampacet Corporation
12.2.9.1. Company Description
12.2.9.2. Business Overview
12.2.9.3. Financial Overview
12.2.9.4. Strategic Overview
12.2.10. Himadri Speciality Chemical Ltd.
12.2.10.1. Company Description
12.2.10.2. Business Overview
12.2.10.3. Financial Overview
12.2.10.4. Strategic Overview
12.2.11. Continental Carbon
12.2.11.1. Company Description
12.2.11.2. Business Overview
12.2.11.3. Financial Overview
12.2.11.4. Strategic Overview
12.2.12. Orion Engineered Carbons
12.2.12.1. Company Description
12.2.12.2. Business Overview
12.2.12.3. Financial Overview
12.2.12.4. Strategic Overview
12.2.13. Asbury Carbons
12.2.13.1. Company Description
12.2.13.2. Business Overview
12.2.13.3. Financial Overview
12.2.13.4. Strategic Overview
12.2.14. Pyrolex AG
12.2.14.1. Company Description
12.2.14.2. Business Overview
12.2.14.3. Financial Overview
12.2.14.4. Strategic Overview
12.2.15. Black Bear Carbon B.V.
12.2.15.1. Company Description
12.2.15.2. Business Overview
12.2.15.3. Financial Overview
12.2.15.4. Strategic Overview
13. Primary Research: Key Insights
14. Appendix
List of Tables
Table 1: Global Specialty Carbon Black Market Volume (Kilo Tons) Forecast, by Form, 2022–2031
Table 2: Global Specialty Carbon Black Market Value (US$ Bn) Forecast, by Form, 2022–2031
Table 3: Global Specialty Carbon Black Market Volume (Kilo Tons) Forecast, by Application, 2022–2031
Table 4: Global Specialty Carbon Black Market Value (US$ Bn) Forecast, by Application, 2022–2031
Table 5: Global Specialty Carbon Black Market Volume (Kilo Tons) Forecast, by Region, 2022–2031
Table 6: Global Specialty Carbon Black Market Value (US$ Bn) Forecast, by Region, 2022–2031
Table 7: North America Specialty Carbon Black Market Volume (Kilo Tons) Forecast, by Form, 2022–2031
Table 8: North America Specialty Carbon Black Market Value (US$ Bn) Forecast, by Form, 2022–2031
Table 9: North America Specialty Carbon Black Market Volume (Kilo Tons) Forecast, by Application, 2022–2031
Table 10: North America Specialty Carbon Black Market Value (US$ Bn) Forecast, by Application, 2022–2031
Table 11: North America Specialty Carbon Black Market Volume (Kilo Tons) Forecast, by Country, 2022–2031
Table 12: North America Specialty Carbon Black Market Value (US$ Bn) Forecast, by Country, 2022–2031
Table 13: U.S. Specialty Carbon Black Market Volume (Kilo Tons) Forecast, by Form, 2022–2031
Table 14: U.S. Specialty Carbon Black Market Value (US$ Bn) Forecast, by Form, 2022–2031
Table 15: U.S. Specialty Carbon Black Market Volume (Kilo Tons) Forecast, by Application, 2022–2031
Table 16: U.S. Specialty Carbon Black Market Value (US$ Bn) Forecast, by Application, 2022–2031
Table 17: Canada Specialty Carbon Black Market Volume (Kilo Tons) Forecast, by Form, 2022–2031
Table 18: Canada Specialty Carbon Black Market Value (US$ Bn) Forecast, by Form, 2022–2031
Table 19: Canada Specialty Carbon Black Market Volume (Kilo Tons) Forecast, by Application, 2022–2031
Table 20: Canada Specialty Carbon Black Market Value (US$ Bn) Forecast, by Application 2022–2031
Table 21: Europe Specialty Carbon Black Market Volume (Kilo Tons) Forecast, by Form, 2022–2031
Table 22: Europe Specialty Carbon Black Market Value (US$ Bn) Forecast, by Form, 2022–2031
Table 23: Europe Specialty Carbon Black Market Volume (Kilo Tons) Forecast, by Application, 2022–2031
Table 24: Europe Specialty Carbon Black Market Value (US$ Bn) Forecast, by Application 2022–2031
Table 25: Europe Specialty Carbon Black Market Volume (Kilo Tons) Forecast, by Country and Sub-region, 2022–2031
Table 26: Europe Specialty Carbon Black Market Value (US$ Bn) Forecast, by Country and Sub-region, 2022–2031
Table 27: Germany Specialty Carbon Black Market Volume (Kilo Tons) Forecast, by Form, 2022–2031
Table 28: Germany Specialty Carbon Black Market Value (US$ Bn) Forecast, by Form, 2022–2031
Table 29: Germany Specialty Carbon Black Market Volume (Kilo Tons) Forecast, by Application, 2022–2031
Table 30: Germany Specialty Carbon Black Market Value (US$ Bn) Forecast, by Application 2022–2031
Table 31: France Specialty Carbon Black Market Volume (Kilo Tons) Forecast, by Form, 2022–2031
Table 32: France Specialty Carbon Black Market Value (US$ Bn) Forecast, by Form, 2022–2031
Table 33: France Specialty Carbon Black Market Volume (Kilo Tons) Forecast, by Application, 2022–2031
Table 34: France Specialty Carbon Black Market Value (US$ Bn) Forecast, by Application 2022–2031
Table 35: U.K. Specialty Carbon Black Market Volume (Kilo Tons) Forecast, by Form, 2022–2031
Table 36: U.K. Specialty Carbon Black Market Value (US$ Bn) Forecast, by Form, 2022–2031
Table 37: U.K. Specialty Carbon Black Market Volume (Kilo Tons) Forecast, by Application, 2022–2031
Table 38: U.K. Specialty Carbon Black Market Value (US$ Bn) Forecast, by Application 2022–2031
Table 39: Italy Specialty Carbon Black Market Volume (Kilo Tons) Forecast, by Form, 2022–2031
Table 40: Italy Specialty Carbon Black Market Value (US$ Bn) Forecast, by Form, 2022–2031
Table 41: Italy Specialty Carbon Black Market Volume (Kilo Tons) Forecast, by Application, 2022–2031
Table 42: Italy Specialty Carbon Black Market Value (US$ Bn) Forecast, by Application 2022–2031
Table 43: Spain Specialty Carbon Black Market Volume (Kilo Tons) Forecast, by Form, 2022–2031
Table 44: Spain Specialty Carbon Black Market Value (US$ Bn) Forecast, by Form, 2022–2031
Table 45: Spain Specialty Carbon Black Market Volume (Kilo Tons) Forecast, by Application, 2022–2031
Table 46: Spain Specialty Carbon Black Market Value (US$ Bn) Forecast, by Application 2022–2031
Table 47: Russia & CIS Specialty Carbon Black Market Volume (Kilo Tons) Forecast, by Form, 2022–2031
Table 48: Russia & CIS Specialty Carbon Black Market Value (US$ Bn) Forecast, by Form, 2022–2031
Table 49: Russia & CIS Specialty Carbon Black Market Volume (Kilo Tons) Forecast, by Application, 2022–2031
Table 50: Russia & CIS Specialty Carbon Black Market Value (US$ Bn) Forecast, by Application 2022–2031
Table 51: Rest of Europe Specialty Carbon Black Market Volume (Kilo Tons) Forecast, by Form, 2022–2031
Table 52: Rest of Europe Specialty Carbon Black Market Value (US$ Bn) Forecast, by Form, 2022–2031
Table 53: Rest of Europe Specialty Carbon Black Market Volume (Kilo Tons) Forecast, by Application, 2022–2031
Table 54: Rest of Europe Specialty Carbon Black Market Value (US$ Bn) Forecast, by Application 2022–2031
Table 55: Asia Pacific Specialty Carbon Black Market Volume (Kilo Tons) Forecast, by Form, 2022–2031
Table 56: Asia Pacific Specialty Carbon Black Market Value (US$ Bn) Forecast, by Form, 2022–2031
Table 57: Asia Pacific Specialty Carbon Black Market Volume (Kilo Tons) Forecast, by Application, 2022–2031
Table 58: Asia Pacific Specialty Carbon Black Market Value (US$ Bn) Forecast, by Application 2022–2031
Table 59: Asia Pacific Specialty Carbon Black Market Volume (Kilo Tons) Forecast, by Country and Sub-region, 2022–2031
Table 60: Asia Pacific Specialty Carbon Black Market Value (US$ Bn) Forecast, by Country and Sub-region, 2022–2031
Table 61: China Specialty Carbon Black Market Volume (Kilo Tons) Forecast, by Form, 2022–2031
Table 62: China Specialty Carbon Black Market Value (US$ Bn) Forecast, by Form 2022–2031
Table 63: China Specialty Carbon Black Market Volume (Kilo Tons) Forecast, by Application, 2022–2031
Table 64: China Specialty Carbon Black Market Value (US$ Bn) Forecast, by Application 2022–2031
Table 65: Japan Specialty Carbon Black Market Volume (Kilo Tons) Forecast, by Form, 2022–2031
Table 66: Japan Specialty Carbon Black Market Value (US$ Bn) Forecast, by Form, 2022–2031
Table 67: Japan Specialty Carbon Black Market Volume (Kilo Tons) Forecast, by Application, 2022–2031
Table 68: Japan Specialty Carbon Black Market Value (US$ Bn) Forecast, by Application 2022–2031
Table 69: India Specialty Carbon Black Market Volume (Kilo Tons) Forecast, by Form, 2022–2031
Table 70: India Specialty Carbon Black Market Value (US$ Bn) Forecast, by Form, 2022–2031
Table 71: India Specialty Carbon Black Market Volume (Kilo Tons) Forecast, by Application, 2022–2031
Table 72: India Specialty Carbon Black Market Value (US$ Bn) Forecast, by Application 2022–2031
Table 73: ASEAN Specialty Carbon Black Market Volume (Kilo Tons) Forecast, by Form, 2022–2031
Table 74: ASEAN Specialty Carbon Black Market Value (US$ Bn) Forecast, by Form, 2022–2031
Table 75: ASEAN Specialty Carbon Black Market Volume (Kilo Tons) Forecast, by Application, 2022–2031
Table 76: ASEAN Specialty Carbon Black Market Value (US$ Bn) Forecast, by Application 2022–2031
Table 77: Rest of Asia Pacific Specialty Carbon Black Market Volume (Kilo Tons) Forecast, by Form, 2022–2031
Table 78: Rest of Asia Pacific Specialty Carbon Black Market Value (US$ Bn) Forecast, by Form, 2022–2031
Table 79: Rest of Asia Pacific Specialty Carbon Black Market Volume (Kilo Tons) Forecast, by Application, 2022–2031
Table 80: Rest of Asia Pacific Specialty Carbon Black Market Value (US$ Bn) Forecast, by Application 2022–2031
Table 81: Latin America Specialty Carbon Black Market Volume (Kilo Tons) Forecast, by Form, 2022–2031
Table 82: Latin America Specialty Carbon Black Market Value (US$ Bn) Forecast, by Form, 2022–2031
Table 83: Latin America Specialty Carbon Black Market Volume (Kilo Tons) Forecast, by Application, 2022–2031
Table 84: Latin America Specialty Carbon Black Market Value (US$ Bn) Forecast, by Application 2022–2031
Table 85: Latin America Specialty Carbon Black Market Volume (Kilo Tons) Forecast, by Country and Sub-region, 2022–2031
Table 86: Latin America Specialty Carbon Black Market Value (US$ Bn) Forecast, by Country and Sub-region, 2022–2031
Table 87: Brazil Specialty Carbon Black Market Volume (Kilo Tons) Forecast, by Form, 2022–2031
Table 88: Brazil Specialty Carbon Black Market Value (US$ Bn) Forecast, by Form, 2022–2031
Table 89: Brazil Specialty Carbon Black Market Volume (Kilo Tons) Forecast, by Application, 2022–2031
Table 90: Brazil Specialty Carbon Black Market Value (US$ Bn) Forecast, by Application 2022–2031
Table 91: Mexico Specialty Carbon Black Market Volume (Kilo Tons) Forecast, by Form, 2022–2031
Table 92: Mexico Specialty Carbon Black Market Value (US$ Bn) Forecast, by Form, 2022–2031
Table 93: Mexico Specialty Carbon Black Market Volume (Kilo Tons) Forecast, by Application, 2022–2031
Table 94: Mexico Specialty Carbon Black Market Value (US$ Bn) Forecast, by Application 2022–2031
Table 95: Rest of Latin America Specialty Carbon Black Market Volume (Kilo Tons) Forecast, by Form, 2022–2031
Table 96: Rest of Latin America Specialty Carbon Black Market Value (US$ Bn) Forecast, by Form, 2022–2031
Table 97: Rest of Latin America Specialty Carbon Black Market Volume (Kilo Tons) Forecast, by Application, 2022–2031
Table 98: Rest of Latin America Specialty Carbon Black Market Value (US$ Bn) Forecast, by Application 2022–2031
Table 99: Middle East & Africa Specialty Carbon Black Market Volume (Kilo Tons) Forecast, by Form, 2022–2031
Table 100: Middle East & Africa Specialty Carbon Black Market Value (US$ Bn) Forecast, by Form, 2022–2031
Table 101: Middle East & Africa Specialty Carbon Black Market Volume (Kilo Tons) Forecast, by Application, 2022–2031
Table 102: Middle East & Africa Specialty Carbon Black Market Value (US$ Bn) Forecast, by Application 2022–2031
Table 103: Middle East & Africa Specialty Carbon Black Market Volume (Kilo Tons) Forecast, by Country and Sub-region, 2022–2031
Table 104: Middle East & Africa Specialty Carbon Black Market Value (US$ Bn) Forecast, by Country and Sub-region, 2022–2031
Table 105: GCC Specialty Carbon Black Market Volume (Kilo Tons) Forecast, by Form, 2022–2031
Table 106: GCC Specialty Carbon Black Market Value (US$ Bn) Forecast, by Form, 2022–2031
Table 107: GCC Specialty Carbon Black Market Volume (Kilo Tons) Forecast, by Application, 2022–2031
Table 108: GCC Specialty Carbon Black Market Value (US$ Bn) Forecast, by Application 2022–2031
Table 109: South Africa Specialty Carbon Black Market Volume (Kilo Tons) Forecast, by Form, 2022–2031
Table 110: South Africa Specialty Carbon Black Market Value (US$ Bn) Forecast, by Form, 2022–2031
Table 111: South Africa Specialty Carbon Black Market Volume (Kilo Tons) Forecast, by Application, 2022–2031
Table 112: South Africa Specialty Carbon Black Market Value (US$ Bn) Forecast, by Application 2022–2031
Table 113: Rest of Middle East & Africa Specialty Carbon Black Market Volume (Kilo Tons) Forecast, by Form, 2022–2031
Table 114: Rest of Middle East & Africa Specialty Carbon Black Market Value (US$ Bn) Forecast, by Form, 2022–2031
Table 115: Rest of Middle East & Africa Specialty Carbon Black Market Volume (Kilo Tons) Forecast, by Application, 2022–2031
Table 116: Rest of Middle East & Africa Specialty Carbon Black Market Value (US$ Bn) Forecast, by Application 2022–2031
List of Figures
Figure 1: Global Specialty Carbon Black Market Volume Share Analysis, by Form, 2021, 2025, and 2031
Figure 2: Global Specialty Carbon Black Market Attractiveness, by Form
Figure 3: Global Specialty Carbon Black Market Volume Share Analysis, by Application, 2021, 2025, and 2031
Figure 4: Global Specialty Carbon Black Market Attractiveness, by Application
Figure 5: Global Specialty Carbon Black Market Volume Share Analysis, by Region, 2021, 2025, and 2031
Figure 6: Global Specialty Carbon Black Market Attractiveness, by Region
Figure 7: North America Specialty Carbon Black Market Volume Share Analysis, by Form, 2021, 2025, and 2031
Figure 8: North America Specialty Carbon Black Market Attractiveness, by Form
Figure 9: North America Specialty Carbon Black Market Attractiveness, by Form
Figure 10: North America Specialty Carbon Black Market Volume Share Analysis, by Application, 2021, 2025, and 2031
Figure 11: North America Specialty Carbon Black Market Attractiveness, by Application
Figure 12: North America Specialty Carbon Black Market Attractiveness, by Country and Sub-region
Figure 13: Europe Specialty Carbon Black Market Volume Share Analysis, by Form, 2021, 2025, and 2031
Figure 14: Europe Specialty Carbon Black Market Attractiveness, by Form
Figure 15: Europe Specialty Carbon Black Market Volume Share Analysis, by Application, 2021, 2025, and 2031
Figure 16: Europe Specialty Carbon Black Market Attractiveness, by Application
Figure 17: Europe Specialty Carbon Black Market Volume Share Analysis, by Country and Sub-region, 2021, 2025, and 2031
Figure 18: Europe Specialty Carbon Black Market Attractiveness, by Country and Sub-region
Figure 19: Asia Pacific Specialty Carbon Black Market Volume Share Analysis, by Form, 2021, 2025, and 2031
Figure 20: Asia Pacific Specialty Carbon Black Market Attractiveness, by Form
Figure 21: Asia Pacific Specialty Carbon Black Market Volume Share Analysis, by Application, 2021, 2025, and 2031
Figure 22: Asia Pacific Specialty Carbon Black Market Attractiveness, by Application
Figure 23: Asia Pacific Specialty Carbon Black Market Volume Share Analysis, by Country and Sub-region, 2021, 2025, and 2031
Figure 24: Asia Pacific Specialty Carbon Black Market Attractiveness, by Country and Sub-region
Figure 25: Latin America Specialty Carbon Black Market Volume Share Analysis, by Form, 2021, 2025, and 2031
Figure 26: Latin America Specialty Carbon Black Market Attractiveness, by Form
Figure 27: Latin America Specialty Carbon Black Market Volume Share Analysis, by Application, 2021, 2025, and 2031
Figure 28: Latin America Specialty Carbon Black Market Attractiveness, by Application
Figure 29: Latin America Specialty Carbon Black Market Volume Share Analysis, by Country and Sub-region, 2021, 2025, and 2031
Figure 30: Latin America Specialty Carbon Black Market Attractiveness, by Country and Sub-region
Figure 31: Middle East & Africa Specialty Carbon Black Market Volume Share Analysis, by Form, 2021, 2025, and 2031
Figure 32: Middle East & Africa Specialty Carbon Black Market Attractiveness, by Form
Figure 33: Middle East & Africa Specialty Carbon Black Market Volume Share Analysis, by Application, 2021, 2025, and 2031
Figure 34: Middle East & Africa Specialty Carbon Black Market Attractiveness, by Application
Figure 35: Middle East & Africa Specialty Carbon Black Market Volume Share Analysis, by Country and Sub-region, 2021, 2025, and 2031
Figure 36: Middle East & Africa Specialty Carbon Black Market Attractiveness, by Country and Sub-region
Copyright © Transparency Market Research, Inc. All Rights reserved
Trust Online

Specialty Carbon Black Market