
Reports
Reports
Smart Wearables Market - Snapshot
Wearable technology refers to those portable smart gadgets that can be around a body. Wearables comprise gadgets like smart jewelry like Ringly, smart glasses like Google glass, and smart watches. Smart electronic devices comprise fashion electronics, tech togs, smart wearable technologies, and many other such gadgets that can be worn as clothing or as accessories or implants. The global smart wearables market is likely to witness immense growth over the tenure of assessment due to growing popularity of these gadgets.
Technological Advancement to Shoot up Demand in the Near Future
Advancements in research and development work have led to the augmented innovation in the last few years. It has triggered developments in the global smart wearables market. Research and development activities has led to the advent of new categories of product such as hearables, smart fabrics and others that integrate advanced design and technology in the daily lives of people. Of late, there has been an emphasis on offering aesthetic designs to draw the attention of customers.
Smart wearables could also include things like wristbands introduced by companies like Apple Inc., Fitbit, and Jawbone. These wristbands also act as activity trackers and have gained immense popularity, mostly amongst the younger generation. Such popularity of these products is mostly due to the increased awareness about fitness and health. Smart wearable come in the following forms
Of all of these products, smartwatches are witnessing a spiral growth in its demand due to various additional features and these watches are becoming more of an everyday wear. Prominent brands like Fossil and Apple have kept the pricing consistent and in line with the traditional watches in a bid to maintain their revenue. With the advent of Google WearOS, many of the luxury premium makers of watches, such as Armani and TAG Heuer, are also entering the market. This factor is likely to encourage growth of the global smart wearables market in the years to come.
Adoption of Wearable Tech to Extend from Consumer Sector to Other Industries
Advancements in technology have driven innovations in the consumer electronics sector and as per the current observable trends, smart wearables are expected to disrupt consumer trends in the near future. While consumer demand for smart wearables is anticipated to scale new heights, the adoption of the wearable technology across a range of industries is expected to witness considerable growth. Cost reduction, modernization of business operations, real-time monitoring, efficient inspection of industrial equipment, and improving workforce safety are some of the key areas in which deployment of smart wearables is likely to take place.
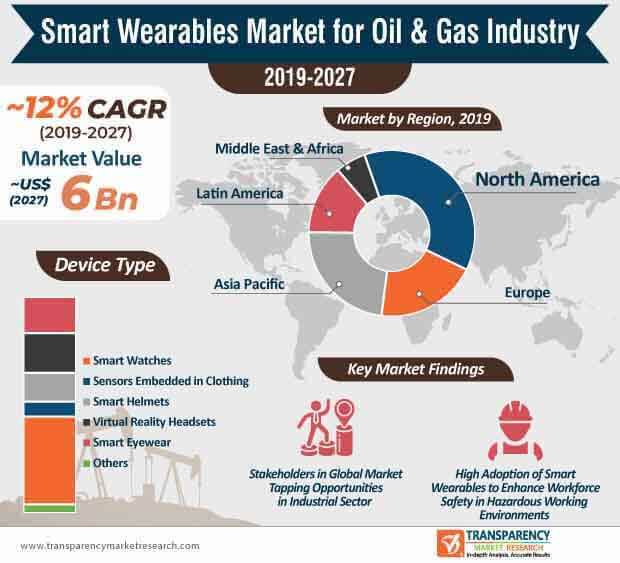
In the current scenario, oil & gas companies are increasingly evaluating the potential of smart wearables to improve efficiency and safety, particularly in the downstream applications in the oil & gas sector. The smart wearables market for oil & gas industry is slated to grow at a significant rate during the forecast period (2019-2027). Moreover, the onset of novel technologies, such as Artificial Intelligence (AI) and augmented reality (AR), is expected to create substantial demand for smart wearables for the oil & gas industry in the coming years. Thus, advancements in the wearable technology coupled with growing awareness pertaining to potential benefits and applications of smart wearables in the oil & gas industry are expected to drive the smart wearables market for oil & gas industry. The market is expected to reach ~US$ 6 Bn by the end of 2027.
Smart Wearables Market for Oil & Gas Industry Shifting toward Enhanced Worker Safety
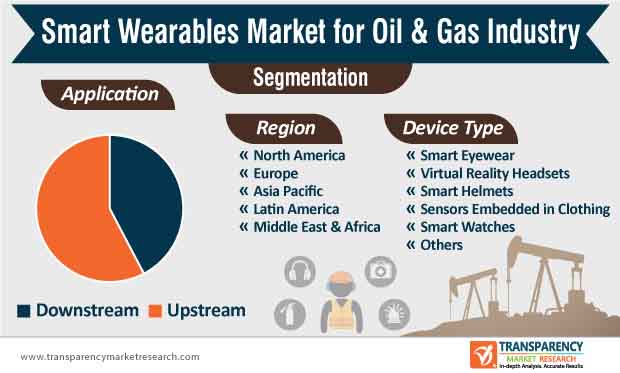
The demand for smart wearables in the oil & gas sector is growing at a considerable pace. Witnessing the growing influence of smart wearables on the industrial sector, companies involved in the smart wearables market for oil & gas industry are investing resources in the development of innovative wearable devices such as smart eyewear, smart helmets, smartwatches, virtual reality headsets, etc. Despite the growing impact of digitalization on the oil & gas sector, human workers are an integral part of the value chain. One of the major factors that is projected to boost the adoption of smart wearables in the oil & gas industry is the role of wearable technology in enhancing efficiency, productivity, and workforce safety.
Apart from providing an impetus for productivity, wearable devices will play a pivotal role in streamlining the delivery of documents and data in real-time. With rapid advancements in technology, a wide range of smart wearables is available for applications in the oil & gas sector. Based on device type, the smartwatch device type segment is estimated to generate high revenues and account for ~ 41% share of the smart wearables market for oil & gas industry.
Advancements in Internet of Things (IoT) to Augment Demand
While oil and gas companies continue to focus on the adoption of digital technologies, developments in the Internet of Things (IoT) space have come at the right time. The gradual penetration of IoT in the oil & gas sector is expected to boost the growth of the smart wearables market for oil & gas industry during the assessment period. By leveraging IoT, oil and gas companies are expected to lean toward automating and optimizing various processes that were time-consuming. With growing emphasis on workforce safety across the oil & gas sector, companies are required to comply with stringent regulations and regulatory norms. The deployment of IoT will play a critical role in improving the safety of personnel working in hostile environments. Connected sensors, remote sensors, and drones connected to smart wearables will soon gain significant popularity in the smart wearables market for oil & gas industry.
While improving workforce safety will remain a key area of interest, asset monitoring, asset management, and tracking, and predicting maintenance cycles of equipment are some of the other areas where smart wearables could make a significant impact in the oil & gas sector.
Analysts’ Viewpoint
The smart wearables market for oil & gas industry is expected to expand at a high CAGR of ~12% during the forecast period. The growth of the market can be primarily attributed to the rising influence of novel technologies such as artificial intelligence and progress in the Internet of Things (IoT). Moreover, due to stringent regulations and norms pertaining to workforce safety across the oil & gas sector, the adoption of smart wearables to improve personnel safety will continue to garner significant momentum during the forecast period. As a result, the adoption of smart wearables in upstream applications will remain higher than downstream applications during the forecast period.
Smart Wearables Market for Oil & Gas Industry: Overview
Stringent Government Rules and Regulations about Health and Safety to Drive Global Market
Rising Concerns about Data Security and Data Privacy to Hamper Smart Wearables Market for Oil & Gas Industry
Rise in Automation to Offer Opportunities in Smart Wearables Market for Oil & Gas Industry
Recent Developments, Expansions, Acquisitions, and New Contracts
North America to Lead Smart Wearables Market for Oil & Gas Industry
Highly Competitive Smart Wearables Market for Oil & Gas Industry
Smart Wearables Market is projected to reach US$ 6 Bn by the end of 2027
Smart Wearables Market is expected to grow at a CAGR of 12% during 2019 - 2027
Advancements in the wearable technology coupled with growing awareness pertaining to potential benefits and applications of smart wearables in the oil & gas industry are expected to drive the smart wearables market for oil & gas industry
North America is a more attractive region for vendors in the Smart Wearables Market
Key vendors in the Smart Wearables Market are TOSHIBA CORPORATION, 3M, Alphabet Inc., Apple Inc., SAMSUNG ELECTRONICS CO., LTD, and FUJITSU, etc
1. Preface
1.1. Report Scope and Market Segmentation
1.2. Research Highlights
2. Assumptions and Research Methodology
2.1. Report Assumptions
2.2. Secondary Sources and Acronyms Used
2.3. Research Methodology
3. Executive Summary
3.1. Market Snapshot
3.2. Top Trends
4. Market Overview
4.1. Introduction
4.2. Market Indicators
4.3. Drivers and Restraints Snapshot Analysis
4.3.1. Drivers
4.3.2. Restraints
4.3.3. Opportunities
4.4. Porter's Five Forces Analysis
4.4.1. Threat of Substitutes
4.4.2. Bargaining Power of Buyers
4.4.3. Bargaining Power of Suppliers
4.4.4. Threat of New Entrants
4.4.5. Degree of Competition
4.5. Value Chain Analysis
4.5.1. List of Key Customers
4.6. Regulatory Scenario
5. Global Smart Wearables Market for Oil & Gas Industry Value (US$ Mn) Analysis, by Device Type
5.1. Key Findings and Introduction
5.2. Global Smart Wearables Market for Oil & Gas Industry Value (US$ Mn) Forecast, by Device Type, 2018–2027
5.2.1. Global Smart Wearables Market for Oil & Gas Industry Value (US$ Mn) Forecast, by Smart Eyewear, 2018–2027
5.2.2. Global Smart Wearables Market for Oil & Gas Industry Value (US$ Mn) Forecast, by Virtual Reality Headsets, 2018–2027
5.2.3. Global Smart Wearables Market for Oil & Gas Industry Value (US$ Mn) Forecast, by Smart Helmets, 2018–2027
5.2.4. Global Smart Wearables Market for Oil & Gas Industry Value (US$ Mn) Forecast, by Sensors Embedded in Clothing, 2018–2027
5.2.5. Global Smart Wearables Market for Oil & Gas Industry Value (US$ Mn) Forecast, by Smart Watches, 2018–2027
5.2.6. Global Smart Wearables Market for Oil & Gas Industry Value (US$ Mn) Forecast, by Others, 2018–2027
5.3. Global Smart Wearables Market for Oil & Gas Industry Attractiveness Analysis, by Device Type
6. Global Smart Wearables Market for Oil & Gas Industry Analysis, by Application
6.1. Key Findings and Introduction
6.2. Global Smart Wearables Market for Oil & Gas Industry Value (US$ Mn) Analysis & Forecast, by Application, 2018–2027
6.2.1. Global Smart Wearables Market for Oil & Gas Industry Value (US$ Mn) Forecast, by Downstream, 2018–2027
6.2.2. Global Smart Wearables Market for Oil & Gas Industry Value (US$ Mn) Forecast, by Upstream, 2018–2027
6.3. Global Smart Wearables Market for Oil & Gas Industry Attractiveness Analysis, by Application
7. Global Smart Wearables Market for Oil & Gas Industry Analysis, by Region, 2018–2027
7.1. Key Findings
7.2. Global Smart Wearables Market for Oil & Gas Industry Value (US$ Mn) Analysis & Forecast, by Region, 2018–2027
7.2.1. North America
7.2.2. Europe
7.2.3. Asia Pacific
7.2.4. Latin America
7.2.5. Middle East & Africa
7.3. Global Smart Wearables Market for Oil & Gas Industry Attractiveness Analysis, by Region
8. North America Smart Wearables Market for Oil & Gas Industry Analysis, 2018–2027
8.1. Key Findings
8.2. North America Smart Wearables Market for Oil & Gas Industry Value (US$ Mn) Analysis & Forecast, by Device Type, 2018–2027
8.3. North America Smart Wearables Market for Oil & Gas Industry Value (US$ Mn) Analysis & Forecast, by Application, 2018–2027
8.4. North America Smart Wearables Market for Oil & Gas Industry Value (US$ Mn) Analysis & Forecast, by Country, 2018–2027
8.4.1. U.S. Smart Wearables Market for Oil & Gas Industry Value (US$ Mn) Forecast, by Device Type, 2018–2027
8.4.2. U.S. Smart Wearables Market for Oil & Gas Industry Value (US$ Mn) Forecast, by Application, 2018–2027
8.4.3. Canada Smart Wearables Market for Oil & Gas Industry Value (US$ Mn) Forecast, by Device Type, 2018–2027
8.4.4. Canada Smart Wearables Market for Oil & Gas Industry Value (US$ Mn) Forecast, by Application, 2018–2027
8.5. North America Smart Wearables Market for Oil & Gas Industry Attractiveness Analysis, by Device Type
8.6. North America Smart Wearables Market for Oil & Gas Industry Attractiveness Analysis, by Application
8.7. North America Smart Wearables Market for Oil & Gas Industry Attractiveness Analysis, by Country
9. Europe Smart Wearables Market for Oil & Gas Industry Analysis, 2018–2027
9.1. Key Findings
9.2. Europe Smart Wearables Market for Oil & Gas Industry Value (US$ Mn) Analysis & Forecast, by Device Type, 2018–2027
9.3. Europe Smart Wearables Market for Oil & Gas Industry Value (US$ Mn) Analysis & Forecast, by Application, 2018–2027
9.4. Europe Smart Wearables Market for Oil & Gas Industry Value (US$ Mn) Analysis & Forecast, by Country and Sub-region, 2018–2027
9.4.1. U.K. Smart Wearables Market for Oil & Gas Industry Value (US$ Mn) Forecast, by Device Type, 2018–2027
9.4.2. U.K. Smart Wearables Market for Oil & Gas Industry Value (US$ Mn) Forecast, by Application, 2018–2027
9.4.3. Norway Smart Wearables Market for Oil & Gas Industry Value (US$ Mn) Forecast, by Device Type, 2018–2027
9.4.4. Norway Smart Wearables Market for Oil & Gas Industry Value (US$ Mn) Forecast, by Application, 2018–2027
9.4.5. Russia & CIS Smart Wearables Market for Oil & Gas Industry Value (US$ Mn) Forecast, by Device Type, 2018–2027
9.4.6. Russia & CIS Smart Wearables Market for Oil & Gas Industry Value (US$ Mn) Forecast, by Application, 2018–2027
9.4.7. Rest of Europe Smart Wearables Market for Oil & Gas Industry Value (US$ Mn) Forecast, by Device Type, 2018–2027
9.4.8. Rest of Europe Smart Wearables Market for Oil & Gas Industry Value (US$ Mn) Forecast, by Application, 2018–2027
9.5. Europe Smart Wearables Market for Oil & Gas Industry Attractiveness Analysis, by Device Type
9.6. Europe Smart Wearables Market for Oil & Gas Industry Attractiveness Analysis, by Application
9.7. Europe Smart Wearables Market for Oil & Gas Industry Attractiveness Analysis, by Country and Sub-region
10. Asia Pacific Smart Wearables Market for Oil & Gas Industry Analysis, 2018–2027
10.1. Key Findings
10.2. Asia Pacific Smart Wearables Market for Oil & Gas Industry Value (US$ Mn) Analysis & Forecast, by Device Type, 2018–2027
10.3. Asia Pacific Smart Wearables Market for Oil & Gas Industry Value (US$ Mn) Analysis & Forecast, by Application, 2018–2027
10.4. Asia Pacific Smart Wearables Market for Oil & Gas Industry Value (US$ Mn) Analysis & Forecast, by Country and Sub-region, 2018–2027
10.4.1. China Smart Wearables Market for Oil & Gas Industry Value (US$ Mn) Forecast, by Device Type, 2018–2027
10.4.2. China Smart Wearables Market for Oil & Gas Industry Value (US$ Mn) Forecast, by Application, 2018–2027
10.4.3. Australia Smart Wearables Market for Oil & Gas Industry Value (US$ Mn) Forecast, by Device Type, 2018–2027
10.4.4. Australia Smart Wearables Market for Oil & Gas Industry Value (US$ Mn) Forecast, by Application, 2018–2027
10.4.5. India Smart Wearables Market for Oil & Gas Industry Value (US$ Mn) Forecast, by Device Type, 2018–2027
10.4.6. India Smart Wearables Market for Oil & Gas Industry Value (US$ Mn) Forecast, by Application, 2018–2027
10.4.7. ASEAN Smart Wearables Market for Oil & Gas Industry Value (US$ Mn) Forecast, by Device Type, 2018–2027
10.4.8. ASEAN Smart Wearables Market for Oil & Gas Industry Value (US$ Mn) Forecast, by Application, 2018–2027
10.4.9. Rest of Asia Pacific Smart Wearables Market for Oil & Gas Industry Value (US$ Mn) Forecast, by Device Type, 2018–2027
10.4.10. Rest of Asia Pacific Smart Wearables Market for Oil & Gas Industry Value (US$ Mn) Forecast, by Application, 2018–2027
10.5. Asia Pacific Smart Wearables Market for Oil & Gas Industry Attractiveness Analysis, by Device Type
10.6. Asia Pacific Smart Wearables Market for Oil & Gas Industry Attractiveness Analysis, by Application
10.7. Asia Pacific Smart Wearables Market for Oil & Gas Industry Attractiveness Analysis, by Country and Sub-region
11. Latin America Smart Wearables Market for Oil & Gas Industry Analysis, 2018–2027
11.1. Key Findings
11.2. Latin America Smart Wearables Market for Oil & Gas Industry Value (US$ Mn) Analysis & Forecast, by Device Type, 2018–2027
11.3. Latin America Smart Wearables Market for Oil & Gas Industry Value (US$ Mn) Analysis & Forecast, by Application, 2018–2027
11.4. Latin America Smart Wearables Market for Oil & Gas Industry Value (US$ Mn) Analysis & Forecast, by Country and Sub-region, 2018–2027
11.4.1. Brazil Smart Wearables Market for Oil & Gas Industry Value (US$ Mn) Forecast, by Device Type, 2018–2027
11.4.2. Brazil Smart Wearables Market for Oil & Gas Industry Value (US$ Mn) Forecast, by Application, 2018–2027
11.4.3. Mexico Smart Wearables Market for Oil & Gas Industry Value (US$ Mn) Forecast, by Device Type, 2018–2027
11.4.4. Mexico Smart Wearables Market for Oil & Gas Industry Value (US$ Mn) Forecast, by Application, 2018–2027
11.4.5. Venezuela Smart Wearables Market for Oil & Gas Industry Value (US$ Mn) Forecast, by Device Type, 2018–2027
11.4.6. Venezuela Smart Wearables Market for Oil & Gas Industry Value (US$ Mn) Forecast, by Application, 2018–2027
11.4.7. Rest of Latin America Smart Wearables Market for Oil & Gas Industry Value (US$ Mn) Forecast, by Device Type, 2018–2027
11.4.8. Rest of Latin America Smart Wearables Market for Oil & Gas Industry Value (US$ Mn) Forecast, by Application, 2018–2027
11.5. Latin America Smart Wearables Market for Oil & Gas Industry Attractiveness Analysis, by Device Type
11.6. Latin America Smart Wearables Market for Oil & Gas Industry Attractiveness Analysis, by Application
11.7. Latin America Smart Wearables Market for Oil & Gas Industry Attractiveness Analysis, by Country and Sub-region
12. Middle East & Africa Smart Wearables Market for Oil & Gas Industry Analysis, 2018–2027
12.1. Key Findings
12.2. Middle East & Africa Smart Wearables Market for Oil & Gas Industry Value (US$ Mn) Analysis & Forecast, by Device Type, 2018–2027
12.3. Middle East & Africa Smart Wearables Market for Oil & Gas Industry Value (US$ Mn) Analysis & Forecast, by Application, 2018–2027
12.4. Middle East & Africa Smart Wearables Market for Oil & Gas Industry Value (US$ Mn) Analysis & Forecast, by Country and Sub-region, 2018–2027
12.4.1. Saudi Arabia Smart Wearables Market for Oil & Gas Industry Value (US$ Mn) Forecast, by Device Type, 2018–2027
12.4.2. Saudi Arabia Smart Wearables Market for Oil & Gas Industry Value (US$ Mn) Forecast, by Application, 2018–2027
12.4.3. UAE Smart Wearables Market for Oil & Gas Industry Value (US$ Mn) Forecast, by Device Type, 2018–2027
12.4.4. UAE Smart Wearables Market for Oil & Gas Industry Value (US$ Mn) Forecast, by Application, 2018–2027
12.4.5. Qatar Smart Wearables Market for Oil & Gas Industry Value (US$ Mn) Forecast, by Device Type, 2018–2027
12.4.6. Qatar Smart Wearables Market for Oil & Gas Industry Value (US$ Mn) Forecast, by Application, 2018–2027
12.4.7. Nigeria Smart Wearables Market for Oil & Gas Industry Value (US$ Mn) Forecast, by Device Type, 2018–2027
12.4.8. Nigeria Smart Wearables Market for Oil & Gas Industry Value (US$ Mn) Forecast, by Application, 2018–2027
12.4.9. Rest of Middle East & Africa Smart Wearables Market for Oil & Gas Industry Value (US$ Mn) Forecast, by Device Type, 2018–2027
12.4.10. Rest of Middle East & Africa Smart Wearables Market for Oil & Gas Industry Value (US$ Mn) Forecast, by Application, 2018–2027
12.5. Middle East & Africa Smart Wearables Market for Oil & Gas Industry Attractiveness Analysis, by Device Type
12.6. Middle East & Africa Smart Wearables Market for Oil & Gas Industry Attractiveness Analysis, by Application
12.7. Middle East & Africa Smart Wearables Market for Oil & Gas Industry Attractiveness Analysis, by Country and Sub-region
13. Competition Landscape
13.1. Global Smart Wearables Market for Oil & Gas Industry Share Analysis, by Company (2018)
13.2. Competition Matrix
13.3. Company Profiles
13.3.1. Honeywell International Inc.
13.3.1.1. Company Details
13.3.1.2. Company Description
13.3.1.3. Business Overview
13.3.1.4. Financial Overview
13.3.1.5. Strategic Overview
13.3.2. TOSHIBA CORPORATION
13.3.2.1. Company Details
13.3.2.2. Company Description
13.3.2.3. Business Overview
13.3.2.4. Financial Overview
13.3.2.5. Strategic Overview
13.3.3. 3M
13.3.3.1. Company Details
13.3.3.2. Company Description
13.3.3.3. Business Overview
13.3.3.4. Financial Overview
13.3.4. ANSELL LTD
13.3.4.1. Company Details
13.3.4.2. Company Description
13.3.4.3. Business Overview
13.3.4.4. Financial Overview
13.3.4.5. Strategic Overview
13.3.5. Intellinium
13.3.5.1. Company Details
13.3.5.2. Company Description
13.3.5.3. Business Overview
13.3.6. Alphabet Inc.
13.3.6.1. Company Details
13.3.6.2. Company Description
13.3.6.3. Business Overview
13.3.6.4. Financial Overview
13.3.6.5. Strategic Overview
13.3.7. Apple Inc.
13.3.7.1. Company Details
13.3.7.2. Company Description
13.3.7.3. Business Overview
13.3.7.4. Financial Overview
13.3.7.5. Strategic Overview
13.3.8. SAMSUNG ELECTRONICS CO., LTD.
13.3.8.1. Company Details
13.3.8.2. Company Description
13.3.8.3. Business Overview
13.3.8.4. Financial Overview
13.3.8.5. Strategic Overview
13.3.9. Wearable Technologies Limited
13.3.9.1. Company Details
13.3.9.2. Company Description
13.3.9.3. Business Overview
13.3.10. Fischer Connectors
13.3.10.1. Company Details
13.3.10.2. Company Description
13.3.10.3. Business Overview
13.3.11. FUJITSU
13.3.11.1. Company Details
13.3.11.2. Company Description
13.3.11.3. Business Overview
13.3.11.4. Financial Overview
13.3.12. VUZIX
13.3.12.1. Company Details
13.3.12.2. Company Description
14. Primary Research – Key Insights
List of Tables
Table 01: Global Smart Wearables Market for Oil & Gas Industry Market Value (US$ Mn) Forecast, by Device Type, 2018–2027
Table 02: Global Smart Wearables Market for Oil & Gas Industry Market Value (US$ Mn) Forecast, by Application, 2018–2027
Table 03: Global Smart Wearables Market for Oil & Gas Industry Market Value (US$ Mn) Forecast, by Region, 2018–2027
Table 04: North America Smart Wearables Market for Oil & Gas Industry Market Value (US$ Mn) Forecast, by Device Type, 2018–2027
Table 05: North America Smart Wearables Market for Oil & Gas Industry Market Value (US$ Mn) Forecast, by Application, 2018–2027
Table 06: North America Smart Wearables Market for Oil & Gas Industry Market Value (US$ Mn) Forecast, by Country, 2018–2027
Table 07: U.S. Smart Wearables Market for Oil & Gas Industry Market Value (US$ Mn) Forecast, by Device Type, 2018–2027
Table 08: U.S. Smart Wearables Market for Oil & Gas Industry Market Value (US$ Mn) Forecast, by Application, 2018–2027
Table 09: Canada Smart Wearables Market for Oil & Gas Industry Market Value (US$ Mn) Forecast, by Device Type, 2018–2027
Table 10: Canada Smart Wearables Market for Oil & Gas Industry Market Value (US$ Mn) Forecast, by Application, 2018–2027
Table 11: Europe Smart Wearables Market for Oil & Gas Industry Market Value (US$ Mn) Forecast, by Device Type, 2018–2027
Table 12: Europe Smart Wearables Market for Oil & Gas Industry Market Value (US$ Mn) Forecast, by Application, 2018–2027
Table 13: Europe Smart Wearables Market for Oil & Gas Industry Market Value (US$ Mn) Forecast, by Country and Sub-region, 2018–2027
Table 14: Norway Smart Wearables Market for Oil & Gas Industry Market Value (US$ Mn) Forecast, by Device Type, 2018–2027
Table 15: Norway Smart Wearables Market for Oil & Gas Industry Market Value (US$ Mn) Forecast, by Application, 2018–2027
Table 16: U.K. Smart Wearables Market for Oil & Gas Industry Market Value (US$ Mn) Forecast, by Device Type, 2018–2027
Table 17: U.K. Smart Wearables Market for Oil & Gas Industry Market Value (US$ Mn) Forecast, by Application, 2018–2027
Table 18: Russia & CIS Smart Wearables Market for Oil & Gas Industry Market Value (US$ Mn) Forecast, by Device Type, 2018–2027
Table 19: Russia & CIS Smart Wearables Market for Oil & Gas Industry Market Value (US$ Mn) Forecast, by Application, 2018–2027
Table 20: Rest of Europe Smart Wearables Market for Oil & Gas Industry Market Value (US$ Mn) Forecast, by Device Type, 2018–2027
Table 21: Rest of Europe Smart Wearables Market for Oil & Gas Industry Market Value (US$ Mn) Forecast, by Application, 2018–2027
Table 22: Asia Pacific Smart Wearables Market for Oil & Gas Industry Market Value (US$ Mn) Forecast, by Device Type, 2018–2027
Table 23: Asia Pacific Smart Wearables Market for Oil & Gas Industry Market Value (US$ Mn) Forecast, by Application, 2018–2027
Table 24: Asia Pacific Smart Wearables Market for Oil & Gas Industry Market Value (US$ Mn) Forecast, by Country and Sub-region, 2018–2027
Table 25: China Smart Wearables Market for Oil & Gas Industry Market Value (US$ Mn) Forecast, by Device Type, 2018–2027
Table 26: China Smart Wearables Market for Oil & Gas Industry Market Value (US$ Mn) Forecast, by Application, 2018–2027
Table 27: Australia Smart Wearables Market for Oil & Gas Industry Market Value (US$ Mn) Forecast, by Device Type, 2018–2027
Table 28: Australia Smart Wearables Market for Oil & Gas Industry Market Value (US$ Mn) Forecast, by Application, 2018–2027
Table 29: India Smart Wearables Market for Oil & Gas Industry Market Value (US$ Mn) Forecast, by Device Type, 2018–2027
Table 30: India Smart Wearables Market for Oil & Gas Industry Market Value (US$ Mn) Forecast, by Application, 2018–2027
Table 31: ASEAN Smart Wearables Market for Oil & Gas Industry Market Value (US$ Mn) Forecast, by Device Type, 2018–2027
Table 32: ASEAN Smart Wearables Market for Oil & Gas Industry Market Value (US$ Mn) Forecast, by Application, 2018–2027
Table 33: Rest of Asia Pacific Smart Wearables Market for Oil & Gas Industry Market Value (US$ Mn) Forecast, by Device Type, 2018–2027
Table 34: Rest of Asia Pacific Smart Wearables Market for Oil & Gas Industry Market Value (US$ Mn) Forecast, by Application, 2018–2027
Table 35: Latin America Smart Wearables Market for Oil & Gas Industry Market Value (US$ Mn) Forecast, by Device Type, 2018–2027
Table 36: Latin America Smart Wearables Market for Oil & Gas Industry Market Value (US$ Mn) Forecast, by Application, 2018–2027
Table 37: Latin America Smart Wearables Market for Oil & Gas Industry Market Value (US$ Mn) Forecast, by Country and Sub-region, 2018–2027
Table 38: Brazil Smart Wearables Market for Oil & Gas Industry Market Value (US$ Mn) Forecast, by Device Type, 2018–2027
Table 39: Brazil Smart Wearables Market for Oil & Gas Industry Market Value (US$ Mn) Forecast, by Application, 2018–2027
Table 40: Mexico Smart Wearables Market for Oil & Gas Industry Market Value (US$ Mn) Forecast, by Device Type, 2018–2027
Table 41: Mexico Smart Wearables Market for Oil & Gas Industry Market Value (US$ Mn) Forecast, by Application, 2018–2027
Table 42: Venezuela Smart Wearables Market for Oil & Gas Industry Market Value (US$ Mn) Forecast, by Device Type, 2018–2027
Table 43: Venezuela Smart Wearables Market for Oil & Gas Industry Market Value (US$ Mn) Forecast, by Application, 2018–2027
Table 44: Rest of Latin America Smart Wearables Market for Oil & Gas Industry Market Value (US$ Mn) Forecast, by Device Type, 2018–2027
Table 45: Rest of Latin America Smart Wearables Market for Oil & Gas Industry Market Value (US$ Mn) Forecast, by Application, 2018–2027
Table 46: Middle East & Africa Smart Wearables Market for Oil & Gas Industry Market Value (US$ Mn) Forecast, by Device Type, 2018–2027
Table 47: Middle East & Africa Smart Wearables Market for Oil & Gas Industry Market Value (US$ Mn) Forecast, by Application, 2018–2027
Table 48: Middle East & Africa Smart Wearables Market for Oil & Gas Industry Market Value (US$ Mn) Forecast, by Country and Sub-region, 2018–2027
Table 49: Saudi Arabia Smart Wearables Market for Oil & Gas Industry Market Value (US$ Mn) Forecast, by Device Type, 2018–2027
Table 50: Saudi Arabia Smart Wearables Market for Oil & Gas Industry Market Value (US$ Mn) Forecast, by Application, 2018–2027
Table 51: UAE Smart Wearables Market for Oil & Gas Industry Market Value (US$ Mn) Forecast, by Device Type, 2018–2027
Table 52: UAE Smart Wearables Market for Oil & Gas Industry Market Value (US$ Mn) Forecast, by Application, 2018–2027
Table 53: Qatar Smart Wearables Market for Oil & Gas Industry Market Value (US$ Mn) Forecast, by Device Type, 2018–2027
Table 54: Qatar Smart Wearables Market for Oil & Gas Industry Market Value (US$ Mn) Forecast, by Application, 2018–2027
Table 55: Nigeria Smart Wearables Market for Oil & Gas Industry Market Value (US$ Mn) Forecast, by Device Type, 2018–2027
Table 56: Nigeria Smart Wearables Market for Oil & Gas Industry Market Value (US$ Mn) Forecast, by Application, 2018–2027
Table 57: Rest of Middle East & Africa Smart Wearables Market for Oil & Gas Industry Market Value (US$ Mn) Forecast, by Device Type, 2018–2027
Table 58: Rest of Middle East & Africa Smart Wearables Market for Oil & Gas Industry Market Value (US$ Mn) Forecast, by Application, 2018–2027
List of Figures
Figure 01: Global Smart Wearables Market for Oil & Gas Industry Value Share Analysis, by Device Type
Figure 02: Global Smart Wearables Market for Oil & Gas Industry Attractiveness Analysis, by Device Type
Figure 03: Global Smart Wearables Market for Oil & Gas Industry Value Share Analysis, by Application
Figure 04: Global Smart Wearables Market for Oil & Gas Industry Attractiveness Analysis, by Application
Figure 05: Global Smart Wearables Market for Oil & Gas Industry Value Share Analysis, by Region
Figure 06: Global Smart Wearables Market for Oil & Gas Industry Attractiveness Analysis, by Region
Figure 07: North America Smart Wearables Market for Oil & Gas Industry Value (US$ Mn), 2018–2027
Figure 08: North America Smart Wearables Market for Oil & Gas Industry Value Share Analysis, by Country
Figure 09: North America Smart Wearables Market for Oil & Gas Industry Attractiveness Analysis, by Country
Figure 10: North America Smart Wearables Market for Oil & Gas Industry Value Share Analysis, by Device Type
Figure 11: North America Smart Wearables Market for Oil & Gas Industry Attractiveness Analysis, by Device Type
Figure 12: North America Smart Wearables Market for Oil & Gas Industry Value Share Analysis, by Application
Figure 13: North America Smart Wearables Market for Oil & Gas Industry Attractiveness Analysis, by Application
Figure 14: Europe Smart Wearables Market for Oil & Gas Industry Value (US$ Mn), 2018–2027
Figure 15: Europe Smart Wearables Market for Oil & Gas Industry Value Share Analysis, by Country and Sub-region
Figure 16: Europe Smart Wearables Market for Oil & Gas Industry Attractiveness Analysis, by Country and Sub-region
Figure 17: Europe Smart Wearables Market for Oil & Gas Industry Value Share Analysis, by Device Type
Figure 18: Europe Smart Wearables Market for Oil & Gas Industry Attractiveness Analysis, by Device Type
Figure 19: Europe Smart Wearables Market for Oil & Gas Industry Value Share Analysis, by Application
Figure 20: Europe Smart Wearables Market for Oil & Gas Industry Attractiveness Analysis, by Application
Figure 21: Asia Pacific Smart Wearables Market for Oil & Gas Industry Value (US$ Mn), 2018–2027
Figure 22: Asia Pacific Smart Wearables Market for Oil & Gas Industry Value Share Analysis, by Country and Sub-region
Figure 23: Asia Pacific Smart Wearables Market for Oil & Gas Industry Attractiveness Analysis, by Country and Sub-region
Figure 24: Asia Pacific Smart Wearables Market for Oil & Gas Industry Value Share Analysis, by Device Type
Figure 25: Asia Pacific Smart Wearables Market for Oil & Gas Industry Attractiveness Analysis, by Device Type
Figure 26: Asia Pacific Smart Wearables Market for Oil & Gas Industry Value Share Analysis, by Application
Figure 27: Asia Pacific Smart Wearables Market for Oil & Gas Industry Attractiveness Analysis, by Application
Figure 28: Latin America Smart Wearables Market for Oil & Gas Industry Value (US$ Mn), 2018–2027
Figure 29: Latin America Smart Wearables Market for Oil & Gas Industry Value Share Analysis, by Country and Sub-region
Figure 30: Latin America Smart Wearables Market for Oil & Gas Industry Attractiveness Analysis, by Country and Sub-region
Figure 31: Latin America Smart Wearables Market for Oil & Gas Industry Value Share Analysis, by Device Type
Figure 32: Latin America Smart Wearables Market for Oil & Gas Industry Attractiveness Analysis, by Device Type
Figure 33: Latin America Smart Wearables Market for Oil & Gas Industry Value Share Analysis, by Application
Figure 34: Latin America Smart Wearables Market for Oil & Gas Industry Attractiveness Analysis, by Application
Figure 35: Middle East & Africa Smart Wearables Market for Oil & Gas Industry Value (US$ Mn), 2018–2027
Figure 36: Middle East & Africa Smart Wearables Market for Oil & Gas Industry Value Share Analysis, by Country and Sub-region
Figure 37: Middle East & Africa Smart Wearables Market for Oil & Gas Industry Attractiveness Analysis, by Country and Sub-region
Figure 38: Middle East & Africa Smart Wearables Market for Oil & Gas Industry Value Share Analysis, by Device Type
Figure 39: Middle East & Africa Smart Wearables Market for Oil & Gas Industry Attractiveness Analysis, by Device Type
Figure 40: Middle East & Africa Smart Wearables Market for Oil & Gas Industry Value Share Analysis, by Application
Figure 41: Middle East & Africa Smart Wearables Market for Oil & Gas Industry Attractiveness Analysis, by Application
Figure 42: Honeywell International Inc. Breakdown of Revenue, by Business Segment, 2018
Figure 43: Honeywell International Inc. Breakdown of Revenue, by Geography, 2018
Figure 44: Honeywell International Inc. Revenue (US$ Mn) and Y-o-Y Growth (%), 2015–2018
Figure 45: TOSHIBA CORPORATION Breakdown of Revenue, by Geography, 2018
Figure 46: TOSHIBA CORPORATION Revenue (US$ Mn) and Y-o-Y Growth (%), 2015–2018
Figure 47: 3M Breakdown of Revenue, by Business Segment, 2018
Figure 48: 3M Breakdown of Revenue, by Geography, 2018
Figure 49: 3M Revenue (US$ Mn) and Y-o-Y Growth (%), 2015–2018
Figure 50: ANSELL LTD Breakdown of Revenue, by Business Segment, 2018
Figure 51: ANSELL LTD Breakdown of Revenue, by Geography, 2018
Figure 52: ANSELL LTD Revenue (US$ Mn) and Y-o-Y Growth (%), 2015–2018
Figure 53: Alphabet Inc. Revenue (US$ Mn) and Y-o-Y Growth (%), 2015–2018
Figure 54: Apple Inc. Breakdown of Revenue, by Business Segment, 2018
Figure 55: Apple Inc. Breakdown of Revenue, by Geography, 2018
Figure 56: Apple Inc. Revenue (US$ Mn) and Y-o-Y Growth (%), 2015–2018
Figure 57: Samsung Electronics Co., Ltd. Breakdown of Revenue, by Geography, 2018
Figure 58: Samsung Electronics Co., Ltd. Revenue (US$ Bn) and Y-o-Y Growth (%), 2015–2018
Figure 59: FUJITSU Breakdown of Revenue, by Geography, 2018
Figure 60: FUJITSU Revenue (US$ Mn) and Y-o-Y Growth (%), 2015–2018
Copyright © Transparency Market Research, Inc. All Rights reserved
Trust Online

Oil & Gas Industry-Smart Wearables Market