

Reports
Reports
The global rice husk ash market size was valued at USD 1.6 Billion in 2025 and is projected to reach USD 2.8 Billion by 2036, expanding at a CAGR of 5.0% from 2026 to 2036. The market is primarily driven by rising demand for sustainable construction materials and wide availability of rice husk feedstock.
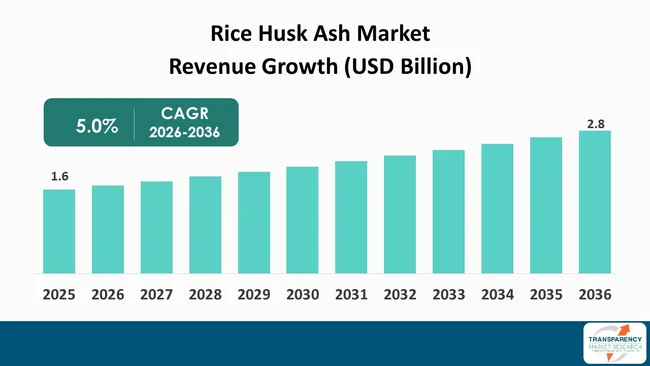
The rice husk ash market has been experiencing an uptick in demand owing to increasing utilization of agricultural waste and growing demand for environmentally sustainable materials. One of the key drivers for market growth has been the growing use of RHA as an additive in cement where the presence of high amounts of silica in RHA improves the mechanical properties of concrete while reducing dependency on cement.
The manufacturing process typically involves collecting rice husks from rice mills, drying the feedstock, and combusting it under controlled temperatures to remove organic matter while preserving a high proportion of amorphous silica.
Major producers are investing in improved combustion technologies, ash purification, particle-size reduction, and silica recovery to enhance product quality and consistency. The other measures being taken by cement manufacturers, construction material makers, and specialty silica firms include higher use of RHA in concrete, bricks, rubber, coating applications, and silica products.
Rice Husk Ash (RHA) is a silica-rich material produced through the controlled combustion of rice husks generated during rice-milling operations. Controlled combustion removes organic matter from the rice husk and produces ash with a high silica content. The particle size, silica content, and reactivity of RHA vary depending on combustion conditions and subsequent processing. RHA is extensively used as an additive material for cement, concrete, mortar, bricks, and other construction materials due to its pozzolanic characteristics. It is also used in producing silica, rubber, plastics, paints, ceramics, refractory materials, and soil stabilization.
| Attribute | Detail |
|---|---|
| Rice Husk Ash Market Drivers |
|
The increasing importance of minimizing the impact of the construction industry on the environment has created a need for alternative cementitious materials like rice husk ash (RHA). Cement production in its traditional sense is highly associated with CO2 emissions, making it important for cement and concrete producers to use supplementary cementitious materials that will serve as replacements for clinker. RHA is made up of a significant quantity of reactive amorphous silica, which gives it the capacity to react pozzolanically and increase the quality of cementitious products.
There are various benefits of using RHA, some of which include higher compressive strengths, lower permeability levels, and resistance to chemical and environmental factors. The fine particle size of RHA can also increase concrete density. As the development of infrastructure continues in emerging economies, especially in the Asia-Pacific region, there are new opportunities for RHA due to the rising demand for construction inputs that are cost-effective and environmentally friendly. There are also benefits of using RHA in regions where rice production takes place and the distance between rice milling facilities and manufacturers of construction inputs is shorter.
Growing emphasis on low-carbon construction, green buildings, resource efficiency, and clinker reduction is expected to support greater adoption of RHA. Manufacturers of cement and concrete are considering using available agricultural wastes as substitutes to mineral additives. RHA manufacturing, through better control of combustion process, milling and classifying, can help address product-consistency challenges. With improved technology, and specifications of supplementary cementitious materials becoming more standardized, RHA can be considered a promising building material.
As the rice industry grows globally, it is generating an increasing source of rice husk that is used as the primary raw material to produce Rice Husk Ash. Rice husk is generated as a byproduct during the milling of paddy into rice. A significant amount of this byproduct has been disposed of through burning, dumping, or using it for low-grade energy. Converting rice husk to RHA offers a chance to convert this byproduct into commercially viable material to help meet waste management objectives as well as generate more income.
The presence of rice husk is especially advantageous in major rice-growing countries in the Asia-Pacific region like India, China, Indonesia, Vietnam, Thailand, and Bangladesh. Rice processing plants are highly concentrated in these areas and provide RHA producers with access to substantial feedstock volumes. Locating ash processing facilities close to rice mills helps minimize transport costs of the raw material as well as provide an uninterrupted source of feedstock.
The rising focus on waste recycling in agriculture is also motivating the rice millers and industries to look at better uses of rice husks. Rather than just looking at the disposal issue or fuel potential of rice husks, controlled processing of rice husks can produce RHA suitable for construction and silica-based applications. Innovations in efficient burning systems, temperature control, ash collection, grinding and purification processes are helping increase the quality of the obtained ash. As a result, the presence of sufficient feedstock along with efforts to commercialize agricultural waste streams supports the expansion of the rice husk ash market.
| Attribute | Detail |
|---|---|
| Rice Husk Ash Market Opportunity |
|
The availability of substantial amounts of silica in RHA means that producers have opportunities to move beyond conventional low-value applications to produce silica for various industries. This can be done by employing the burning method and then the purification method and later precipitation of silica to produce silica suitable for application in industries. This can create higher-value revenue opportunities and support portfolio diversification. Increasing needs for sustainable sources of industrial silica also create more opportunities. Companies with reliable access to rice husk feedstock can also develop vertically integrated production models.
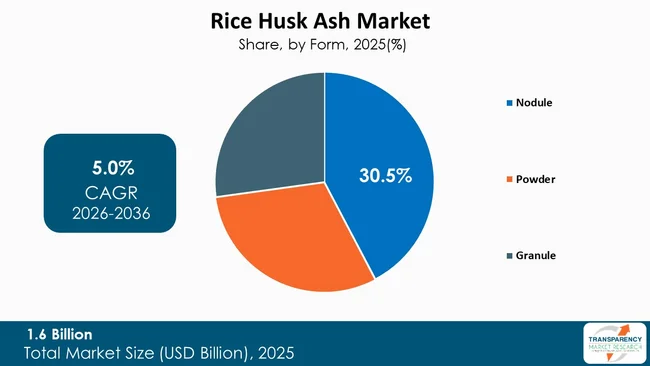
The nodule segment dominated the global rice husk ash market in 2025, accounting for approximately 42.3% of total market revenue, due to its high silica content, porous nature, and specific particle characteristics, which make it suitable for specialized purposes like construction materials, refractories, cement additions, and silica-based products. Increasing need for value added silica products, increasing usage of agricultural waste, and reduction of carbon emissions from conventional cement and industrial materials have led to the development of rice husk ash into nodule forms.
Nodule is defined as a dense, aggregated, or pelletized form of rice husk ash, obtained via controlled agglomeration, granulation, or thermal treatment. These nodular particles contain high silica content of the rice husk ash along with improved handling, lower dust generation, more consistent particle size, and better transportation characteristics.
| Attribute | Detail |
|---|---|
| Leading Region |
|
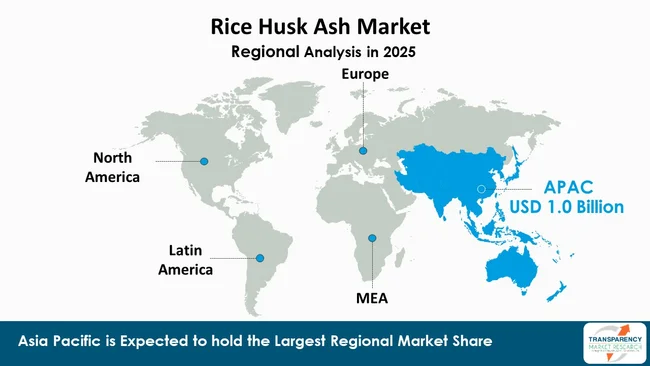
Asia Pacific dominated the global rice husk ash market in 2025, accounting for approximately 63.1% of total market revenue supported by extensive rice production, a large rice-milling industry, and abundant availability of rice husk feedstock. Many countries in the Asia Pacific region including India, China, Vietnam, Thailand, and Indonesia produce large amounts of rice waste.
Prominent companies operating in the rice husk ash market include Refratechnik, AC2N Company Limited, Ambika Biotech, FADTHAI, An Phu Imex Co., Ltd., Maa Chandeswari Agrochem Pvt. Ltd., and Steel Melt Industries. These companies supply RHA powders, granules, refractory materials, insulation products, construction additives, and silica-based products for various industrial applications. Refratechnik develops RHA-based refractory and insulation products, while Ambika Biotech supplies RHA in powder and granule forms.
Apart from the above stated firms some of the other key players operating in this market are Deelert Intertrade Co., Ltd., Haripriya Refractories Pvt. Ltd., Guru Corporation, SKF Bio Tech, EKA Production, RICE HUSK ASH (THAILAND) CO., LTD., AIW Manufacturing Company Limited, and VinaTap.
Each of these players has been profiled in the rice husk ash market research report based on parameters such as company overview, financial overview, business strategies, product portfolio, business segments, and recent developments.
| Attribute | Detail |
|---|---|
| Market Size Value in 2025 | USD 1.6 Billion |
| Market Forecast Value in 2036 | USD 2.8 Billion |
| Growth Rate (CAGR) | 5.0% |
| Forecast Period | 2026-2036 |
| Historical Data Available for | 2021-2025 |
| Quantitative Units | USD Billion for Value and Tons for Volume |
| Market Analysis | It includes cross-segment analysis at the global as well as regional level. The qualitative analysis includes drivers, restraints, Rice Husk Ash market opportunities, key trends, Porter’s Five Forces analysis, value chain analysis, and key trend analysis. |
| Competition Landscape |
|
| Format | Electronic (PDF) + Excel |
| Market Segmentation | Form
|
| Regions Covered |
|
| Countries Covered |
|
| Companies Profiled |
|
| Customization Scope | Available upon request |
| Pricing | Available upon request |
The rice husk ash market was valued at USD 1.6 Billion in 2025.
The rice husk ash industry is expected to expand at a CAGR of 5.0% from 2026 to 2036.
Key drivers include rising demand for sustainable construction materials and growing rice production and availability of rice husk feedstock.
The nodule segment accounted for the largest share of the market, representing 42.3% in 2025.
Asia Pacific was the most lucrative region in 2025.
Refratechnik, Deelert Intertrade Co., Ltd., EKA Production, Steel Melt Industries, and Haripriya Refractories Pvt. Ltd. are among the prominent players operating in the global rice husk ash market.
Table 1: Global Rice Husk Ash Market Volume (Tons) Forecast, by Form, 2026 to 2036
Table 2: Global Rice Husk Ash Market Value (USD Billion) Forecast, by Form, 2026 to 2036
Table 3: Global Rice Husk Ash Market Volume (Tons) Forecast, by Silica Content, 2026 to 2036
Table 4: Global Rice Husk Ash Market Value (USD Billion) Forecast, by Silica Content, 2026 to 2036
Table 5: Global Rice Husk Ash Market Volume (Tons) Forecast, by Function 2026 to 2036
Table 6: Global Rice Husk Ash Market Value (USD Billion) Forecast, by Function 2026 to 2036
Table 7: Global Rice Husk Ash Market Volume (Tons) Forecast, by Application, 2026 to 2036
Table 8: Global Rice Husk Ash Market Value (USD Billion) Forecast, by Application, 2026 to 2036
Table 9: Global Rice Husk Ash Market Volume (Tons) Forecast, by End-use, 2026 to 2036
Table 10: Global Rice Husk Ash Market Value (USD Billion) Forecast, by End-use, 2026 to 2036
Table 11: Global Rice Husk Ash Market Volume (Tons) Forecast, by Region, 2026 to 2036
Table 12: Global Rice Husk Ash Market Value (USD Billion) Forecast, by Region, 2026 to 2036
Table 13: North America Rice Husk Ash Market Volume (Tons) Forecast, by Form, 2026 to 2036
Table 14: North America Rice Husk Ash Market Value (USD Billion) Forecast, by Form, 2026 to 2036
Table 15: North America Rice Husk Ash Market Volume (Tons) Forecast, by Silica Content, 2026 to 2036
Table 16: North America Rice Husk Ash Market Value (USD Billion) Forecast, by Silica Content, 2026 to 2036
Table 17: North America Rice Husk Ash Market Volume (Tons) Forecast, by Function 2026 to 2036
Table 18: North America Rice Husk Ash Market Value (USD Billion) Forecast, by Function 2026 to 2036
Table 19: North America Rice Husk Ash Market Volume (Tons) Forecast, by Application, 2026 to 2036
Table 20: North America Rice Husk Ash Market Value (USD Billion) Forecast, by Application, 2026 to 2036
Table 21: North America Rice Husk Ash Market Volume (Tons) Forecast, by End-use, 2026 to 2036
Table 22: North America Rice Husk Ash Market Value (USD Billion) Forecast, by End-use, 2026 to 2036
Table 23: North America Rice Husk Ash Market Volume (Tons) Forecast, by Country, 2026 to 2036
Table 24: North America Rice Husk Ash Market Value (USD Billion) Forecast, by Country, 2026 to 2036
Table 25: U.S. Rice Husk Ash Market Volume (Tons) Forecast, by Form, 2026 to 2036
Table 26: U.S. Rice Husk Ash Market Value (USD Billion) Forecast, by Form, 2026 to 2036
Table 27: U.S. Rice Husk Ash Market Volume (Tons) Forecast, by Silica Content, 2026 to 2036
Table 28: U.S. Rice Husk Ash Market Value (USD Billion) Forecast, by Silica Content, 2026 to 2036
Table 29: U.S. Rice Husk Ash Market Volume (Tons) Forecast, by Function 2026 to 2036
Table 30: U.S. Rice Husk Ash Market Value (USD Billion) Forecast, by Function, 2026 to 2036
Table 31: U.S. Rice Husk Ash Market Volume (Tons) Forecast, by Application, 2026 to 2036
Table 32: U.S. Rice Husk Ash Market Value (USD Billion) Forecast, by Application, 2026 to 2036
Table 33: U.S. Rice Husk Ash Market Volume (Tons) Forecast, by End-use, 2026 to 2036
Table 34: U.S. Rice Husk Ash Market Value (USD Billion) Forecast, by End-use, 2026 to 2036
Table 35: Canada Rice Husk Ash Market Volume (Tons) Forecast, by Form, 2026 to 2036
Table 36: Canada Rice Husk Ash Market Value (USD Billion) Forecast, by Form, 2026 to 2036
Table 37: Canada Rice Husk Ash Market Volume (Tons) Forecast, by Silica Content, 2026 to 2036
Table 38: Canada Rice Husk Ash Market Value (USD Billion) Forecast, by Silica Content, 2026 to 2036
Table 39: Canada Rice Husk Ash Market Volume (Tons) Forecast, by Function, 2026 to 2036
Table 40: Canada Rice Husk Ash Market Value (USD Billion) Forecast, by Function, 2026 to 2036
Table 41: Canada Rice Husk Ash Market Volume (Tons) Forecast, by Application, 2026 to 2036
Table 42: Canada Rice Husk Ash Market Value (USD Billion) Forecast, by Application, 2026 to 2036
Table 43: Canada Rice Husk Ash Market Volume (Tons) Forecast, by End-use, 2026 to 2036
Table 44: Canada Rice Husk Ash Market Value (USD Billion) Forecast, by End-use 2026 to 2036
Table 45: Europe Rice Husk Ash Market Volume (Tons) Forecast, by Form, 2026 to 2036
Table 46: Europe Rice Husk Ash Market Value (USD Billion) Forecast, by Form, 2026 to 2036
Table 47: Europe Rice Husk Ash Market Volume (Tons) Forecast, by Silica Content, 2026 to 2036
Table 48: Europe Rice Husk Ash Market Value (USD Billion) Forecast, by Silica Content, 2026 to 2036
Table 49: Europe Rice Husk Ash Market Volume (Tons) Forecast, by Function 2026 to 2036
Table 50: Europe Rice Husk Ash Market Value (USD Billion) Forecast, by Function, 2026 to 2036
Table 51: Europe Rice Husk Ash Market Volume (Tons) Forecast, by Application, 2026 to 2036
Table 52: Europe Rice Husk Ash Market Value (USD Billion) Forecast, by Application, 2026 to 2036
Table 53: Europe Rice Husk Ash Market Volume (Tons) Forecast, by End-use, 2026 to 2036
Table 54: Europe Rice Husk Ash Market Value (USD Billion) Forecast, by End-use 2026 to 2036
Table 55: Europe Rice Husk Ash Market Volume (Tons) Forecast, by Country and Sub-region, 2026 to 2036
Table 56: Europe Rice Husk Ash Market Value (USD Billion) Forecast, by Country and Sub-region, 2026 to 2036
Table 57: Germany Rice Husk Ash Market Volume (Tons) Forecast, by Form, 2026 to 2036
Table 58: Germany Rice Husk Ash Market Value (USD Billion) Forecast, by Form, 2026 to 2036
Table 59: Germany Rice Husk Ash Market Volume (Tons) Forecast, by Silica Content, 2026 to 2036
Table 60: Germany Rice Husk Ash Market Value (USD Billion) Forecast, by Silica Content, 2026 to 2036
Table 61: Germany Rice Husk Ash Market Volume (Tons) Forecast, by Function, 2026 to 2036
Table 62: Germany Rice Husk Ash Market Value (USD Billion) Forecast, by Function, 2026 to 2036
Table 63: Germany Rice Husk Ash Market Volume (Tons) Forecast, by Application, 2026 to 2036
Table 64: Germany Rice Husk Ash Market Value (USD Billion) Forecast, by Application, 2026 to 2036
Table 65: Germany Rice Husk Ash Market Volume (Tons) Forecast, by End-use, 2026 to 2036
Table 66: Germany Rice Husk Ash Market Value (USD Billion) Forecast, by End-use 2026 to 2036
Table 67: U.K. Rice Husk Ash Market Volume (Tons) Forecast, by Form, 2026 to 2036
Table 68: U.K. Rice Husk Ash Market Value (USD Billion) Forecast, by Form, 2026 to 2036
Table 69: U.K. Rice Husk Ash Market Volume (Tons) Forecast, by Silica Content, 2026 to 2036
Table 70: U.K. Rice Husk Ash Market Value (USD Billion) Forecast, by Silica Content, 2026 to 2036
Table 71: U.K. Rice Husk Ash Market Volume (Tons) Forecast, by Function, 2026 to 2036
Table 72: U.K. Rice Husk Ash Market Value (USD Billion) Forecast, by Function, 2026 to 2036
Table 73: U.K. Rice Husk Ash Market Volume (Tons) Forecast, by Application, 2026 to 2036
Table 74: U.K. Rice Husk Ash Market Value (USD Billion) Forecast, by Application, 2026 to 2036
Table 75: U.K. Rice Husk Ash Market Volume (Tons) Forecast, by End-use, 2026 to 2036
Table 76: U.K. Rice Husk Ash Market Value (USD Billion) Forecast, by End-use 2026 to 2036
Table 77: France Rice Husk Ash Market Volume (Tons) Forecast, by Form, 2026 to 2036
Table 78: France Rice Husk Ash Market Value (USD Billion) Forecast, by Form, 2026 to 2036
Table 79: France Rice Husk Ash Market Volume (Tons) Forecast, by Silica Content, 2026 to 2036
Table 80: France Rice Husk Ash Market Value (USD Billion) Forecast, by Silica Content, 2026 to 2036
Table 81: France Rice Husk Ash Market Volume (Tons) Forecast, by Function, 2026 to 2036
Table 82: France Rice Husk Ash Market Value (USD Billion) Forecast, by Function, 2026 to 2036
Table 83: France Rice Husk Ash Market Volume (Tons) Forecast, by Application, 2026 to 2036
Table 84: France Rice Husk Ash Market Value (USD Billion) Forecast, by Application, 2026 to 2036
Table 85: France Rice Husk Ash Market Volume (Tons) Forecast, by End-use, 2026 to 2036
Table 86: France Rice Husk Ash Market Value (USD Billion) Forecast, by End-use 2026 to 2036
Table 87: Spain Rice Husk Ash Market Volume (Tons) Forecast, by Form, 2026 to 2036
Table 88: Spain Rice Husk Ash Market Value (USD Billion) Forecast, by Form, 2026 to 2036
Table 89: Spain Rice Husk Ash Market Volume (Tons) Forecast, by Silica Content, 2026 to 2036
Table 90: Spain Rice Husk Ash Market Value (USD Billion) Forecast, by Silica Content, 2026 to 2036
Table 91: Spain Rice Husk Ash Market Volume (Tons) Forecast, by Function, 2026 to 2036
Table 92: Spain Rice Husk Ash Market Value (USD Billion) Forecast, by Function, 2026 to 2036
Table 93: Spain Rice Husk Ash Market Volume (Tons) Forecast, by Application, 2026 to 2036
Table 94: Spain Rice Husk Ash Market Value (USD Billion) Forecast, by Application, 2026 to 2036
Table 95: Spain Rice Husk Ash Market Volume (Tons) Forecast, by End-use, 2026 to 2036
Table 96: Spain Rice Husk Ash Market Value (USD Billion) Forecast, by End-use 2026 to 2036
Table 97: Italy Rice Husk Ash Market Volume (Tons) Forecast, by Form, 2026 to 2036
Table 98: Italy Rice Husk Ash Market Value (USD Billion) Forecast, by Form, 2026 to 2036
Table 99: Italy Rice Husk Ash Market Volume (Tons) Forecast, by Silica Content, 2026 to 2036
Table 100: Italy Rice Husk Ash Market Value (USD Billion) Forecast, by Silica Content, 2026 to 2036
Table 101: Italy Rice Husk Ash Market Volume (Tons) Forecast, by Function, 2026 to 2036
Table 102: Italy Rice Husk Ash Market Value (USD Billion) Forecast, by Function, 2026 to 2036
Table 103: Italy Rice Husk Ash Market Volume (Tons) Forecast, by Application, 2026 to 2036
Table 104: Italy Rice Husk Ash Market Value (USD Billion) Forecast, by Application, 2026 to 2036
Table 105: Italy Rice Husk Ash Market Volume (Tons) Forecast, by End-use, 2026 to 2036
Table 106: Italy Rice Husk Ash Market Value (USD Billion) Forecast, by End-use 2026 to 2036
Table 107: Russia & CIS Rice Husk Ash Market Volume (Tons) Forecast, by Form, 2026 to 2036
Table 108: Russia & CIS Rice Husk Ash Market Value (USD Billion) Forecast, by Form, 2026 to 2036
Table 109: Russia & CIS Rice Husk Ash Market Volume (Tons) Forecast, by Silica Content, 2026 to 2036
Table 110: Russia & CIS Rice Husk Ash Market Value (USD Billion) Forecast, by Silica Content, 2026 to 2036
Table 111: Russia & CIS Rice Husk Ash Market Volume (Tons) Forecast, by Function, 2026 to 2036
Table 112: Russia & CIS Rice Husk Ash Market Value (USD Billion) Forecast, by Function, 2026 to 2036
Table 113: Russia & CIS Rice Husk Ash Market Volume (Tons) Forecast, by Application, 2026 to 2036
Table 114: Russia & CIS Rice Husk Ash Market Value (USD Billion) Forecast, by Application, 2026 to 2036
Table 115: Russia & CIS Rice Husk Ash Market Volume (Tons) Forecast, by End-use, 2026 to 2036
Table 116: Russia & CIS Rice Husk Ash Market Value (USD Billion) Forecast, by End-use 2026 to 2036
Table 117: Rest of Europe Rice Husk Ash Market Volume (Tons) Forecast, by Form, 2026 to 2036
Table 118: Rest of Europe Rice Husk Ash Market Value (USD Billion) Forecast, by Form, 2026 to 2036
Table 119: Rest of Europe Rice Husk Ash Market Volume (Tons) Forecast, by Silica Content, 2026 to 2036
Table 120: Rest of Europe Rice Husk Ash Market Value (USD Billion) Forecast, by Silica Content, 2026 to 2036
Table 121: Rest of Europe Rice Husk Ash Market Volume (Tons) Forecast, by Function, 2026 to 2036
Table 122: Rest of Europe Rice Husk Ash Market Value (USD Billion) Forecast, by Function, 2026 to 2036
Table 123: Rest of Europe Rice Husk Ash Market Volume (Tons) Forecast, by Application, 2026 to 2036
Table 124: Rest of Europe Rice Husk Ash Market Value (USD Billion) Forecast, by Application, 2026 to 2036
Table 125: Rest of Europe Rice Husk Ash Market Volume (Tons) Forecast, by End-use, 2026 to 2036
Table 126: Rest of Europe Rice Husk Ash Market Value (USD Billion) Forecast, by End-use 2026 to 2036
Table 127: Asia Pacific Rice Husk Ash Market Volume (Tons) Forecast, by Form, 2026 to 2036
Table 128: Asia Pacific Rice Husk Ash Market Value (USD Billion) Forecast, by Form, 2026 to 2036
Table 129: Asia Pacific Rice Husk Ash Market Volume (Tons) Forecast, by Silica Content, 2026 to 2036
Table 130: Asia Pacific Rice Husk Ash Market Value (USD Billion) Forecast, by Silica Content, 2026 to 2036
Table 131: Asia Pacific Rice Husk Ash Market Volume (Tons) Forecast, by Function, 2026 to 2036
Table 132: Asia Pacific Rice Husk Ash Market Value (USD Billion) Forecast, by Function, 2026 to 2036
Table 133: Asia Pacific Rice Husk Ash Market Volume (Tons) Forecast, by Application, 2026 to 2036
Table 134: Asia Pacific Rice Husk Ash Market Value (USD Billion) Forecast, by Application, 2026 to 2036
Table 135: Asia Pacific Rice Husk Ash Market Volume (Tons) Forecast, by End-use, 2026 to 2036
Table 136: Asia Pacific Rice Husk Ash Market Value (USD Billion) Forecast, by End-use 2026 to 2036
Table 137: Asia Pacific Rice Husk Ash Market Volume (Tons) Forecast, by Country and Sub-region, 2026 to 2036
Table 138: Asia Pacific Rice Husk Ash Market Value (USD Billion) Forecast, by Country and Sub-region, 2026 to 2036
Table 139: China Rice Husk Ash Market Volume (Tons) Forecast, by Form, 2026 to 2036
Table 140: China Rice Husk Ash Market Value (USD Billion) Forecast, by Form 2026 to 2036
Table 141: China Rice Husk Ash Market Volume (Tons) Forecast, by Silica Content, 2026 to 2036
Table 142: China Rice Husk Ash Market Value (USD Billion) Forecast, by Silica Content, 2026 to 2036
Table 143: China Rice Husk Ash Market Volume (Tons) Forecast, by Function, 2026 to 2036
Table 144: China Rice Husk Ash Market Value (USD Billion) Forecast, by Function, 2026 to 2036
Table 145: China Rice Husk Ash Market Volume (Tons) Forecast, by Application, 2026 to 2036
Table 146: China Rice Husk Ash Market Value (USD Billion) Forecast, by Application, 2026 to 2036
Table 147: China Rice Husk Ash Market Volume (Tons) Forecast, by End-use, 2026 to 2036
Table 148: China Rice Husk Ash Market Value (USD Billion) Forecast, by End-use 2026 to 2036
Table 149: India Rice Husk Ash Market Volume (Tons) Forecast, by Form, 2026 to 2036
Table 150: India Rice Husk Ash Market Value (USD Billion) Forecast, by Form, 2026 to 2036
Table 151: India Rice Husk Ash Market Volume (Tons) Forecast, by Silica Content, 2026 to 2036
Table 152: India Rice Husk Ash Market Value (USD Billion) Forecast, by Silica Content, 2026 to 2036
Table 153: India Rice Husk Ash Market Volume (Tons) Forecast, by Function, 2026 to 2036
Table 154: India Rice Husk Ash Market Value (USD Billion) Forecast, by Function, 2026 to 2036
Table 155: India Rice Husk Ash Market Volume (Tons) Forecast, by Application, 2026 to 2036
Table 156: India Rice Husk Ash Market Value (USD Billion) Forecast, by Application, 2026 to 2036
Table 157: India Rice Husk Ash Market Volume (Tons) Forecast, by End-use, 2026 to 2036
Table 158: India Rice Husk Ash Market Value (USD Billion) Forecast, by End-use 2026 to 2036
Table 159: Japan Rice Husk Ash Market Volume (Tons) Forecast, by Form, 2026 to 2036
Table 160: Japan Rice Husk Ash Market Value (USD Billion) Forecast, by Form, 2026 to 2036
Table 161: Japan Rice Husk Ash Market Volume (Tons) Forecast, by Silica Content, 2026 to 2036
Table 162: Japan Rice Husk Ash Market Value (USD Billion) Forecast, by Silica Content, 2026 to 2036
Table 163: Japan Rice Husk Ash Market Volume (Tons) Forecast, by Function, 2026 to 2036
Table 164: Japan Rice Husk Ash Market Value (USD Billion) Forecast, by Function, 2026 to 2036
Table 165: Japan Rice Husk Ash Market Volume (Tons) Forecast, by Application, 2026 to 2036
Table 166: Japan Rice Husk Ash Market Value (USD Billion) Forecast, by Application, 2026 to 2036
Table 167: Japan Rice Husk Ash Market Volume (Tons) Forecast, by End-use, 2026 to 2036
Table 168: Japan Rice Husk Ash Market Value (USD Billion) Forecast, by End-use 2026 to 2036
Table 169: ASEAN Rice Husk Ash Market Volume (Tons) Forecast, by Form, 2026 to 2036
Table 170: ASEAN Rice Husk Ash Market Value (USD Billion) Forecast, by Form, 2026 to 2036
Table 171: ASEAN Rice Husk Ash Market Volume (Tons) Forecast, by Silica Content, 2026 to 2036
Table 172: ASEAN Rice Husk Ash Market Value (USD Billion) Forecast, by Silica Content, 2026 to 2036
Table 173: ASEAN Rice Husk Ash Market Volume (Tons) Forecast, by Function, 2026 to 2036
Table 174: ASEAN Rice Husk Ash Market Value (USD Billion) Forecast, by Function, 2026 to 2036
Table 175: ASEAN Rice Husk Ash Market Volume (Tons) Forecast, by Application, 2026 to 2036
Table 176: ASEAN Rice Husk Ash Market Value (USD Billion) Forecast, by Application, 2026 to 2036
Table 177: ASEAN Rice Husk Ash Market Volume (Tons) Forecast, by End-use, 2026 to 2036
Table 178: ASEAN Rice Husk Ash Market Value (USD Billion) Forecast, by End-use 2026 to 2036
Table 179: Rest of Asia Pacific Rice Husk Ash Market Volume (Tons) Forecast, by Form, 2026 to 2036
Table 180: Rest of Asia Pacific Rice Husk Ash Market Value (USD Billion) Forecast, by Form, 2026 to 2036
Table 181: Rest of Asia Pacific Rice Husk Ash Market Volume (Tons) Forecast, by Silica Content, 2026 to 2036
Table 182: Rest of Asia Pacific Rice Husk Ash Market Value (USD Billion) Forecast, by Silica Content, 2026 to 2036
Table 183: Rest of Asia Pacific Rice Husk Ash Market Volume (Tons) Forecast, by Function, 2026 to 2036
Table 184: Rest of Asia Pacific Rice Husk Ash Market Value (USD Billion) Forecast, by Function, 2026 to 2036
Table 185: Rest of Asia Pacific Rice Husk Ash Market Volume (Tons) Forecast, by Application, 2026 to 2036
Table 186: Rest of Asia Pacific Rice Husk Ash Market Value (USD Billion) Forecast, by Application, 2026 to 2036
Table 187: Rest of Asia Pacific Rice Husk Ash Market Volume (Tons) Forecast, by End-use, 2026 to 2036
Table 188: Rest of Asia Pacific Rice Husk Ash Market Value (USD Billion) Forecast, by End-use 2026 to 2036
Table 189: Latin America Rice Husk Ash Market Volume (Tons) Forecast, by Form, 2026 to 2036
Table 190: Latin America Rice Husk Ash Market Value (USD Billion) Forecast, by Form, 2026 to 2036
Table 191: Latin America Rice Husk Ash Market Volume (Tons) Forecast, by Silica Content, 2026 to 2036
Table 192: Latin America Rice Husk Ash Market Value (USD Billion) Forecast, by Silica Content, 2026 to 2036
Table 193: Latin America Rice Husk Ash Market Volume (Tons) Forecast, by Function, 2026 to 2036
Table 194: Latin America Rice Husk Ash Market Value (USD Billion) Forecast, by Function, 2026 to 2036
Table 195: Latin America Rice Husk Ash Market Volume (Tons) Forecast, by Application, 2026 to 2036
Table 196: Latin America Rice Husk Ash Market Value (USD Billion) Forecast, by Application, 2026 to 2036
Table 197: Latin America Rice Husk Ash Market Volume (Tons) Forecast, by End-use, 2026 to 2036
Table 198: Latin America Rice Husk Ash Market Value (USD Billion) Forecast, by End-use 2026 to 2036
Table 199: Latin America Rice Husk Ash Market Volume (Tons) Forecast, by Country and Sub-region, 2026 to 2036
Table 200: Latin America Rice Husk Ash Market Value (USD Billion) Forecast, by Country and Sub-region, 2026 to 2036
Table 201: Brazil Rice Husk Ash Market Volume (Tons) Forecast, by Form, 2026 to 2036
Table 202: Brazil Rice Husk Ash Market Value (USD Billion) Forecast, by Form, 2026 to 2036
Table 203: Brazil Rice Husk Ash Market Volume (Tons) Forecast, by Silica Content, 2026 to 2036
Table 204: Brazil Rice Husk Ash Market Value (USD Billion) Forecast, by Silica Content, 2026 to 2036
Table 205: Brazil Rice Husk Ash Market Volume (Tons) Forecast, by Function, 2026 to 2036
Table 206: Brazil Rice Husk Ash Market Value (USD Billion) Forecast, by Function, 2026 to 2036
Table 207: Brazil Rice Husk Ash Market Volume (Tons) Forecast, by Application, 2026 to 2036
Table 208: Brazil Rice Husk Ash Market Value (USD Billion) Forecast, by Application, 2026 to 2036
Table 209: Brazil Rice Husk Ash Market Volume (Tons) Forecast, by End-use, 2026 to 2036
Table 210: Brazil Rice Husk Ash Market Value (USD Billion) Forecast, by End-use 2026 to 2036
Table 211: Mexico Rice Husk Ash Market Volume (Tons) Forecast, by Form, 2026 to 2036
Table 212: Mexico Rice Husk Ash Market Value (USD Billion) Forecast, by Form, 2026 to 2036
Table 213: Mexico Rice Husk Ash Market Volume (Tons) Forecast, by Silica Content, 2026 to 2036
Table 214: Mexico Rice Husk Ash Market Value (USD Billion) Forecast, by Silica Content, 2026 to 2036
Table 215: Mexico Rice Husk Ash Market Volume (Tons) Forecast, by Function, 2026 to 2036
Table 216: Mexico Rice Husk Ash Market Value (USD Billion) Forecast, by Function, 2026 to 2036
Table 217: Mexico Rice Husk Ash Market Volume (Tons) Forecast, by Application, 2026 to 2036
Table 218: Mexico Rice Husk Ash Market Value (USD Billion) Forecast, by Application, 2026 to 2036
Table 219: Mexico Rice Husk Ash Market Volume (Tons) Forecast, by End-use, 2026 to 2036
Table 220: Mexico Rice Husk Ash Market Value (USD Billion) Forecast, by End-use 2026 to 2036
Table 221: Rest of Latin America Rice Husk Ash Market Volume (Tons) Forecast, by Form, 2026 to 2036
Table 222: Rest of Latin America Rice Husk Ash Market Value (USD Billion) Forecast, by Form, 2026 to 2036
Table 223: Rest of Latin America Rice Husk Ash Market Volume (Tons) Forecast, by Silica Content, 2026 to 2036
Table 224: Rest of Latin America Rice Husk Ash Market Value (USD Billion) Forecast, by Silica Content, 2026 to 2036
Table 225: Rest of Latin America Rice Husk Ash Market Volume (Tons) Forecast, by Function, 2026 to 2036
Table 226: Rest of Latin America Rice Husk Ash Market Value (USD Billion) Forecast, by Function, 2026 to 2036
Table 227: Rest of Latin America Rice Husk Ash Market Volume (Tons) Forecast, by Application, 2026 to 2036
Table 228: Rest of Latin America Rice Husk Ash Market Value (USD Billion) Forecast, by Application, 2026 to 2036
Table 229: Rest of Latin America Rice Husk Ash Market Volume (Tons) Forecast, by End-use, 2026 to 2036
Table 230: Rest of Latin America Rice Husk Ash Market Value (USD Billion) Forecast, by End-use 2026 to 2036
Table 231: Middle East & Africa Rice Husk Ash Market Volume (Tons) Forecast, by Form, 2026 to 2036
Table 232: Middle East & Africa Rice Husk Ash Market Value (USD Billion) Forecast, by Form, 2026 to 2036
Table 233: Middle East & Africa Rice Husk Ash Market Volume (Tons) Forecast, by Silica Content, 2026 to 2036
Table 234: Middle East & Africa Rice Husk Ash Market Value (USD Billion) Forecast, by Silica Content, 2026 to 2036
Table 235: Middle East & Africa Rice Husk Ash Market Volume (Tons) Forecast, by Function, 2026 to 2036
Table 236: Middle East & Africa Rice Husk Ash Market Value (USD Billion) Forecast, by Function, 2026 to 2036
Table 237: Middle East & Africa Rice Husk Ash Market Volume (Tons) Forecast, by Application, 2026 to 2036
Table 238: Middle East & Africa Rice Husk Ash Market Value (USD Billion) Forecast, by Application, 2026 to 2036
Table 239: Middle East & Africa Rice Husk Ash Market Volume (Tons) Forecast, by End-use, 2026 to 2036
Table 240: Middle East & Africa Rice Husk Ash Market Value (USD Billion) Forecast, by End-use 2026 to 2036
Table 241: Middle East & Africa Rice Husk Ash Market Volume (Tons) Forecast, by Country and Sub-region, 2026 to 2036
Table 242: Middle East & Africa Rice Husk Ash Market Value (USD Billion) Forecast, by Country and Sub-region, 2026 to 2036
Table 243: GCC Rice Husk Ash Market Volume (Tons) Forecast, by Form, 2026 to 2036
Table 244: GCC Rice Husk Ash Market Value (USD Billion) Forecast, by Form, 2026 to 2036
Table 245: GCC Rice Husk Ash Market Volume (Tons) Forecast, by Silica Content, 2026 to 2036
Table 246: GCC Rice Husk Ash Market Value (USD Billion) Forecast, by Silica Content, 2026 to 2036
Table 247: GCC Rice Husk Ash Market Volume (Tons) Forecast, by Function, 2026 to 2036
Table 248: GCC Rice Husk Ash Market Value (USD Billion) Forecast, by Function, 2026 to 2036
Table 249: GCC Rice Husk Ash Market Volume (Tons) Forecast, by Application, 2026 to 2036
Table 250: GCC Rice Husk Ash Market Value (USD Billion) Forecast, by Application, 2026 to 2036
Table 251: GCC Rice Husk Ash Market Volume (Tons) Forecast, by End-use, 2026 to 2036
Table 252: GCC Rice Husk Ash Market Value (USD Billion) Forecast, by End-use 2026 to 2036
Table 253: South Africa Rice Husk Ash Market Volume (Tons) Forecast, by Form, 2026 to 2036
Table 254: South Africa Rice Husk Ash Market Value (USD Billion) Forecast, by Form, 2026 to 2036
Table 255: South Africa Rice Husk Ash Market Volume (Tons) Forecast, by Silica Content, 2026 to 2036
Table 256: South Africa Rice Husk Ash Market Value (USD Billion) Forecast, by Silica Content, 2026 to 2036
Table 257: South Africa Rice Husk Ash Market Volume (Tons) Forecast, by Function, 2026 to 2036
Table 258: South Africa Rice Husk Ash Market Value (USD Billion) Forecast, by Function, 2026 to 2036
Table 259: South Africa Rice Husk Ash Market Volume (Tons) Forecast, by Application, 2026 to 2036
Table 260: South Africa Rice Husk Ash Market Value (USD Billion) Forecast, by Application, 2026 to 2036
Table 261: South Africa Rice Husk Ash Market Volume (Tons) Forecast, by End-use, 2026 to 2036
Table 262: South Africa Rice Husk Ash Market Value (USD Billion) Forecast, by End-use 2026 to 2036
Table 263: Rest of Middle East & Africa Rice Husk Ash Market Volume (Tons) Forecast, by Form, 2026 to 2036
Table 264: Rest of Middle East & Africa Rice Husk Ash Market Value (USD Billion) Forecast, by Form, 2026 to 2036
Table 265: Rest of Middle East & Africa Rice Husk Ash Market Volume (Tons) Forecast, by Silica Content, 2026 to 2036
Table 266: Rest of Middle East & Africa Rice Husk Ash Market Value (USD Billion) Forecast, by Silica Content, 2026 to 2036
Table 267: Rest of Middle East & Africa Rice Husk Ash Market Volume (Tons) Forecast, by Function, 2026 to 2036
Table 268: Rest of Middle East & Africa Rice Husk Ash Market Value (USD Billion) Forecast, by Function, 2026 to 2036
Table 269: Rest of Middle East & Africa Rice Husk Ash Market Volume (Tons) Forecast, by Application, 2026 to 2036
Table 270: Rest of Middle East & Africa Rice Husk Ash Market Value (USD Billion) Forecast, by Application, 2026 to 2036
Table 271: Rest of Middle East & Africa Rice Husk Ash Market Volume (Tons) Forecast, by End-use, 2026 to 2036
Table 272: Rest of Middle East & Africa Rice Husk Ash Market Value (USD Billion) Forecast, by End-use 2026 to 2036
Figure 1: Global Rice Husk Ash Market Volume Share Analysis, by Form, 2025, 2029, and 2036
Figure 2: Global Rice Husk Ash Market Attractiveness, by Form
Figure 3: Global Rice Husk Ash Market Volume Share Analysis, by Silica Content, 2025, 2029, and 2036
Figure 4: Global Rice Husk Ash Market Attractiveness, by Silica Content
Figure 5: Global Rice Husk Ash Market Volume Share Analysis, by Function, 2025, 2029, and 2036
Figure 6: Global Rice Husk Ash Market Attractiveness, by Function
Figure 7: Global Rice Husk Ash Market Volume Share Analysis, by Application, 2025, 2029, and 2036
Figure 8: Global Rice Husk Ash Market Attractiveness, by Application
Figure 9: Global Rice Husk Ash Market Volume Share Analysis, by End-use, 2025, 2029, and 2036
Figure 10: Global Rice Husk Ash Market Attractiveness, by End-use
Figure 11: Global Rice Husk Ash Market Volume Share Analysis, by Region, 2025, 2029, and 2036
Figure 12: Global Rice Husk Ash Market Attractiveness, by Region
Figure 13: North America Rice Husk Ash Market Volume Share Analysis, by Form, 2025, 2029, and 2036
Figure 14: North America Rice Husk Ash Market Attractiveness, by Form
Figure 15: North America Rice Husk Ash Market Attractiveness, by Form
Figure 16: North America Rice Husk Ash Market Volume Share Analysis, by Silica Content, 2025, 2029, and 2036
Figure 17: North America Rice Husk Ash Market Attractiveness, by Silica Content
Figure 18: North America Rice Husk Ash Market Volume Share Analysis, by Function, 2025, 2029, and 2036
Figure 19: North America Rice Husk Ash Market Attractiveness, by Function
Figure 20: North America Rice Husk Ash Market Volume Share Analysis, by Application, 2025, 2029, and 2036
Figure 21: North America Rice Husk Ash Market Attractiveness, by Application
Figure 22: North America Rice Husk Ash Market Volume Share Analysis, by End-use, 2025, 2029, and 2036
Figure 23: North America Rice Husk Ash Market Attractiveness, by End-use
Figure 24: North America Rice Husk Ash Market Attractiveness, by Country and Sub-region
Figure 25: Europe Rice Husk Ash Market Volume Share Analysis, by Form, 2025, 2029, and 2036
Figure 26: Europe Rice Husk Ash Market Attractiveness, by Form
Figure 27: Europe Rice Husk Ash Market Volume Share Analysis, by Silica Content, 2025, 2029, and 2036
Figure 28: Europe Rice Husk Ash Market Attractiveness, by Silica Content
Figure 29: Europe Rice Husk Ash Market Volume Share Analysis, by Function, 2025, 2029, and 2036
Figure 30: Europe Rice Husk Ash Market Attractiveness, by Function
Figure 31: Europe Rice Husk Ash Market Volume Share Analysis, by Application, 2025, 2029, and 2036
Figure 32: Europe Rice Husk Ash Market Attractiveness, by Application
Figure 33: Europe Rice Husk Ash Market Volume Share Analysis, by End-use, 2025, 2029, and 2036
Figure 34: Europe Rice Husk Ash Market Attractiveness, by End-use
Figure 35: Europe Rice Husk Ash Market Volume Share Analysis, by Country and Sub-region, 2025, 2029, and 2036
Figure 36: Europe Rice Husk Ash Market Attractiveness, by Country and Sub-region
Figure 37: Asia Pacific Rice Husk Ash Market Volume Share Analysis, by Form, 2025, 2029, and 2036
Figure 38: Asia Pacific Rice Husk Ash Market Attractiveness, by Form
Figure 39: Asia Pacific Rice Husk Ash Market Volume Share Analysis, by Silica Content, 2025, 2029, and 2036
Figure 40: Asia Pacific Rice Husk Ash Market Attractiveness, by Silica Content
Figure 41: Asia Pacific Rice Husk Ash Market Volume Share Analysis, by Function, 2025, 2029, and 2036
Figure 42: Asia Pacific Rice Husk Ash Market Attractiveness, by Function
Figure 43: Asia Pacific Rice Husk Ash Market Volume Share Analysis, by Application, 2025, 2029, and 2036
Figure 44: Asia Pacific Rice Husk Ash Market Attractiveness, by Application
Figure 45: Asia Pacific Rice Husk Ash Market Volume Share Analysis, by End-use, 2025, 2029, and 2036
Figure 46: Asia Pacific Rice Husk Ash Market Attractiveness, by End-use
Figure 47: Asia Pacific Rice Husk Ash Market Volume Share Analysis, by Country and Sub-region, 2025, 2029, and 2036
Figure 48: Asia Pacific Rice Husk Ash Market Attractiveness, by Country and Sub-region
Figure 49: Latin America Rice Husk Ash Market Volume Share Analysis, by Form, 2025, 2029, and 2036
Figure 50: Latin America Rice Husk Ash Market Attractiveness, by Form
Figure 51: Latin America Rice Husk Ash Market Volume Share Analysis, by Silica Content, 2025, 2029, and 2036
Figure 52: Latin America Rice Husk Ash Market Attractiveness, by Silica Content
Figure 53: Latin America Rice Husk Ash Market Volume Share Analysis, by Function, 2025, 2029, and 2036
Figure 54: Latin America Rice Husk Ash Market Attractiveness, by Function
Figure 55: Latin America Rice Husk Ash Market Volume Share Analysis, by Application, 2025, 2029, and 2036
Figure 56: Latin America Rice Husk Ash Market Attractiveness, by Application
Figure 57: Latin America Rice Husk Ash Market Volume Share Analysis, by End-use, 2025, 2029, and 2036
Figure 58: Latin America Rice Husk Ash Market Attractiveness, by End-use
Figure 59: Latin America Rice Husk Ash Market Volume Share Analysis, by Country and Sub-region, 2025, 2029, and 2036
Figure 60: Latin America Rice Husk Ash Market Attractiveness, by Country and Sub-region
Figure 61: Middle East & Africa Rice Husk Ash Market Volume Share Analysis, by Form, 2025, 2029, and 2036
Figure 62: Middle East & Africa Rice Husk Ash Market Attractiveness, by Form
Figure 63: Middle East & Africa Rice Husk Ash Market Volume Share Analysis, by Silica Content, 2025, 2029, and 2036
Figure 64: Middle East & Africa Rice Husk Ash Market Attractiveness, by Silica Content
Figure 65: Middle East & Africa Rice Husk Ash Market Volume Share Analysis, by Function, 2025, 2029, and 2036
Figure 66: Middle East & Africa Rice Husk Ash Market Attractiveness, by Function
Figure 67: Middle East & Africa Rice Husk Ash Market Volume Share Analysis, by Application, 2025, 2029, and 2036
Figure 68: Middle East & Africa Rice Husk Ash Market Attractiveness, by Application
Figure 69: Middle East & Africa Rice Husk Ash Market Volume Share Analysis, by End-use, 2025, 2029, and 2036
Figure 70: Middle East & Africa Rice Husk Ash Market Attractiveness, by End-use
Figure 71: Middle East & Africa Rice Husk Ash Market Volume Share Analysis, by Country and Sub-region, 2025, 2029, and 2036
Figure 72: Middle East & Africa Rice Husk Ash Market Attractiveness, by Country and Sub-region
Copyright © Transparency Market Research, Inc. All Rights reserved
Trust Online


Rice Husk Ash Market
