
Reports
Reports
Analysts’ Viewpoint on RTC IC Market Scenario
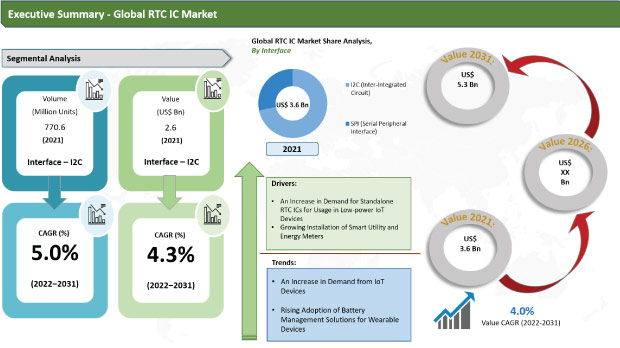
Growing use of RTC IC across wearable devices, computers, IoT devices, digital cameras, battery management units, and dashboards in the case of automotive applications is the key driver for the global RTC IC market. Technological advancements have prompted manufacturers to continuously introduce new features such as embedded memory, alarms, timestamp recording, and watchdog, among others. Rise in demand for low power applications is driving technological developments in real-time clock ICs, as keeping time is crucial for all IoT devices. In the absence of a main power source, having reliable information of event occurrences and communication time slots is accomplished with the use of either a small battery or a capacitor. Thus, RTC IC is widely deployed across range of devices, which is driving the global market.
A real-time clock IC (RTC IC) is an integrated circuit that keeps track of the current time and date, typically counting seconds, minutes, hours, days, months, and years with leap-year compensation. These ICs are available in 12 hour and 24-hour time format with AM/PM display. Real-time Clock (RTC) ICs are low current devices that can sustain for years on a single lithium cell. RTC IC runs on a battery that keeps tracking the time even it is disconnected from the main power.
Although the term often refers to the devices in personal computers, servers and embedded systems, RTCs are present in almost any electronic device which needs to keep the accurate time of day. RTC ICs are extensively used in several applications such as burglar alarm systems, gaming devices, e-metering, building access control, industrial applications, Point-of-Sale terminals, and numerous other applications in various industry verticals. Moreover, RTCs are frequently integrated into other devices, for instance, the broadband communications ICs used in car radios.
RTC IC plays an important role in IoT applications ranging from multi-core smartphones to small connected sensors. In these devices, power and accuracy are critical factors. The RTC ICs offers extended battery lifetime to the IoT devices, which is the fundamental requirement for all these devices. The standalone RTC ICs are designed to keep backup of capacitors by analyzing different parameters such as current consumption, minimum and maximum voltage supply. For instance, STMicroelectronics offers M41T62, a standalone RTC that keeps the time with a supply voltage as low as 1.0V and can tolerate voltages up to 4.5V.
Thus, rising demand for standalone RTC IC in low power IoT devices enabling businesses to minimize the manufacturing cost is projected to have a positive impact on the global real-time clock (RTC) IC market during the forecast period.
Electrification is a key issue in various countries of the world. This is expected to hinder the growth of industrial and construction sectors. Governments across various countries are undertaking several initiatives to meet future electricity demands, and concentrating on reducing carbon footprint by promoting the use of renewable energy sources to produce energy. Smart meters will play a significant role in achieving these initiatives. The increase in the acceptance of electric vehicles, development of micro grids, distributed energy storage, and the need for net metering are boosting the installation of smart utility and energy meters across the globe.
Smart Meter National Programme aims to replace 25 crore conventional meters with smart meters in India. Smart meters are connected through a web-based monitoring system, which will help to reduce commercial losses of utilities, enhance revenues and serve as an important tool in power sector reforms.
According to Tepco, in 2018 the U.S. had over 86 million smart meters installed. In 2017, there were 665 million smart meters installed globally. Revenue generation is expected to grow from $12.8 Bn in 2017 to $20 Bn by 2022.
As of 2018, the electrification rate in rural areas was less than 75% in various Asian countries such as Myanmar, Pakistan, North Korea, Bangladesh, and less than 50% in many African countries. Keeping accurate time in an energy meter is critical when billing is associated with the time of use. It is especially important when there is no constant communication between a meter and a reference clock. RTC ICs are mainly used in metering applications such as E-meter, heating counter, smart meters, PV counter, and utility metering, among others.
In terms of interface, the global RTC IC market is divided into I2C (Inter-Integrated Circuit) and SPI (Serial Peripheral Interface). The I2C (Inter-Integrated Circuit) segment held a large share of 71.68% in 2021 and will maintain the status quo with a growth rate of 4.3% during the forecast period.
I2C interface offers several benefits over SPI as I2 C-bus shrinks the IC footprint and leads to lower IC costs. In addition, far fewer copper traces are required for I2C, which enables a smaller PCB, reduced design complexity, and lowered system cost. I2C interface is a bus interface connection protocol incorporated into devices for serial communication; it is a most widely used protocol for short-distance communication.
RTC IC are classified into surface mount and through hole, in terms of their mounting type. The surface mount category dominated the global RTC IC market in 2021 with a market share of 86.45%. Furthermore, this segment is also expected to register the CAGR of 4.1% during the forecast period. This growth can be attributed to the substantial features offered by surface mounted RTC ICs. These circuits offer high accuracy time stamping and total reliability over wide temperature variations.
Surface-mount technology (SMT) is a method in which the electrical components are mounted directly onto the surface of a PCB. An electronics component mounted in this manner is referred to as a surface-mount device (SMD). In industry, this approach has largely replaced the through-hole technology construction method of fitting components, in large part, as SMT allows for increased manufacturing automation, which reduces cost and improves quality.
Asia Pacific held the largest share of 38.58% in 2021 in the global RTC IC market. Asia Pacific and North America are the major hubs of research and development activities in the field of technology and new product development market as large number of manufactures are based in these regions. Additionally, factors such as increased expenditure on industrial automation, and manufacturing consumer electronics devices across the globe offers growth opportunities to the real-time clock (RTC) IC manufacturers.
North America and Europe are also large consumers of RTC IC, which held value shares of 29.55% and 24.55% respectively in 2021 in the global market. This growth is due to the presence of several largest multinational corporations in these regions offers devices for end-users like consumer electronics, military and defense, automotive, and IT & telecom industry.
The Middle East and African region is also growing rapidly in RTC IC market and offers lucrative opportunities for the global suppliers of RTC IC. Rise in Internet penetration, growing adoption of smartphone and social media use, and increasing digitalization activities among the countries such as the United Arab Emirates, Bahrain, and Qatar have fueled the demand of consumer electronics devices and data center servers across the region. This factor anticipated to drive the market growth in the region.
The global RTC IC market is consolidated with a small number of large scale vendors controlling the majority of the market share. The majority of the companies are spending a significant amount of money on comprehensive research and development, primarily to develop environmentally friendly products. Expansion of product portfolios and mergers and acquisitions are the key strategies adopted by the key players. ABLIC Inc., Abracon, LLC, Diodes Incorporated, Maxim Integrated Inc., Microchip Technology Inc., Micro Crystal AG, NXP Semiconductors, Renesas Electronics Corporation, RICOH Electronic Devices Co., Ltd., ROHM CO., LTD., Seiko Epson Corp., STMicroelectronic, and Texas Instruments Incorporated, are the prominent entities operating in this market.
Each of these players has been profiled in the RTC IC market report based on parameters such as company overview, financial overview, business strategies, product portfolio, business segments, and recent developments.
|
Attribute |
Detail |
|
Market Size Value in 2021 |
US$ 3.5 Bn |
|
Market Forecast Value in 2031 |
US$ 5.2 Bn |
|
Growth Rate (CAGR) |
4% |
|
Forecast Period |
2022–2031 |
|
Historical Data Available for |
2017–2020 |
|
Quantitative Units |
US$ Mn for Value and Million Units for Volume |
|
Market Analysis |
It includes cross segment analysis at global as well as regional level. Furthermore, qualitative analysis includes drivers, restraints, opportunities, key trends, Porter’s Five Forces analysis, value chain analysis, and key trend analysis. |
|
Competition Landscape |
|
|
Format |
Electronic (PDF) + Excel |
|
Market Segmentation |
|
|
Regions Covered |
|
|
Countries Covered |
|
|
Companies Profiled |
|
|
Customization Scope |
Available upon request |
|
Pricing |
Available upon request |
The revenue of RTC IC stood over US$ 3.5 Bn in 2021
The RTC IC market is expected to grow at a CAGR of 4% by 2031
The market size for RTC IC market value more than US$ 5.2 Bn in 2031
Prominent players operating in the RTC IC market include ABLIC Inc., Abracon, LLC, Diodes Incorporated, Maxim Integrated Inc., Microchip Technology Inc., Micro Crystal AG, NXP Semiconductors, Renesas Electronics Corporation, RICOH Electronic Devices Co., Ltd., ROHM CO., LTD., Seiko Epson Corp., STMicroelectronic, and Texas Instruments Incorporated
In 2021, the U.S. catered approximately 21.9% of share of the RTC IC market
Based on interface, I2C (Inter-Integrated Circuit) segment is expected to hold 71.68% share of the RTC IC market
Increase in demand from IoT devices and rise in adoption of real-time clock ICs in wearable medical devices
Asia Pacific region is more lucrative in RTC IC market
1. Preface
1.1. Research Scope
1.2. RTC IC Market Overview
1.3. Market and Segments Definition
1.4. Market Taxonomy
1.5. Research Methodology
1.6. Assumption and Acronyms
2. Executive Summary
2.1. Global RTC IC Market Analysis and Forecast
2.2. Regional Outline
2.3. Market Dynamics Snapshot
2.4. Competition Blueprint
3. Market Dynamics
3.1. Macro-economic Factors
3.2. Key Market Indicator
3.3. Drivers
3.4. Market Restraints and Opportunities
3.5. Operating Voltages Trends
3.6. Market Trends
4. Associated Industry and Key Indicator Assessment
4.1. Parent Industry Overview
4.2. Supply Chain Analysis
4.3. Industry SWOT Analysis
4.4. Porter Five Forces Analysis
4.5. COVID-19 Impact Analysis
5. Global RTC IC Market Analysis, by Interface
5.1. Global RTC IC Market Size (US$ Mn) and Volume (Million Units) Analysis & Forecast, by Interface, 2017‒2031
5.1.1. I2C (Inter-Integrated Circuit)
5.1.2. SPI (Serial Peripheral Interface)
5.2. Global RTC IC Market Attractiveness Analysis, by Interface
6. Global RTC IC Market Analysis, by Mounting Type
6.1. Global RTC IC Market Size (US$ Mn) and Volume (Million Units) Analysis & Forecast, by Mounting Type, 2017‒2031
6.1.1. Surface Mount
6.1.2. Through Hole
6.2. Global RTC IC Market Attractiveness Analysis, by Mounting Type
7. Global RTC IC Market Analysis, by Operating Voltage
7.1. Global RTC IC Market Size (US$ Mn) and Volume (Million Units) Analysis & Forecast, by Operating Voltage, 2017‒2031
7.1.1. 1V – 2V
7.1.2. 2.1V – 3.5V
7.1.3. 3.6V – 6V
7.2. Global RTC IC Market Attractiveness Analysis, by Operating Voltage
8. Global RTC IC Market Analysis, by End-use Industry
8.1. Global RTC IC Market Size (US$ Mn) and Volume (Million Units) Analysis & Forecast, by End-use Industry, 2017‒2031
8.1.1. Energy & Utility
8.1.1.1. Smart Water Meters
8.1.1.2. Smart Energy Meters
8.1.1.3. Smart Gas Meters
8.1.1.4. Others
8.1.2. Consumer Electronics
8.1.2.1. Wearable Devices
8.1.2.2. Computing Devices
8.1.2.3. Smartphones
8.1.2.4. Others
8.1.3. Automotive
8.1.4. Industrial
8.1.5. IT & Telecommunication
8.1.6. Others (Aerospace & Defense, Healthcare, etc.)
8.2. Global RTC IC Market Attractiveness Analysis, by End-use Industry
9. Global RTC IC Market Analysis and Forecast, by Region
9.1. Global RTC IC Market Size (US$ Mn) and Volume (Million Units) Analysis & Forecast, by Region, 2017 – 2031
9.1.1. North America
9.1.2. Europe
9.1.3. Asia Pacific
9.1.4. Middle East & Africa
9.1.5. South America
9.2. Global RTC IC Market Attractiveness Analysis, by Region
10. North America RTC IC Market Analysis and Forecast
10.1. Market Snapshot
10.2. North America RTC IC Market Size (US$ Mn) and Volume (Million Units) Analysis & Forecast, by Interface, 2017‒2031
10.2.1. I2C (Inter-Integrated Circuit)
10.2.2. SPI (Serial Peripheral Interface)
10.3. North America RTC IC Market Size (US$ Mn) and Volume (Million Units) Analysis & Forecast, by Mounting Type, 2017‒2031
10.3.1. Surface Mount
10.3.2. Through Hole
10.4. North America RTC IC Market Size (US$ Mn) and Volume (Million Units) Analysis & Forecast, by Operating Voltage, 2017‒2031
10.4.1. 1V – 2V
10.4.2. 2.1V – 3.5V
10.4.3. 3.6V – 6V
10.5. North America RTC IC Market Size (US$ Mn) and Volume (Million Units) Analysis & Forecast, by End-use Industry, 2017‒2031
10.5.1. Energy & Utility
10.5.1.1. Smart Water Meters
10.5.1.2. Smart Energy Meters
10.5.1.3. Smart Gas Meters
10.5.1.4. Others
10.5.2. Consumer Electronics
10.5.2.1. Wearable Devices
10.5.2.2. Computing Devices
10.5.2.3. Smartphones
10.5.2.4. Others
10.5.3. Automotive
10.5.4. Industrial
10.5.5. IT & Telecommunication
10.5.6. Others (Aerospace & Defense, Healthcare, etc.)
10.6. North America RTC IC Market Size (US$ Mn) and Volume (Million Units) Analysis & Forecast, by Country & Sub-region, 2017 – 2031
10.6.1. U.S.
10.6.2. Canada
10.6.3. Rest of North America
10.7. North America RTC IC Market Attractiveness Analysis
10.7.1. By Interface
10.7.2. By Mounting Type
10.7.3. By Operating Voltage
10.7.4. By End-use Industry
10.7.5. By Country & Sub-region
11. Europe RTC IC Market Analysis and Forecast
11.1. Market Snapshot
11.2. Europe RTC IC Market Size (US$ Mn) and Volume (Million Units) Analysis & Forecast, by Interface, 2017‒2031
11.2.1. I2C (Inter-Integrated Circuit)
11.2.2. SPI (Serial Peripheral Interface)
11.3. Europe RTC IC Market Size (US$ Mn) and Volume (Million Units) Analysis & Forecast, by Mounting Type, 2017‒2031
11.3.1. Surface Mount
11.3.2. Through Hole
11.4. Europe RTC IC Market Size (US$ Mn) and Volume (Million Units) Analysis & Forecast, by Operating Voltage, 2017‒2031
11.4.1. 1V – 2V
11.4.2. 2.1V – 3.5V
11.4.3. 3.6V – 6V
11.5. Europe RTC IC Market Size (US$ Mn) and Volume (Million Units) Analysis & Forecast, by End-use Industry, 2017‒2031
11.5.1. Energy & Utility
11.5.1.1. Smart Water Meters
11.5.1.2. Smart Energy Meters
11.5.1.3. Smart Gas Meters
11.5.1.4. Others
11.5.2. Consumer Electronics
11.5.2.1. Wearable Devices
11.5.2.2. Computing Devices
11.5.2.3. Smartphones
11.5.2.4. Others
11.5.3. Automotive
11.5.4. Industrial
11.5.5. IT & Telecommunication
11.5.6. Others (Aerospace & Defense, Healthcare, etc.)
11.6. Europe RTC IC Market Size (US$ Mn) and Volume (Million Units) Analysis & Forecast, by Country & Sub-region, 2017‒2031
11.6.1. U.K.
11.6.2. Germany
11.6.3. France
11.6.4. Rest of Europe
11.7. Europe RTC IC Market Attractiveness Analysis
11.7.1. By Interface
11.7.2. By Mounting Type
11.7.3. By Operating Voltage
11.7.4. By End-use Industry
11.7.5. By Country & Sub-region
12. Asia Pacific RTC IC Market Analysis and Forecast
12.1. Market Snapshot
12.2. Asia Pacific RTC IC Market Size (US$ Mn) and Volume (Million Units) Analysis & Forecast, by Interface, 2017‒2031
12.2.1. I2C (Inter-Integrated Circuit)
12.2.2. SPI (Serial Peripheral Interface)
12.3. Asia Pacific RTC IC Market Size (US$ Mn) and Volume (Million Units) Analysis & Forecast, by Mounting Type, 2017‒2031
12.3.1. Surface Mount
12.3.2. Through Hole
12.4. Asia Pacific RTC IC Market Size (US$ Mn) and Volume (Million Units) Analysis & Forecast, by Operating Voltage, 2017‒2031
12.4.1. 1V – 2V
12.4.2. 2.1V – 3.5V
12.4.3. 3.6V – 6V
12.5. Asia Pacific RTC IC Market Size (US$ Mn) and Volume (Million Units) Analysis & Forecast, by End-use Industry, 2017‒2031
12.5.1. Energy & Utility
12.5.1.1. Smart Water Meters
12.5.1.2. Smart Energy Meters
12.5.1.3. Smart Gas Meters
12.5.1.4. Others
12.5.2. Consumer Electronics
12.5.2.1. Wearable Devices
12.5.2.2. Computing Devices
12.5.2.3. Smartphones
12.5.2.4. Others
12.5.3. Automotive
12.5.4. Industrial
12.5.5. IT & Telecommunication
12.5.6. Others (Aerospace & Defense, Healthcare, etc.)
12.6. Asia Pacific RTC IC Market Size (US$ Mn) and Volume (Million Units) Analysis & Forecast, by Country & Sub-region, 2017‒2031
12.6.1. China
12.6.2. India
12.6.3. Japan
12.6.4. South Korea
12.6.5. ASEAN
12.6.6. Rest of Asia Pacific
12.7. Asia Pacific RTC IC Market Attractiveness Analysis
12.7.1. By Interface
12.7.2. By Mounting Type
12.7.3. By End-use Industry
12.7.4. By Country & Sub-region
13. Middle East & Africa (MEA) RTC IC Market Analysis and Forecast
13.1. Market Snapshot
13.2. MEA RTC IC Market Size (US$ Mn) and Volume (Million Units) Analysis & Forecast, by Interface, 2017‒2031
13.2.1. I2C (Inter-Integrated Circuit)
13.2.2. SPI (Serial Peripheral Interface)
13.3. MEA RTC IC Market Size (US$ Mn) and Volume (Million Units) Analysis & Forecast, by Mounting Type, 2017‒2031
13.3.1. Surface Mount
13.3.2. Through Hole
13.4. MEA RTC IC Market Size (US$ Mn) and Volume (Million Units) Analysis & Forecast, by Operating Voltage, 2017‒2031
13.4.1. 1V – 2V
13.4.2. 2.1V – 3.5V
13.4.3. 3.6V – 6V
13.5. MEA RTC IC Market Size (US$ Mn) and Volume (Million Units) Analysis & Forecast, by End-use Industry, 2017‒2031
13.5.1. Energy & Utility
13.5.1.1. Smart Water Meters
13.5.1.2. Smart Energy Meters
13.5.1.3. Smart Gas Meters
13.5.1.4. Others
13.5.2. Consumer Electronics
13.5.2.1. Wearable Devices
13.5.2.2. Computing Devices
13.5.2.3. Smartphones
13.5.2.4. Others
13.5.3. Automotive
13.5.4. Industrial
13.5.5. IT & Telecommunication
13.5.6. Others (Aerospace & Defense, Healthcare, etc.)
13.6. MEA RTC IC Market Size (US$ Mn) and Volume (Million Units) Analysis & Forecast, by Country & Sub-region, 2017‒2031
13.6.1. GCC
13.6.2. South Africa
13.6.3. Rest of Middle East & Africa
13.7. MEA RTC IC Market Attractiveness Analysis
13.7.1. By Interface
13.7.2. By Mounting Type
13.7.3. By End-use Industry
13.7.4. By Country & Sub-region
14. South America RTC IC Market Analysis and Forecast
14.1. Market Snapshot
14.2. South America RTC IC Market Size (US$ Mn) and Volume (Million Units) Analysis & Forecast, by Interface, 2017‒2031
14.2.1. I2C (Inter-Integrated Circuit)
14.2.2. SPI (Serial Peripheral Interface)
14.3. South America RTC IC Market Size (US$ Mn) and Volume (Million Units) Analysis & Forecast, by Mounting Type, 2017‒2031
14.3.1. Surface Mount
14.3.2. Through Hole
14.4. South America RTC IC Market Size (US$ Mn) and Volume (Million Units) Analysis & Forecast, by Operating Voltage, 2017‒2031
14.4.1. 1V – 2V
14.4.2. 2.1V – 3.5V
14.4.3. 3.6V – 6V
14.5. South America RTC IC Market Size (US$ Mn) and Volume (Million Units) Analysis & Forecast, by End-use Industry, 2017‒2031
14.5.1. Energy & Utility
14.5.1.1. Smart Water Meters
14.5.1.2. Smart Energy Meters
14.5.1.3. Smart Gas Meters
14.5.1.4. Others
14.5.2. Consumer Electronics
14.5.2.1. Wearable Devices
14.5.2.2. Computing Devices
14.5.2.3. Smartphones
14.5.2.4. Others
14.5.3. Automotive
14.5.4. Industrial
14.5.5. IT & Telecommunication
14.5.6. Others (Aerospace & Defense, Healthcare, etc.)
14.6. South America RTC IC Market Size (US$ Mn) and Volume (Million Units) Analysis & Forecast, by Country & Sub-region, 2017‒2031
14.6.1. Brazil
14.6.2. Rest of South America
14.7. South America RTC IC Market Attractiveness Analysis
14.7.1. By Interface
14.7.2. By Mounting Type
14.7.3. By Operating Voltage
14.7.4. By End-use Industry
14.7.5. By Country & Sub-region
15. Competition Assessment
15.1. Global RTC IC Market Competition Matrix - a Dashboard View
15.2. Global RTC IC Market Company Share Analysis, by Value (2020)
15.3. Technological Differentiator
16. Company Profiles (Manufacturers/Suppliers)
16.1. ABLIC Inc.
16.1.1. Overview
16.1.2. Product Portfolio
16.1.3. Sales Footprint
16.1.4. Key Subsidiaries or Distributors
16.1.5. Strategy and Recent Developments
16.1.6. Key Financials
16.2. Abracon, LLC
16.2.1. Overview
16.2.2. Product Portfolio
16.2.3. Sales Footprint
16.2.4. Key Subsidiaries or Distributors
16.2.5. Strategy and Recent Developments
16.2.6. Key Financials
16.3. Diodes Incorporated
16.3.1. Overview
16.3.2. Product Portfolio
16.3.3. Sales Footprint
16.3.4. Key Subsidiaries or Distributors
16.3.5. Strategy and Recent Developments
16.3.6. Key Financials
16.4. Analog Devices, Inc. (Maxim)
16.4.1. Overview
16.4.2. Product Portfolio
16.4.3. Sales Footprint
16.4.4. Key Subsidiaries or Distributors
16.4.5. Strategy and Recent Developments
16.4.6. Key Financials
16.5. Microchip Technology Inc.
16.5.1. Overview
16.5.2. Product Portfolio
16.5.3. Sales Footprint
16.5.4. Key Subsidiaries or Distributors
16.5.5. Strategy and Recent Developments
16.5.6. Key Financials
16.6. Micro Crystal AG
16.6.1. Overview
16.6.2. Product Portfolio
16.6.3. Sales Footprint
16.6.4. Key Subsidiaries or Distributors
16.6.5. Strategy and Recent Developments
16.6.6. Key Financials
16.7. NXP Semiconductors
16.7.1. Overview
16.7.2. Product Portfolio
16.7.3. Sales Footprint
16.7.4. Key Subsidiaries or Distributors
16.7.5. Strategy and Recent Developments
16.7.6. Key Financials
16.8. Renesas Electronics Corporation
16.8.1. Overview
16.8.2. Product Portfolio
16.8.3. Sales Footprint
16.8.4. Key Subsidiaries or Distributors
16.8.5. Strategy and Recent Developments
16.8.6. Key Financials
16.9. RICOH Electronic Devices Co., Ltd.
16.9.1. Overview
16.9.2. Product Portfolio
16.9.3. Sales Footprint
16.9.4. Key Subsidiaries or Distributors
16.9.5. Strategy and Recent Developments
16.9.6. Key Financials
16.10. ROHM CO., LTD.
16.10.1. Overview
16.10.2. Product Portfolio
16.10.3. Sales Footprint
16.10.4. Key Subsidiaries or Distributors
16.10.5. Strategy and Recent Developments
16.10.6. Key Financials
16.11. Seiko Epson Corp.
16.11.1. Overview
16.11.2. Product Portfolio
16.11.3. Sales Footprint
16.11.4. Key Subsidiaries or Distributors
16.11.5. Strategy and Recent Developments
16.11.6. Key Financials
16.12. STMicroelectronic.
16.12.1. Overview
16.12.2. Product Portfolio
16.12.3. Sales Footprint
16.12.4. Key Subsidiaries or Distributors
16.12.5. Strategy and Recent Developments
16.12.6. Key Financials
16.13. Texas Instruments Incorporated
16.13.1. Overview
16.13.2. Product Portfolio
16.13.3. Sales Footprint
16.13.4. Key Subsidiaries or Distributors
16.13.5. Strategy and Recent Developments
16.13.6. Key Financials
17. Recommendation
17.1. Opportunity Assessment
17.1.1. By Interface
17.1.2. By Mounting Type
17.1.3. By Operating Voltage
17.1.4. By End-use Industry
17.1.5. By Region
List of Tables
Table 01: Global Real-time Clock (RTC) IC Market Size & Forecast, By Interface, Value (US$ Mn), 2017-2031
Table 02: Global Real-time Clock (RTC) IC Market Size & Forecast, by Interface, Volume (Million Units), 2017-2031
Table 03: Global Real-time Clock (RTC) IC Market Size & Forecast, By Mounting Type, Value (US$ Mn), 2017-2031
Table 04: Global Real-time Clock (RTC) IC Market Size & Forecast, by Mounting Type, Volume (Million Units), 2017-2031
Table 05: Global Real-time Clock (RTC) IC Market Size & Forecast, By Operating Voltage, Value (US$ Mn), 2017-2031
Table 06: Global Real-time Clock (RTC) IC Market Size & Forecast, By Operating Voltage, Volume (Million Units), 2017-2031
Table 07: Global Real-time Clock (RTC) IC Market Size & Forecast, By End-use Industry, Value (US$ Mn), 2017-2031
Table 08: Global Real-time Clock (RTC) IC Market Size & Forecast, By End-use Industry, Volume (Million Units), 2017-2031
Table 09: Global Real-time Clock (RTC) IC Market Size & Forecast, By Region, Value (US$ Mn), 2017-2031
Table 10: Global Real-time Clock (RTC) IC Market Size & Forecast, By Region, Volume (Million Units), 2017-2031
Table 11: North America Real-time Clock (RTC) IC Market Size & Forecast, By Interface, Value (US$ Mn), 2017-2031
Table 12: North America Real-time Clock (RTC) IC Market Size & Forecast, by Interface, Volume (Million Units), 2017-2031
Table 13: North America Real-time Clock (RTC) IC Market Size & Forecast, By Mounting Type, Value (US$ Mn), 2017-2031
Table 14: North America Real-time Clock (RTC) IC Market Size & Forecast, by Mounting Type, Volume (Million Units), 2017-2031
Table 15: North America Real-time Clock (RTC) IC Market Size & Forecast, By Operating Voltage, Value (US$ Mn), 2017-2031
Table 16: North America Real-time Clock (RTC) IC Market Size & Forecast, By Operating Voltage, Volume (Million Units), 2017-2031
Table 17: North America Real-time Clock (RTC) IC Market Size & Forecast, By End-use Industry, Value (US$ Mn), 2017-2031
Table 18: North America Real-time Clock (RTC) IC Market Size & Forecast, By End-use Industry, Volume (Million Units), 2017-2031
Table 19: North America Real-time Clock (RTC) IC Market Size & Forecast, By Country, Value (US$ Mn), 2017-2031
Table 20: North America Real-time Clock (RTC) IC Market Size & Forecast, By Country, Volume (Million Units), 2017-2031
Table 21: Europe Real-time Clock (RTC) IC Market Size & Forecast, By Interface, Value (US$ Mn), 2017-2031
Table 22: Europe Real-time Clock (RTC) IC Market Size & Forecast, by Interface, Volume (Million Units), 2017-2031
Table 23: Europe Real-time Clock (RTC) IC Market Size & Forecast, By Mounting Type, Value (US$ Mn), 2017-2031
Table 24: Europe Real-time Clock (RTC) IC Market Size & Forecast, by Mounting Type, Volume (Million Units), 2017-2031
Table 25: Europe Real-time Clock (RTC) IC Market Size & Forecast, By Operating Voltage, Value (US$ Mn), 2017-2031
Table 26: Europe Real-time Clock (RTC) IC Market Size & Forecast, By Operating Voltage, Volume (Million Units), 2017-2031
Table 27: Europe Real-time Clock (RTC) IC Market Size & Forecast, By End-use Industry, Value (US$ Mn), 2017-2031
Table 28: Europe Real-time Clock (RTC) IC Market Size & Forecast, By End-use Industry, Volume (Million Units), 2017-2031
Table 29: Europe Real-time Clock (RTC) IC Market Size & Forecast, By Country, Value (US$ Mn), 2017-2031
Table 30: Europe Real-time Clock (RTC) IC Market Size & Forecast, By Country, Volume (Million Units), 2017-2031
Table 31: Asia Pacific Real-time Clock (RTC) IC Market Size & Forecast, By Interface, Value (US$ Mn), 2017-2031
Table 32: Asia Pacific Real-time Clock (RTC) IC Market Size & Forecast, by Interface, Volume (Million Units), 2017-2031
Table 33: Asia Pacific Real-time Clock (RTC) IC Market Size & Forecast, By Mounting Type, Value (US$ Mn), 2017-2031
Table 34: Asia Pacific Real-time Clock (RTC) IC Market Size & Forecast, by Mounting Type, Volume (Million Units), 2017-2031
Table 35: Asia Pacific Real-time Clock (RTC) IC Market Size & Forecast, By Operating Voltage, Value (US$ Mn), 2017-2031
Table 36: Asia Pacific Real-time Clock (RTC) IC Market Size & Forecast, By Operating Voltage, Volume (Million Units), 2017-2031
Table 37: Asia Pacific Real-time Clock (RTC) IC Market Size & Forecast, By End-use Industry, Value (US$ Mn), 2017-2031
Table 38: Asia Pacific Real-time Clock (RTC) IC Market Size & Forecast, By End-use Industry, Volume (Million Units), 2017-2031
Table 39: Asia Pacific Real-time Clock (RTC) IC Market Size & Forecast, By Country, Value (US$ Mn), 2017-2031
Table 40: Asia Pacific Real-time Clock (RTC) IC Market Size & Forecast, By Country, Volume (Million Units), 2017-2031
Table 41: Middle East and Africa Real-time Clock (RTC) IC Market Size & Forecast, By Interface, Value (US$ Mn), 2017-2031
Table 42: Middle East and Africa Real-time Clock (RTC) IC Market Size & Forecast, by Interface, Volume (Million Units), 2017-2031
Table 43: Middle East and Africa Real-time Clock (RTC) IC Market Size & Forecast, By Mounting Type, Value (US$ Mn), 2017-2031
Table 44: Middle East and Africa Real-time Clock (RTC) IC Market Size & Forecast, by Mounting Type, Volume (Million Units), 2017-2031
Table 45: Middle East and Africa Real-time Clock (RTC) IC Market Size & Forecast, By Operating Voltage, Value (US$ Mn), 2017-2031
Table 46: Middle East and Africa Real-time Clock (RTC) IC Market Size & Forecast, By Operating Voltage, Volume (Million Units), 2017-2031
Table 47: Middle East and Africa Real-time Clock (RTC) IC Market Size & Forecast, By End-use Industry, Value (US$ Mn), 2017-2031
Table 48: Middle East and Africa Real-time Clock (RTC) IC Market Size & Forecast, By End-use Industry, Volume (Million Units), 2017-2031
Table 49: Middle East & Africa (MEA) Real-time Clock (RTC) IC Market Size & Forecast, By Country, Value (US$ Mn), 2017-2031
Table 50: Middle East & Africa (MEA) Real-time Clock (RTC) IC Market Size & Forecast, By Country, Volume (Million Units), 2017-2031
Table 51: South America Real-time Clock (RTC) IC Market Size & Forecast, By Interface, Value (US$ Mn), 2017-2031
Table 52: South America Real-time Clock (RTC) IC Market Size & Forecast, by Interface, Volume (Million Units), 2017-2031
Table 53: South America Real-time Clock (RTC) IC Market Size & Forecast, By Mounting Type, Value (US$ Mn), 2017-2031
Table 54: South America Real-time Clock (RTC) IC Market Size & Forecast, by Mounting Type, Volume (Million Units), 2017-2031
Table 55: South America Real-time Clock (RTC) IC Market Size & Forecast, By Operating Voltage, Value (US$ Mn), 2017-2031
Table 56: South America Real-time Clock (RTC) IC Market Size & Forecast, By Operating Voltage, Volume (Million Units), 2017-2031
Table 57: South America Real-time Clock (RTC) IC Market Size & Forecast, By End-use Industry, Value (US$ Mn), 2017-2031
Table 58: South America Real-time Clock (RTC) IC Market Size & Forecast, By End-use Industry, Volume (Million Units), 2017-2031
Table 59: South America Real-time Clock (RTC) IC Market Size & Forecast, By Country, Value (US$ Mn), 2017-2031
Table 60: South America Real-time Clock (RTC) IC Market Size & Forecast, By Country, Volume (Million Units), 2017-2031
List of Figures
Figure 01: Global Real-time Clock (RTC) IC Market Size & Forecast, Value (US$ Mn ), 2017-2031
Figure 02: Global Real-time Clock (RTC) IC Market Size & Forecast, Volume (Million Units), 2017-2031
Figure 03: Global Real-time Clock (RTC) IC Market, Y-o-Y, 2017-2031
Figure 04: Global Real-time Clock (RTC) IC Price Trend, 2017-2031
Figure 05: Global Real-time Clock (RTC) IC Market Size & Forecast, By Interface, Revenue (US$ Mn), 2017-2031
Figure 06: Global Real-time Clock (RTC) IC Market Attractiveness, By Interface, Value (US$ Mn), 2021-2031
Figure 07: Global Real-time Clock (RTC) IC Market Share Analysis, by Interface, 2021 and 2031
Figure 08: Global Real-time Clock (RTC) IC Market Size & Forecast, By Mounting Type, Revenue (US$ Mn), 2017-2031
Figure 09: Global Real-time Clock (RTC) IC Market Attractiveness, By Mounting Type, Value (US$ Mn), 2021-2031
Figure 10: Global Real-time Clock (RTC) IC Market Share Analysis, by Mounting Type, 2021 and 2031
Figure 11: Global Real-time Clock (RTC) IC Market Size & Forecast, By Operating Voltage, Revenue (US$ Mn), 2017-2031
Figure 12: Global Real-time Clock (RTC) IC Market Attractiveness, By Operating Voltage, Value (US$ Mn), 2021-2031
Figure 13: Global Real-time Clock (RTC) IC Market Share Analysis, by Operating Voltage, 2021 and 2031
Figure 14: Global Real-time Clock (RTC) IC Market Size & Forecast, By End-use Industry, Revenue (US$ Mn), 2017-2031
Figure 15: Global Real-time Clock (RTC) IC Market Attractiveness, By End-use Industry, Value (US$ Mn), 2021-2031
Figure 16: Global Real-time Clock (RTC) IC Market Share Analysis, by End-use Industry, 2021 and 2031
Figure 17: Global Real-time Clock (RTC) IC Market Size & Forecast, By Region, Revenue (US$ Mn), 2017-2031
Figure 18: Global Real-time Clock (RTC) IC Market Attractiveness, By Region, Value (US$ Mn), 2021-2031
Figure 19: Global Real-time Clock (RTC) IC Market Share Analysis, by Region, 2021 and 2031
Figure 20: North America Real-time Clock (RTC) IC Market Size & Forecast, Value (US$ Mn ), 2017-2031
Figure 21: North America Real-time Clock (RTC) IC Market Size & Forecast, Volume (Million Units), 2017-2031
Figure 22: North America Real-time Clock (RTC) IC Market, Value (US$ Mn), 2017-2031
Figure 23: North America Real-time Clock (RTC) IC Price Trend, 2017-2031
Figure 24: North America Real-time Clock (RTC) IC Market Size & Forecast, By Interface, Revenue (US$ Mn), 2017-2031
Figure 25: North America Real-time Clock (RTC) IC Market Attractiveness, By Interface, Value (US$ Mn), 2021-2031
Figure 26: North America Real-time Clock (RTC) IC Market Share Analysis, by Interface, 2021 and 2031
Figure 27: North America Real-time Clock (RTC) IC Market Size & Forecast, By Mounting Type, Revenue (US$ Mn), 2017-2031
Figure 28: North America Real-time Clock (RTC) IC Market Attractiveness, By Mounting Type, Value (US$ Mn), 2021-2031
Figure 29: North America Real-time Clock (RTC) IC Market Share Analysis, by Mounting Type, 2021 and 2031
Figure 30: North America Real-time Clock (RTC) IC Market Size & Forecast, By Operating Voltage, Revenue (US$ Mn), 2017-2031
Figure 31: North America Real-time Clock (RTC) IC Market Attractiveness, By Operating Voltage, Value (US$ Mn), 2021-2031
Figure 32: North America Real-time Clock (RTC) IC Market Share Analysis, by Operating Voltage, 2021 and 2031
Figure 33: North America Real-time Clock (RTC) IC Market Size & Forecast, By End-use Industry, Revenue (US$ Mn), 2017-2031
Figure 34: North America Real-time Clock (RTC) IC Market Attractiveness, By End-use Industry, Value (US$ Mn), 2021-2031
Figure 35: North America Real-time Clock (RTC) IC Market Share Analysis, by End-use Industry, 2021 and 2031
Figure 36: North America Real-time Clock (RTC) IC Market Size & Forecast, By Country, Revenue (US$ Mn), 2017-2031
Figure 37: North America Real-time Clock (RTC) IC Market Attractiveness, By Country, Value (US$ Mn), 2021-2031
Figure 38: North America Real-time Clock (RTC) IC Market Share Analysis, by Country, 2021 and 2031
Figure 39: Europe Real-time Clock (RTC) IC Market Size & Forecast, Value (US$ Mn ), 2017-2031
Figure 40: Europe Real-time Clock (RTC) IC Market Size & Forecast, Volume (Million Units), 2017-2031
Figure 41: Europe Real-time Clock (RTC) IC Market, Y-o-Y, 2017-2031
Figure 42: Europe Real-time Clock (RTC) IC Price Trend, 2017-2031
Figure 43: Europe Real-time Clock (RTC) IC Market Size & Forecast, By Interface, Revenue (US$ Mn), 2017-2031
Figure 44: Europe Real-time Clock (RTC) IC Market Attractiveness, By Interface, Value (US$ Mn), 2021-2031
Figure 45: Europe Real-time Clock (RTC) IC Market Share Analysis, by Interface, 2021 and 2031
Figure 46: Europe Real-time Clock (RTC) IC Market Size & Forecast, By Mounting Type, Revenue (US$ Mn), 2017-2031
Figure 47: Europe Real-time Clock (RTC) IC Market Attractiveness, By Mounting Type, Value (US$ Mn), 2021-2031
Figure 48: Europe Real-time Clock (RTC) IC Market Share Analysis, by Mounting Type, 2021 and 2031
Figure 49: Europe Real-time Clock (RTC) IC Market Size & Forecast, By Operating Voltage, Revenue (US$ Mn), 2017-2031
Figure 50: Europe Real-time Clock (RTC) IC Market Attractiveness, By Operating Voltage, Value (US$ Mn), 2021-2031
Figure 51: Europe Real-time Clock (RTC) IC Market Share Analysis, by Operating Voltage, 2021 and 2031
Figure 52: Europe Real-time Clock (RTC) IC Market Size & Forecast, By End-use Industry, Revenue (US$ Mn), 2017-2031
Figure 53: Europe Real-time Clock (RTC) IC Market Attractiveness, By End-use Industry, Value (US$ Mn), 2021-2031
Figure 54: Europe Real-time Clock (RTC) IC Market Share Analysis, by End-use Industry, 2021 and 2031
Figure 55: Europe Real-time Clock (RTC) IC Market Size & Forecast, By Country, Revenue (US$ Mn), 2017-2031
Figure 56: Europe Real-time Clock (RTC) IC Market Attractiveness, By Country, Value (US$ Mn), 2021-2031
Figure 57: Europe Real-time Clock (RTC) IC Market Share Analysis, by Country, 2021 and 2031
Figure 58: Asia Pacific Real-time Clock (RTC) IC Market Size & Forecast, Value (US$ Mn ), 2017-2031
Figure 59: Asia Pacific Real-time Clock (RTC) IC Market Size & Forecast, Volume (Million Units), 2017-2031
Figure 60: Asia Pacific Real-time Clock (RTC) IC Market, Y-o-Y, 2017-2031
Figure 61: Asia Pacific Real-time Clock (RTC) IC Price Trend, 2017-2031
Figure 62: Asia Pacific Real-time Clock (RTC) IC Market Size & Forecast, By Interface, Revenue (US$ Mn), 2017-2031
Figure 63: Asia Pacific Real-time Clock (RTC) IC Market Attractiveness, By Interface, Value (US$ Mn), 2021-2031
Figure 64: Asia Pacific Real-time Clock (RTC) IC Market Share Analysis, by Interface, 2021 and 2031
Figure 65: Asia Pacific Real-time Clock (RTC) IC Market Size & Forecast, By Mounting Type, Revenue (US$ Mn), 2017-2031
Figure 66: Asia Pacific Real-time Clock (RTC) IC Market Attractiveness, By Mounting Type, Value (US$ Mn), 2021-2031
Figure 67: Asia Pacific Real-time Clock (RTC) IC Market Share Analysis, by Mounting Type, 2021 and 2031
Figure 68: Asia Pacific Real-time Clock (RTC) IC Market Size & Forecast, By Operating Voltage, Revenue (US$ Mn), 2017-2031
Figure 69: Asia Pacific Real-time Clock (RTC) IC Market Attractiveness, By Operating Voltage, Value (US$ Mn), 2021-2031
Figure 70: Asia Pacific Real-time Clock (RTC) IC Market Share Analysis, by Operating Voltage, 2021 and 2031
Figure 71: Asia Pacific Real-time Clock (RTC) IC Market Size & Forecast, By End-use Industry, Revenue (US$ Mn), 2017-2031
Figure 72: Asia Pacific Real-time Clock (RTC) IC Market Attractiveness, By End-use Industry, Value (US$ Mn), 2021-2031
Figure 73: Asia Pacific Real-time Clock (RTC) IC Market Share Analysis, by End-use Industry, 2021 and 2031
Figure 74: Asia Pacific Real-time Clock (RTC) IC Market Size & Forecast, By Country, Revenue (US$ Mn), 2017-2031
Figure 75: Asia Pacific Real-time Clock (RTC) IC Market Attractiveness, By Country, Value (US$ Mn), 2021-2031
Figure 76: Asia Pacific Real-time Clock (RTC) IC Market Share Analysis, by Country, 2021 and 2031
Figure 77: Middle East and Africa Real-time Clock (RTC) IC Market Size & Forecast, Value (US$ Mn ), 2017-2031
Figure 78: Middle East and Africa Real-time Clock (RTC) IC Market Size & Forecast, Volume (Million Units), 2017-2031
Figure 79: Middle East and Africa Real-time Clock (RTC) IC Market, Y-o-Y, 2017-2031
Figure 80: Middle East and Africa Real-time Clock (RTC) IC Price Trend, 2017-2031
Figure 81: Middle East and Africa Real-time Clock (RTC) IC Market Size & Forecast, By Interface, Revenue (US$ Mn), 2017-2031
Figure 82: Middle East and Africa Real-time Clock (RTC) IC Market Attractiveness, By Interface, Value (US$ Mn), 2021-2031
Figure 83: Middle East and Africa Real-time Clock (RTC) IC Market Share Analysis, by Interface, 2021 and 2031
Figure 84: Middle East and Africa Real-time Clock (RTC) IC Market Size & Forecast, By Mounting Type, Revenue (US$ Mn), 2017-2031
Figure 85: Middle East and Africa Real-time Clock (RTC) IC Market Attractiveness, By Mounting Type, Value (US$ Mn), 2021-2031
Figure 86: Middle East and Africa Real-time Clock (RTC) IC Market Share Analysis, by Mounting Type, 2021 and 2031
Figure 87: Middle East and Africa Real-time Clock (RTC) IC Market Size & Forecast, By Operating Voltage, Revenue (US$ Mn), 2017-2031
Figure 88: Middle East and Africa Real-time Clock (RTC) IC Market Attractiveness, By Operating Voltage, Value (US$ Mn), 2021-2031
Figure 89: Middle East and Africa Real-time Clock (RTC) IC Market Share Analysis, by Operating Voltage, 2021 and 2031
Figure 90: Middle East and Africa Real-time Clock (RTC) IC Market Size & Forecast, By End-use Industry, Revenue (US$ Mn), 2017-2031
Figure 91: Middle East and Africa Real-time Clock (RTC) IC Market Attractiveness, By End-use Industry, Value (US$ Mn), 2021-2031
Figure 92: Middle East and Africa Real-time Clock (RTC) IC Market Share Analysis, by End-use Industry, 2021 and 2031
Figure 93: Middle East and Africa Real-time Clock (RTC) IC Market Size & Forecast, By Country, Revenue (US$ Mn), 2017-2031
Figure 94: Middle East and Africa Real-time Clock (RTC) IC Market Attractiveness, By Country, Value (US$ Mn), 2021-2031
Figure 95: Middle East and Africa Real-time Clock (RTC) IC Market Share Analysis, by Country, 2021 and 2031
Figure 96: South America Real-time Clock (RTC) IC Market Size & Forecast, Value (US$ Mn ), 2017-2031
Figure 97: South America Real-time Clock (RTC) IC Market Size & Forecast, Volume (Million Units), 2017-2031
Figure 98: South America Real-time Clock (RTC) IC Market, Value (US$ Mn), 2017-2031
Figure 99: South Africa Real-time Clock (RTC) IC Price Trend, 2017-2031
Figure 100: South America Real-time Clock (RTC) IC Market Size & Forecast, By Interface, Revenue (US$ Mn), 2017-2031
Figure 101: South America Real-time Clock (RTC) IC Market Attractiveness, By Interface, Value (US$ Mn), 2021-2031
Figure 102: South America Real-time Clock (RTC) IC Market Share Analysis, by Interface, 2021 and 2031
Figure 103: South America Real-time Clock (RTC) IC Market Size & Forecast, By Mounting Type, Revenue (US$ Mn), 2017-2031
Figure 104: South America Real-time Clock (RTC) IC Market Attractiveness, By Mounting Type, Value (US$ Mn), 2021-2031
Figure 105: South America Real-time Clock (RTC) IC Market Share Analysis, by Mounting Type, 2021 and 2031
Figure 106: South America Real-time Clock (RTC) IC Market Size & Forecast, By Operating Voltage, Revenue (US$ Mn), 2017-2031
Figure 107: South America Real-time Clock (RTC) IC Market Attractiveness, By Operating Voltage, Value (US$ Mn), 2021-2031
Figure 108: South America Real-time Clock (RTC) IC Market Share Analysis, by Operating Voltage, 2021 and 2031
Figure 109: South America Real-time Clock (RTC) IC Market Size & Forecast, By End-use Industry, Revenue (US$ Mn), 2017-2031
Figure 110: South America Real-time Clock (RTC) IC Market Attractiveness, By End-use Industry, Value (US$ Mn), 2021-2031
Figure 111: South America Real-time Clock (RTC) IC Market Share Analysis, by End-use Industry, 2021 and 2031
Figure 112: South America Real-time Clock (RTC) IC Market Size & Forecast, By Country, Revenue (US$ Mn), 2017-2031
Figure 113: South America Real-time Clock (RTC) IC Market Attractiveness, By Country, Value (US$ Mn), 2021-2031
Figure 114: South America Real-time Clock (RTC) IC Market Share Analysis, by Country, 2021 and 2031
Copyright © Transparency Market Research, Inc. All Rights reserved
Trust Online

RTC (Real-time Clock) IC Market