
Reports
Reports
Analysts’ Viewpoint on Protective Cases Market Scenario
The global protective cases market is anticipated to witnessing moderate growth during the forecast period. Rising demand for cases among end-users and consumer preference for innovative designs developed by manufacturers are key protective cases market drivers. With its wide-ranging selection of accessories, a mobile phone is highly influential in determining the lifestyle and behavior of a consumer. Furthermore, decline in prices of data & internet services and discounts on cellphone cases had a substantial influence on consumer behavior. This, in turn, has encouraged consumers to spend more on mobile accessories, leading to a surge in sales of protective cases. The availability of smartphones in a
wide range of price bands drives the sales of smartphones globally, and the accessible combination of price and design adds extra impetus to the protective cases market. Leading competitors in this sector need to focus on maintaining quality, develop various sizes, and also embrace printability features to offer the most effective possible product and enhance their market share.
Increasing usage of mobile phones, laptops, cameras, and other electronic devices and their growing importance in everyday life has meant that protecting these equipment is imperative. Protective cases are generally used to protect equipment from scratches or damage. Thus, it's all too often sensible to invest in durable cases, which is likely to increase the sales of protective cases and consequently, boost the protective cases market outlook during the forecast period. Thus, it. Furthermore, the protective cases market demand analysis reveals a significant incremental opportunity and expansion of the market at a notable growth rate between 2022 and 2030.
The pandemic caused various sectors in the packaging industry to experience substantial challenges. The same was faced by the protective cases market. Challenges in supply and movement of goods and economic conditions around the world compelled consumers to curb unnecessary expenses. Manufacturers also had to face issues as production volume reduced due to a decline in demand, which proved to be one of the key protective cases market restraints.
Nevertheless, a rise in the demand for protection of electronic and medical equipment significantly propelled the demand for protective cases. Extensive protective cases market sales analysis revealed that demand through online distribution channels and e-commerce sites increased considerably, which also had a positive impact on the market. Thus, post-pandemic, the protective cases market is expected to grow significantly by 2030, owing to a rise in the demand for protection of equipment in various end-use industries.
Protective cases add style and character to the overall appearance of mobile devices and mobile electronics. Unique and exclusive case designs offer an enhanced user experience, making it more comfortable. Currently, protective cases are available in various colors and appeal to consumers with their trendy designs. However, the visual appeal of the protective cases due to new printing technologies and design innovations has boosted the protective cases market growth forecast.
A strong smartphone case is a tough, protective outer layer that can help shield it from harm. G-Form, known for its technical excellence, has released a line of rugged iPhone cases titled G-Form. These cases have passed drop tests from heights that no other case has achieved. For instance, the company tested its Extreme iPhone Cases from 100,000 feet above the Earth and found they withstood all that was thrown at them except the extreme cold of that altitude. Increase in sales of mobile devices has fuelled the demand for rugged cases for iPhone users in the U.S. Thus, high strength and durability offered by protective cases such fuel their demand among smartphone users.
An extensive protective cases market competition analysis revealed that manufacturers are focusing on high level of innovation to offer new features or launch new products in order to stand out from all the competition. Increasing R&D has prompted manufacturing units to innovate and create various designs and customization options for cases. Concerns about transporting equipment necessary for national defense have made it essential to develop protective cases for such equipment. Consequently, customization of cases is creating significant opportunities for protective cases market.
India and China are estimated to account for contribute around 65% of the Asia Pacific protective cases market. Assessment of the protective cases market scenario in the region reveals that China is expected to be a rapidly growing market, followed by India. Rules and regulations in these countries are also business-friendly and more adaptive, and competition in these countries is less compared to other countries. China and India are expected to remain dominant markets owing to the high demand for keeping equipment safe from any damage.
A medical protective case is a giant medical box, designed specifically for physicians and nurses who carry important medical instruments and materials while visiting patients. Selecting suitable protective cases is estimated to cater to the needs of busy health professionals conducting home visits. Protective cases are integrated safety equipment that reduce the risk of sharp medical equipment falling onto healthcare workers and patients, which may lead cuts or injuries. Protective cases are important for safety measures in order to prevent such injuries. Therefore, an increase in demand for surgical tools propels the protective cases market.
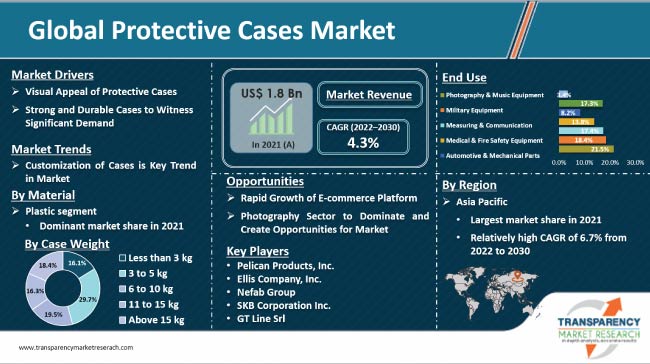
In terms of material, the polyethylene (PE) sub-segment is projected to hold a majority share of the plastic segment of the market. It is anticipated to register a CAGR of 4.9% during the forecast period. PE possesses several beneficial properties such as low density and linear low density. Another benefit of polyethylene is that it is available at the lowest cost to manufacturers. Demand for the usage of recycled low-density polyethylene (LDPE) in the production of protection cases and the protective packaging market is increasing, which in turn is estimated to boost the plastic segment of the market. As per TMR analysis, the polyethylene sub-segment is anticipated to reach a value of US$ 513 Mn by 2030.
In terms of end-use, the photography segment is estimated to account for around 20% share of the total market by the end of 2030. Rising penetration of social media and advances in smartphone features and technologies has driven the popularity of photography across the globe. However, the evolution of advanced photography & music equipment has also fueled the demand for protective cases.
Asia Pacific is expected to a prominent market, globally, and it is estimated to advance at a CAGR of 6.7% during the forecast period. The region is anticipated to hold approximately 26% share of the global market, in terms of value, by the end of the forecast period.
Asia Pacific attracts a majority of the manufacturers due to the low production cost and low raw material cost in the region. Furthermore, expansion of the e-commerce sector in Asia Pacific drives the demand for protective cases in the region.
The protective cases market in North America and Europe is expected to witness moderate growth owing to the high usage of various equipment and developed military sector in these regions.
The protective cases market report includes information about key players operating in the global protective cases market. Leading players analyzed in the protective cases market include Pelican Products, Inc., SKB Corporation, Inc., Parat Beteiligungs GmbH, Nefab Group, Zarges GmbH, C.H. Ellis Company Inc., GT Line Srl, Gemstar Manufacturing, and SuproBox.
Each of these players has been profiled in the protective cases market report based on parameters such as financial overview, company overview, application portfolio, business strategies, business segments, and recent developments.
|
Attribute |
Detail |
|
Market Size Value in 2021 |
US$ 1.8 Bn |
|
Market Forecast Value in 2030 |
US$ 2.7 Bn |
|
Growth Rate (CAGR) |
4.3% |
|
Forecast Period |
2022–2030 |
|
Quantitative Units |
US$ Mn for Value |
|
Market Analysis |
It includes global as well as regional level. Moreover, qualitative analysis includes drivers, restraints, opportunities, key trends, and parent industry overview. |
|
Competition Landscape |
|
|
Format |
Electronic (PDF) + Excel |
|
Market Segmentation |
|
|
Regions Covered |
|
|
Countries Covered |
|
|
Companies Profiled |
|
|
Customization Scope |
Available upon request |
|
Pricing |
Available upon request |
The global protective cases market was valued at US$ 1.8 Bn in 2021
The global protective cases market is anticipated to grow at a CAGR of 4.3% during the forecast period.
The global protective cases market is projected to reach US$ 2.7 Bn by the end of 2030
Plastic is estimated to remain the leading material segment of the global protective cases market during the forecast period
Surge in demand for safe storage & transportation of various equipment & devices
Pelican Products, Inc., Ellis Company, Inc., Nefab Group, SKB Corporation Inc., and GT Line Srl.
protective cases market in India is projected grow at a CAGR of 7.9% from 2022 to 2030
1. Executive Summary
1.1. Market Overview
1.2. Market Analysis
1.3. TMR Analysis and Recommendations
2. Market Viewpoint
2.1. Market Definition
2.2. Market Taxonomy
3. Protective Cases Market Overview
3.1. Introduction
3.2. Global Protective Cases Market Overview
3.3. Protective Cases Market (US$ Mn) and Forecast
3.4. Value Chain Analysis
3.4.1. Exhaustive List of Active Participants
3.4.1.1. Raw Material Suppliers
3.4.1.2. Protective Cases Manufacturers
3.4.1.3. End-users
3.4.2. Profitability Margins
3.5. Macro-economic Factors – Correlation Analysis
3.6. Forecast Factors – Relevance & Impact
4. Impact of COVID-19
4.1. Current Statistics and Probable Future Impact
4.2. Impact of COVID-19 on Target Market
5. Protective Cases Market Analysis
5.1. Pricing Analysis
5.1.1. Pricing Assumption
5.1.2. Price Projections By Region
5.2. Market Size (US$ Mn) and Forecast
5.2.1. Market Size and Y-o-Y Growth
5.2.2. Absolute $ Opportunity
6. Protective Cases Market Dynamics
6.1. Drivers
6.2. Restraints
6.3. Opportunity Analysis
6.4. Trends
7. Global Protective Cases Market Analysis and Forecast, by Material
7.1. Introduction
7.1.1. Market share and Basis Points (BPS) Analysis, by Material
7.1.2. Y-o-Y Growth Projections, By Material
7.2. Historical Market Value (US$ Mn) and Volume (Units), 2017-2021, by Material
7.2.1. Plastic
7.2.1.1. Polyethylene
7.2.1.2. Polystyrene
7.2.1.3. PET
7.2.1.4. Polyamide
7.2.1.5. Polypropylene
7.2.1.6. Others
7.2.2. Metal
7.2.2.1. Aluminium
7.2.2.2. Steel
7.2.3. Others (Leather, etc.)
7.3. Market Value (US$ Mn) and Volume (Units) Forecast Analysis 2022-2030, by Material
7.3.1. Plastic
7.3.1.1. Polyethylene
7.3.1.2. Polystyrene
7.3.1.3. PET
7.3.1.4. Polyamide
7.3.1.5. Polypropylene
7.3.1.6. Others
7.3.2. Metal
7.3.2.1. Aluminium
7.3.2.2. Steel
7.3.3. Others (Leather, etc.)
7.4. Market Attractiveness Analysis, by Material
8. Global Protective Cases Market Analysis and Forecast, by Case Weight
8.1. Introduction
8.1.1. Market share and Basis Points (BPS) Analysis, by Case Weight
8.1.2. Y-o-Y Growth Projections, By Case Weight
8.2. Historical Market Value (US$ Mn) and Volume (Units), 2017-2021, by Case Weight
8.2.1. Less than 3 kg
8.2.2. 3 to 5 kg
8.2.3. 6 to 10 kg
8.2.4. 11 to 15 kg
8.2.5. Above 15 kg
8.3. Market Value (US$ Mn) and Volume (Units) Forecast Analysis 2022-2030, by Case Weight
8.3.1. Less than 3 kg
8.3.2. 3 to 5 kg
8.3.3. 6 to 10 kg
8.3.4. 11 to 15 kg
8.3.5. Above 15 kg
8.4. Market Attractiveness Analysis, by Case Weight
9. Global Protective Cases Market Analysis and Forecast, by End-use
9.1. Introduction
9.1.1. Market share and Basis Points (BPS) Analysis, by End-use
9.1.2. Y-o-Y Growth Projections, By End-use
9.2. Historical Market Value (US$ Mn) and Volume (Units), 2017-2021, by End-use
9.2.1. Photography & Music Equipment
9.2.2. Military Equipment
9.2.3. Measuring & Communication
9.2.4. Medical & Fire Safety Equipment
9.2.5. Automotive & Mechanical Parts
9.2.6. Electronics & Semiconductor Components
9.2.7. Others (Chemicals, Biotechnology, Etc.)
9.3. Market Value (US$ Mn) and Volume (Units) Forecast Analysis 2022-2030, by End-use
9.3.1. Photography & Music Equipment
9.3.2. Military Equipment
9.3.3. Measuring & Communication
9.3.4. Medical & Fire Safety Equipment
9.3.5. Automotive & Mechanical Parts
9.3.6. Electronics & Semiconductor Components
9.3.7. Others (Chemicals, Biotechnology, Etc.)
9.4. Market Attractiveness Analysis, by End-use
9.5. Prominent Trends
10. Global Protective Cases Market Analysis and Forecast, by Region
10.1. Introduction
10.1.1. Market share and Basis Points (BPS) Analysis By Region
10.1.2. Y-o-Y Growth Projections By Region
10.2. Historical Market Value (US$ Mn) and Volume (Units), 2017-2021, by Region
10.2.1. North America
10.2.2. Latin America
10.2.3. Europe
10.2.4. Asia Pacific
10.2.5. Middle East & Africa
10.3. Market Value (US$ Mn) and Volume (Units) Forecast Analysis 2022-2030 By Region
10.3.1. North America
10.3.2. Latin America
10.3.3. Europe
10.3.4. Asia Pacific
10.3.5. Middle East & Africa
10.4. Market Attractiveness Analysis By Region
11. North America Protective Cases Market Analysis and Forecast
11.1. Introduction
11.1.1. Market share and Basis Points (BPS) Analysis, by Country
11.1.2. Y-o-Y Growth Projections, By Country
11.2. Historical Market Value (US$ Mn) and Volume (Units), 2017-2021, by Country
11.3. Market Value (US$ Mn) and Volume (Units) Forecast Analysis 2022-2030, by Country
11.3.1. U.S.
11.3.2. Canada
11.4. Historical Market Value (US$ Mn) and Volume (Units), 2017-2021, by Material
11.5. Market Value (US$ Mn) and Volume (Units) Forecast Analysis 2022-2030 Analysis 2022-2030, by Material
11.5.1. Plastic
11.5.1.1. Polyethylene
11.5.1.2. Polystyrene
11.5.1.3. PET
11.5.1.4. Polyamide
11.5.1.5. Polypropylene
11.5.1.6. Others
11.5.2. Metal
11.5.2.1. Aluminium
11.5.2.2. Steel
11.5.3. Others (Leather, etc.)
11.6. Historical Market Value (US$ Mn) and Volume (Units), 2017-2021, by Case Weight
11.7. Market Value (US$ Mn) and Volume (Units) Forecast Analysis 2022-2030 Analysis 2022-2030, by Case Weight
11.7.1. Less than 3 kg
11.7.2. 3 to 5 kg
11.7.3. 6 to 10 kg
11.7.4. 11 to 15 kg
11.7.5. Above 15 kg
11.8. Historical Market Value (US$ Mn) and Volume (Units), 2017-2021, by End-use
11.9. Market Value (US$ Mn) and Volume (Units) Forecast Analysis 2022-2030, by End-use
11.9.1. Photography & Music Equipment
11.9.2. Military Equipment
11.9.3. Measuring & Communication
11.9.4. Medical & Fire Safety Equipment
11.9.5. Automotive & Mechanical Parts
11.9.6. Electronics & Semiconductor Components
11.9.7. Others (Chemicals, Biotechnology, Etc.)
11.10. Market Attractiveness Analysis
11.10.1. By Country
11.10.2. By Material
11.10.3. By Case Weight
11.10.4. By End-use
12. Latin America Protective Cases Market Analysis and Forecast
12.1. Introduction
12.1.1. Market share and Basis Points (BPS) Analysis, by Country and Sub-region
12.1.2. Y-o-Y Growth Projections, by Country and Sub-region
12.2. Historical Market Value (US$ Mn) and Volume (Units), 2017-2021, by Country and Sub-region
12.3. Market Value (US$ Mn) and Volume (Units) Forecast Analysis 2022-2030, by Country and Sub-region
12.3.1. Brazil
12.3.2. Mexico
12.3.3. Argentina
12.3.4. Rest of Latin America
12.4. Historical Market Value (US$ Mn) and Volume (Units), 2017-2021, by Material
12.5. Market Value (US$ Mn) and Volume (Units) Forecast Analysis 2022-2030 Analysis 2022-2030, by Material
12.5.1. Plastic
12.5.1.1. Polyethylene
12.5.1.2. Polystyrene
12.5.1.3. PET
12.5.1.4. Polyamide
12.5.1.5. Polypropylene
12.5.1.6. Others
12.5.2. Metal
12.5.2.1. Aluminium
12.5.2.2. Steel
12.5.3. Others (Leather, etc.)
12.6. Historical Market Value (US$ Mn) and Volume (Units), 2017-2021, by Case Weight
12.7. Market Value (US$ Mn) and Volume (Units) Forecast Analysis 2022-2030 Analysis 2022-2030, by Case Weight
12.7.1. Less than 3 kg
12.7.2. 3 to 5 kg
12.7.3. 6 to 10 kg
12.7.4. 11 to 15 kg
12.7.5. Above 15 kg
12.8. Historical Market Value (US$ Mn) and Volume (Units), 2017-2021, by End-use
12.9. Market Value (US$ Mn) and Volume (Units) Forecast Analysis 2022-2030, by End-use
12.9.1. Photography & Music Equipment
12.9.2. Military Equipment
12.9.3. Measuring & Communication
12.9.4. Medical & Fire Safety Equipment
12.9.5. Automotive & Mechanical Parts
12.9.6. Electronics & Semiconductor Components
12.9.7. Others (Chemicals, Biotechnology, Etc.)
12.10. Market Attractiveness Analysis
12.10.1. By Country and Sub-region
12.10.2. By Material
12.10.3. By Case Weight
12.10.4. By End-use
13. Europe Protective Cases Market Analysis and Forecast
13.1. Introduction
13.1.1. Market share and Basis Points (BPS) Analysis, by Country and Sub-region
13.1.2. Y-o-Y Growth Projections, by Country and Sub-region
13.2. Historical Market Value (US$ Mn) and Volume (Units), 2017-2021, by Country and Sub-region
13.3. Market Value (US$ Mn) and Volume (Units) Forecast Analysis 2022-2030, by Country and Sub-region
13.3.1. Germany
13.3.2. Italy
13.3.3. Spain
13.3.4. Russia
13.3.5. U.K.
13.3.6. France
13.3.7. Benelux
13.3.8. Rest of Europe
13.4. Historical Market Value (US$ Mn) and Volume (Units), 2017-2021, by Material
13.5. Market Value (US$ Mn) and Volume (Units) Forecast Analysis 2022-2030 Analysis 2022-2030, by Material
13.5.1. Plastic
13.5.1.1. Polyethylene
13.5.1.2. Polystyrene
13.5.1.3. PET
13.5.1.4. Polyamide
13.5.1.5. Polypropylene
13.5.1.6. Others
13.5.2. Metal
13.5.2.1. Aluminium
13.5.2.2. Steel
13.5.3. Others (Leather, etc.)
13.6. Historical Market Value (US$ Mn) and Volume (Units), 2017-2021, by Case Weight
13.7. Market Value (US$ Mn) and Volume (Units) Forecast Analysis 2022-2030 Analysis 2022-2030, by Case Weight
13.7.1. Less than 3 kg
13.7.2. 3 to 5 kg
13.7.3. 6 to 10 kg
13.7.4. 11 to 15 kg
13.7.5. Above 15 kg
13.8. Historical Market Value (US$ Mn) and Volume (Units), 2017-2021, by End-use
13.9. Market Value (US$ Mn) and Volume (Units) Forecast Analysis 2022-2030, by End-use
13.9.1. Photography & Music Equipment
13.9.2. Military Equipment
13.9.3. Measuring & Communication
13.9.4. Medical & Fire Safety Equipment
13.9.5. Automotive & Mechanical Parts
13.9.6. Electronics & Semiconductor Components
13.9.7. Others (Chemicals, Biotechnology, Etc.)
13.10. Market Attractiveness Analysis
13.10.1. By Country and Sub-region
13.10.2. By Material
13.10.3. By Case Weight
13.10.4. By End-use
14. Asia Pacific Protective Cases Market Analysis and Forecast
14.1. Introduction
14.1.1. Market share and Basis Points (BPS) Analysis, by Country and Sub-region
14.1.2. Y-o-Y Growth Projections, by Country and Sub-region
14.2. Historical Market Value (US$ Mn) and Volume (Units), 2017-2021, by Country and Sub-region
14.3. Market Value (US$ Mn) and Volume (Units) Forecast Analysis 2022-2030, by Country and Sub-region
14.3.1. China
14.3.2. India
14.3.3. ASEAN
14.3.4. Australia & New Zealand
14.3.5. Japan
14.3.6. Rest of Asia Pacific
14.4. Historical Market Value (US$ Mn) and Volume (Units), 2017-2021, by Material
14.5. Market Value (US$ Mn) and Volume (Units) Forecast Analysis 2022-2030 Analysis 2022-2030, by Material
14.5.1. Plastic
14.5.1.1. Polyethylene
14.5.1.2. Polystyrene
14.5.1.3. PET
14.5.1.4. Polyamide
14.5.1.5. Polypropylene
14.5.1.6. Others
14.5.2. Metal
14.5.2.1. Aluminium
14.5.2.2. Steel
14.5.3. Others (Leather, etc.)
14.6. Historical Market Value (US$ Mn) and Volume (Units), 2017-2021, by Case Weight
14.7. Market Value (US$ Mn) and Volume (Units) Forecast Analysis 2022-2030 Analysis 2022-2030, by Case Weight
14.7.1. Less than 3 kg
14.7.2. 3 to 5 kg
14.7.3. 6 to 10 kg
14.7.4. 11 to 15 kg
14.7.5. Above 15 kg
14.8. Historical Market Value (US$ Mn) and Volume (Units), 2017-2021, by End-use
14.9. Market Value (US$ Mn) and Volume (Units) Forecast Analysis 2022-2030, by End-use
14.9.1. Photography & Music Equipment
14.9.2. Military Equipment
14.9.3. Measuring & Communication
14.9.4. Medical & Fire Safety Equipment
14.9.5. Automotive & Mechanical Parts
14.9.6. Electronics & Semiconductor Components
14.9.7. Others (Chemicals, Biotechnology, Etc.)
14.10. Market Attractiveness Analysis
14.10.1. By Country and Sub-region
14.10.2. By Material
14.10.3. By Case Weight
14.10.4. By End-use
15. Middle East & Africa Protective Cases Market Analysis and Forecast
15.1. Introduction
15.1.1. Market share and Basis Points (BPS) Analysis, by Country and Sub-region
15.1.2. Y-o-Y Growth Projections, by Country and Sub-region
15.2. Historical Market Value (US$ Mn) and Volume (Units), 2017-2021, by Country and Sub-region
15.3. Market Value (US$ Mn) and Volume (Units) Forecast Analysis 2022-2030, by Country and Sub-region
15.3.1. Northern Africa
15.3.2. GCC countries
15.3.3. South Africa
15.3.4. Turkey
15.3.5. Rest of MEA
15.4. Historical Market Value (US$ Mn) and Volume (Units), 2017-2021, by Material
15.5. Market Value (US$ Mn) and Volume (Units) Forecast Analysis 2022-2030 Analysis 2022-2030, by Material
15.5.1. Plastic
15.5.1.1. Polyethylene
15.5.1.2. Polystyrene
15.5.1.3. PET
15.5.1.4. Polyamide
15.5.1.5. Polypropylene
15.5.1.6. Others
15.5.2. Metal
15.5.2.1. Aluminium
15.5.2.2. Steel
15.5.3. Others (Leather, etc.)
15.6. Historical Market Value (US$ Mn) and Volume (Units), 2017-2021, by Case Weight
15.7. Market Value (US$ Mn) and Volume (Units) Forecast Analysis 2022-2030 Analysis 2022-2030, by Case Weight
15.7.1. Less than 3 kg
15.7.2. 3 to 5 kg
15.7.3. 6 to 10 kg
15.7.4. 11 to 15 kg
15.7.5. Above 15 kg
15.8. Historical Market Value (US$ Mn) and Volume (Units), 2017-2021, by End-use
15.9. Market Value (US$ Mn) and Volume (Units) Forecast Analysis 2022-2030, by End-use
15.9.1. Photography & Music Equipment
15.9.2. Military Equipment
15.9.3. Measuring & Communication
15.9.4. Medical & Fire Safety Equipment
15.9.5. Automotive & Mechanical Parts
15.9.6. Electronics & Semiconductor Components
15.9.7. Others (Chemicals, Biotechnology, Etc.)
15.10. Market Attractiveness Analysis
15.10.1. By Country and Sub-region
15.10.2. By Material
15.10.3. By Case Weight
15.10.4. By End-use
16. Country wise Protective Cases Market Analysis, 2022-2030
16.1. U.S. Protective Cases Market Analysis
16.1.1. By Material
16.1.2. By Case Weight
16.1.3. By End-use
16.2. Canada Protective Cases Market Analysis
16.2.1. By Material
16.2.2. By Case Weight
16.2.3. By End-use
16.3. Brazil Protective Cases Market Analysis
16.3.1. By Material
16.3.2. By Case Weight
16.3.3. By End-use
16.4. Mexico Protective Cases Market Analysis
16.4.1. By Material
16.4.2. By Case Weight
16.4.3. By End-use
16.5. Germany Protective Cases Market Analysis
16.5.1. By Material
16.5.2. By Case Weight
16.5.3. By End-use
16.6. Spain Protective Cases Market Analysis
16.6.1. By Material
16.6.2. By Case Weight
16.6.3. By End-use
16.7. France Protective Cases Market Analysis
16.7.1. By Material
16.7.2. By Case Weight
16.7.3. By End-use
16.8. U K Protective Cases Market Analysis
16.8.1. By Material
16.8.2. By Case Weight
16.8.3. By End-use
16.9. Italy Protective Cases Market Analysis
16.9.1. By Material
16.9.2. By Case Weight
16.9.3. By End-use
16.10. Russia Protective Cases Market Analysis
16.10.1. By Material
16.10.2. By Case Weight
16.10.3. By End-use
16.11. China Protective Cases Market Analysis
16.11.1. By Material
16.11.2. By Case Weight
16.11.3. By End-use
16.12. India Protective Cases Market Analysis
16.12.1. By Material
16.12.2. By Case Weight
16.12.3. By End-use
16.13. Japan Protective Cases Market Analysis
16.13.1. By Material
16.13.2. By Case Weight
16.13.3. By End-use
16.14. GCC Countries Protective Cases Market Analysis
16.14.1. By Material
16.14.2. By Case Weight
16.14.3. By End-use
16.15. South Africa Protective Cases Market Analysis
16.15.1. By Material
16.15.2. By Case Weight
16.15.3. By End-use
17. Competitive Landscape
17.1. Market Structure
17.2. Competition Dashboard
17.3. Company Market Share Analysis
17.4. Company Profiles (Details – Overview, Financials, Strategy, Recent Developments, SWOT analysis)
17.5. Competition Deep Dive
(Key Global Market Players)
17.5.1. Pelican Products, Inc.
17.5.1.1. Overview
17.5.1.2. Financials
17.5.1.3. Strategy
17.5.1.4. Recent Developments
17.5.1.5. SWOT Analysis
17.5.2. C.H. Ellis Company, Inc.
17.5.2.1. Overview
17.5.2.2. Financials
17.5.2.3. Strategy
17.5.2.4. Recent Developments
17.5.2.5. SWOT Analysis
17.5.3. SKB Corporation Inc.
17.5.3.1. Overview
17.5.3.2. Financials
17.5.3.3. Strategy
17.5.3.4. Recent Developments
17.5.3.5. SWOT Analysis
17.5.4. GT Line Srl
17.5.4.1. Overview
17.5.4.2. Financials
17.5.4.3. Strategy
17.5.4.4. Recent Developments
17.5.4.5. SWOT Analysis
17.5.5. PARAT Beteiligungs GmbH
17.5.5.1. Overview
17.5.5.2. Financials
17.5.5.3. Strategy
17.5.5.4. Recent Developments
17.5.5.5. SWOT Analysis
17.5.6. Gemstar Manufacturing Inc.
17.5.6.1. Overview
17.5.6.2. Financials
17.5.6.3. Strategy
17.5.6.4. Recent Developments
17.5.6.5. SWOT Analysis
17.5.7. Nefab Group
17.5.7.1. Overview
17.5.7.2. Financials
17.5.7.3. Strategy
17.5.7.4. Recent Developments
17.5.7.5. SWOT Analysis
17.5.8. Zarges GmbH
17.5.8.1. Overview
17.5.8.2. Financials
17.5.8.3. Strategy
17.5.8.4. Recent Developments
17.5.8.5. SWOT Analysis
17.5.9. Suprobox (Makel)
17.5.9.1. Overview
17.5.9.2. Financials
17.5.9.3. Strategy
17.5.9.4. Recent Developments
17.5.9.5. SWOT Analysis
17.5.10. GMOHLING Transportgeräte GmbH
17.5.10.1. Overview
17.5.10.2. Financials
17.5.10.3. Strategy
17.5.10.4. Recent Developments
17.5.10.5. SWOT Analysis
17.5.11. CP Cases UK
17.5.11.1. Overview
17.5.11.2. Financials
17.5.11.3. Strategy
17.5.11.4. Recent Developments
17.5.11.5. SWOT Analysis
17.5.12. Cases By Source, Inc.
17.5.12.1. Overview
17.5.12.2. Financials
17.5.12.3. Strategy
17.5.12.4. Recent Developments
17.5.12.5. SWOT Analysis
17.5.13. Shell-Case Design ltd.
17.5.13.1. Overview
17.5.13.2. Financials
17.5.13.3. Strategy
17.5.13.4. Recent Developments
17.5.13.5. SWOT Analysis
17.5.14. NANUK, USA
17.5.14.1. Overview
17.5.14.2. Financials
17.5.14.3. Strategy
17.5.14.4. Recent Developments
17.5.14.5. SWOT Analysis
17.5.15. Plastic Forming Company, Inc.
17.5.15.1. Overview
17.5.15.2. Financials
17.5.15.3. Strategy
17.5.15.4. Recent Developments
17.5.15.5. SWOT Analysis
18. Assumptions and Acronyms Used
19. Research Methodology
List of Tables
Table 01: Global Protective Cases Market Historic Value (US$ Mn), by Material 2017(H)-2021(A)
Table 02: Global Protective Cases Market Forecast Value (US$ Mn), by Material 2022(E)-2030(F)
Table 03: Global Protective Cases Market Historic Volume (Units), by Material 2017(H)-2021(A)
Table 04: Global Protective Cases Market Forecast Volume (Units), by Material 2022(E)-2030(F)
Table 05: Global Protective Cases Market Historic Value (US$ Mn), by Case Weight 2017(H)-2021(A)
Table 06: Global Protective Cases Market Forecast Value (US$ Mn), by Case Weight 2022(E)-2030(F)
Table 07: Global Protective Cases Market Historic Volume (Units), by Case Weight 2017(H)-2021(A)
Table 08: Global Protective Cases Market Forecast Volume (Units), by Case Weight 2022(E)-2030(F)
Table 09: Global Protective Cases Market Historic Value (US$ Mn), by End-use 2017(H)-2021(A)
Table 10: Global Protective Cases Market Forecast Value (US$ Mn), by End-use 2022(E)-2030(F)
Table 11: Global Protective Cases Market Historic Volume (Units), by End-use 2017(H)-2021(A)
Table 12: Global Protective Cases Market Forecast Volume (Units), by End-use 2022(E)-2030(F)
Table 13: Global Protective Cases Market Historic Value (US$ Mn), by Region 2017(H)-2021(A)
Table 14: Global Protective Cases Market Forecast Value (US$ Mn), by Region 2022(E)-2030(F)
Table 15: Global Protective Cases Market Historic Volume (Units), by Region 2017(H)-2021(A)
Table 16: Global Protective Cases Market Forecast Volume (Units), by Region 2022(E)-2030(F)
Table 17: North America Protective Cases Market Historic Value (US$ Mn), by Material 2017(H)-2021(A)
Table 18: North America Protective Cases Market Forecast Value (US$ Mn), by Material 2022(E)-2030(F)
Table 19: North America Protective Cases Market Historic Volume (Units), by Material 2017(H)-2021(A)
Table 20: North America Protective Cases Market Forecast Volume (Units), by Material 2022(E)-2030(F)
Table 21: North America Protective Cases Market Historic Value (US$ Mn), by Case Weight 2017(H)-2021(A)
Table 22: North America Protective Cases Market Forecast Value (US$ Mn), by Case Weight 2022(E)-2030(F)
Table 23: North America Protective Cases Market Historic Volume (Units), by Case Weight 2017(H)-2021(A)
Table 24: North America Protective Cases Market Forecast Volume (Units), by Case Weight 2022(E)-2030(F)
Table 25: North America Protective Cases Market Historic Value (US$ Mn), by End-use 2017(H)-2021(A)
Table 26: North America Protective Cases Market Forecast Value (US$ Mn), by End-use 2022(E)-2030(F)
Table 27: North America Protective Cases Market Historic Volume (Units), by End-use 2017(H)-2021(A)
Table 28: North America Protective Cases Market Forecast Volume (Units), by End-use 2022(E)-2030(F)
Table 29: North America Protective Cases Market Historic Value (US$ Mn), by Country 2017(H)-2021(A)
Table 30: North America Protective Cases Market Forecast Value (US$ Mn), by Country 2022(E)-2030(F)
Table 31: North America Protective Cases Market Historic Volume (Units), by Country 2017(H)-2021(A)
Table 32: North America Protective Cases Market Forecast Volume (Units), by Country 2022(E)-2030(F)
Table 33: Latin America Protective Cases Market Historic Value (US$ Mn), by Material 2017(H)-2021(A)
Table 34: Latin America Protective Cases Market Forecast Value (US$ Mn), by Material 2022(E)-2030(F)
Table 35: Latin America Protective Cases Market Historic Volume (Units), by Material 2017(H)-2021(A)
Table 36: Latin America Protective Cases Market Forecast Volume (Units), by Material 2022(E)-2030(F)
Table 37: Latin America Protective Cases Market Historic Value (US$ Mn), by Case Weight 2017(H)-2021(A)
Table 38: Latin America Protective Cases Market Forecast Value (US$ Mn), by Case Weight 2022(E)-2030(F)
Table 39: Latin America Protective Cases Market Historic Volume (Units), by Case Weight 2017(H)-2021(A)
Table 40: Latin America Protective Cases Market Forecast Volume (Units), by Case Weight 2022(E)-2030(F)
Table 41: Latin America Protective Cases Market Historic Value (US$ Mn), by End-use 2017(H)-2021(A)
Table 42: Latin America Protective Cases Market Forecast Value (US$ Mn), by End-use 2022(E)-2030(F)
Table 43: Latin America Protective Cases Market Historic Volume (Units), by End-use 2017(H)-2021(A)
Table 44: Latin America Protective Cases Market Forecast Volume (Units), by End-use 2022(E)-2030(F)
Table 45: Latin America Protective Cases Market Historic Value (US$ Mn), by Country and Sub-region, 2017(H)-2021(A)
Table 46: Latin America Protective Cases Market Forecast Value (US$ Mn), by Country and Sub-region 2022(E)-2030(F)
Table 47: Latin America Protective Cases Market Historic Volume (Units), by Country and Sub-region 2017(H)-2021(A)
Table 48: Latin America Protective Cases Market Forecast Volume (Units), by Country and Sub-region 2022(E)-2030(F)
Table 49: Europe Protective Cases Market Historic Value (US$ Mn), by Material 2017(H)-2021(A)
Table 50: Europe Protective Cases Market Forecast Value (US$ Mn), by Material 2022(E)-2030(F)
Table 51: Europe Protective Cases Market Historic Volume (Units), by Material 2017(H)-2021(A)
Table 52: Europe Protective Cases Market Forecast Volume (Units), by Material 2022(E)-2030(F)
Table 53: Europe Protective Cases Market Historic Value (US$ Mn), by Case Weight 2017(H)-2021(A)
Table 54: Europe Protective Cases Market Forecast Value (US$ Mn), by Case Weight 2022(E)-2030(F)
Table 55: Europe Protective Cases Market Historic Volume (Units), by Case Weight 2017(H)-2021(A)
Table 56: Europe Protective Cases Market Forecast Volume (Units), by Case Weight 2022(E)-2030(F)
Table 57: Europe Protective Cases Market Historic Value (US$ Mn), by End-use 2017(H)-2021(A)
Table 58: Europe Protective Cases Market Forecast Value (US$ Mn), by End-use 2022(E)-2030(F)
Table 59: Europe Protective Cases Market Historic Volume (Units), by End-use 2017(H)-2021(A)
Table 60: Europe Protective Cases Market Forecast Volume (Units), by End-use 2022(E)-2030(F)
Table 61: Europe Protective Cases Market Historic Value (US$ Mn), by Country and Sub-region 2017(H)-2021(A)
Table 62: Europe Protective Cases Market Forecast Value (US$ Mn), by Country and Sub-region 2022(E)-2030(F)
Table 63: Europe Protective Cases Market Historic Volume (Units), by Country and Sub-region 2017(H)-2021(A)
Table 64: Europe Protective Cases Market Forecast Volume (Units), by Country and Sub-region 2022(E)-2030(F)
Table 65: Asia Pacific Protective Cases Market Historic Value (US$ Mn), by Material 2017(H)-2021(A)
Table 66: Asia Pacific Protective Cases Market Forecast Value (US$ Mn), by Material 2022(E)-2030(F)
Table 67: Asia Pacific Protective Cases Market Historic Volume (Units), by Material 2017(H)-2021(A)
Table 68: Asia Pacific Protective Cases Market Forecast Volume (Units), by Material 2022(E)-2030(F)
Table 69: Asia Pacific Protective Cases Market Historic Value (US$ Mn), by Case Weight 2017(H)-2021(A)
Table 70: Asia Pacific Protective Cases Market Forecast Value (US$ Mn), by Case Weight 2022(E)-2030(F)
Table 71: Asia Pacific Protective Cases Market Historic Volume (Units), by Case Weight 2017(H)-2021(A)
Table 72: Asia Pacific Protective Cases Market Forecast Volume (Units), by Case Weight 2022(E)-2030(F)
Table 73: Asia Pacific Protective Cases Market Historic Value (US$ Mn), by End-use 2017(H)-2021(A)
Table 74: Asia Pacific Protective Cases Market Forecast Value (US$ Mn), by End-use 2022(E)-2030(F)
Table 75: Asia Pacific Protective Cases Market Historic Volume (Units), by End-use 2017(H)-2021(A)
Table 76: Asia Pacific Protective Cases Market Forecast Volume (Units), by End-use 2022(E)-2030(F)
Table 77: Asia Pacific Protective Cases Market Historic Value (US$ Mn), by Country and Sub-region 2017(H)-2021(A)
Table 78: Asia Pacific Protective Cases Market Forecast Value (US$ Mn), by Country and Sub-region 2022(E)-2030(F)
Table 79: Asia Pacific Protective Cases Market Historic Volume (Units), by Country and Sub-region 2017(H)-2021(A)
Table 80: Asia Pacific Protective Cases Market Forecast Volume (Units), by Country and Sub-region 2022(E)-2030(F)
Table 81: MEA Protective Cases Market Historic Value (US$ Mn), by Material 2017(H)-2021(A)
Table 82: MEA Protective Cases Market Forecast Value (US$ Mn), by Material 2022(E)-2030(F)
Table 83: MEA Protective Cases Market Historic Volume (Units), by Material 2017(H)-2021(A)
Table 84: MEA Protective Cases Market Forecast Volume (Units), by Material 2022(E)-2030(F)
Table 85: MEA Protective Cases Market Historic Value (US$ Mn), by Case Weight 2017(H)-2021(A)
Table 86: MEA Protective Cases Market Forecast Value (US$ Mn), by Case Weight 2022(E)-2030(F)
Table 87: MEA Protective Cases Market Historic Volume (Units), by Case Weight 2017(H)-2021(A)
Table 88: MEA Protective Cases Market Forecast Volume (Units), by Case Weight 2022(E)-2030(F)
Table 89: MEA Protective Cases Market Historic Value (US$ Mn), by End-use 2017(H)-2021(A)
Table 90: MEA Protective Cases Market Forecast Value (US$ Mn), by End-use 2022(E)-2030(F)
Table 91: MEA Protective Cases Market Historic Volume (Units), by End-use 2017(H)-2021(A)
Table 92: MEA Protective Cases Market Forecast Volume (Units), by End-use 2022(E)-2030(F)
Table 93: MEA Protective Cases Market Historic Value (US$ Mn), by Country and Sub-region 2017(H)-2021(A)
Table 94: MEA Protective Cases Market Forecast Value (US$ Mn), by Country and Sub-region 2022(E)-2030(F)
Table 95: MEA Protective Cases Market Historic Volume (Units), by Country and Sub-region 2017(H)-2021(A)
Table 96: MEA Protective Cases Market Forecast Volume (Units), by Country and Sub-region 2022(E)-2030(F)
List of Figures
Figure 01: Global Protective Cases Market Share Analysis by Material, 2022E & 2030F
Figure 02: Global Protective Cases Market Attractiveness Analysis by Material, 2022E-2030F
Figure 03: Global Protective Cases Market Y-o-Y Analysis by Material, 2019H-2030F
Figure 04: Global Protective Cases Market Share Analysis by Case Weight, 2022E & 2030F
Figure 05: Global Protective Cases Market Attractiveness Analysis by Case Weight, 2022E-2030F
Figure 06: Global Protective Cases Market Y-o-Y Analysis by Case Weight, 2019H-2030F
Figure 07: Global Protective Cases Market Share Analysis by End-use, 2022E & 2030F
Figure 08: Global Protective Cases Market Attractiveness Analysis by End-use, 2022E-2030F
Figure 09: Global Protective Cases Market Y-o-Y Analysis by End-use, 2019H-2030F
Figure 10: Global Protective Cases Market Share Analysis by Region, 2022E & 2030F
Figure 11: Global Protective Cases Market Attractiveness Analysis by Region, 2022E-2030F
Figure 12: Global Protective Cases Market Y-o-Y Analysis by Region, 2019H-2030F
Figure 13: North America Protective Cases Market Share Analysis by Material, 2022E & 2030F
Figure 14: North America Protective Cases Market Value Share Analysis by Case Weight 2022(E)
Figure 15: North America Protective Cases Market Attractiveness Analysis by End-use, 2022E-2031F
Figure 16: North America Protective Cases Market Value Share Analysis by Country 2022(E)
Figure 17: Latin America Protective Cases Market Share Analysis by Material, 2022E & 2030F
Figure 18: Latin America Protective Cases Market Value Share Analysis by Case Weight 2022(E)
Figure 19: Latin America Protective Cases Market Attractiveness Analysis by End-use, 2022E-2031F
Figure 20: Latin America Protective Cases Market Value Share Analysis by Country 2022(E)
Figure 21: Europe Protective Cases Market Share Analysis by Material, 2022E & 2030F
Figure 22: Europe Protective Cases Market Value Share Analysis by Case Weight 2022(E)
Figure 23: Europe Protective Cases Market Attractiveness Analysis by End-use, 2022E-2031F
Figure 24: Europe Protective Cases Market Value Share Analysis by Country 2022(E)
Figure 25: Asia Pacific Protective Cases Market Share Analysis by Material, 2022E & 2030F
Figure 26: Asia Pacific Protective Cases Market Value Share Analysis by Case Weight 2022(E)
Figure 27: Asia Pacific Protective Cases Market Attractiveness Analysis by End-use, 2022E-2031F
Figure 28: Asia Pacific Protective Cases Market Value Share Analysis by Country 2022(E)
Figure 29: MEA Protective Cases Market Share Analysis by Material, 2022E & 2030F
Figure 30: MEA Protective Cases Market Value Share Analysis by Case Weight 2022(E)
Figure 31: MEA Protective Cases Market Attractiveness Analysis by End-use, 2022E-2031F
Figure 32: MEA Protective Cases Market Value Share Analysis by Country 2022(E)
Figure 33: U.S. Protective Cases Market Value Share Analysis, by Material, 2022E & 2030F
Figure 34: U.S. Protective Cases Market Value Share Analysis, by Case Weight, 2022E
Figure 35: U.S. Protective Cases Market Value Share Analysis, by End-use, 2022E & 2030F
Figure 36: Canada Protective Cases Market Value Share Analysis, by Material, 2022E & 2030F
Figure 37: Canada Protective Cases Market Value Share Analysis, by Case Weight, 2022E
Figure 38: Canada Protective Cases Market Value Share Analysis, by End-use, 2022E & 2030F
Figure 39: Brazil Protective Cases Market Value Share Analysis, by Material, 2022E & 2030F
Figure 40: Brazil Protective Cases Market Value Share Analysis, by Case Weight, 2022E
Figure 41: Brazil Protective Cases Market Value Share Analysis, by End-use, 2022E & 2030F
Figure 42: Mexico Protective Cases Market Value Share Analysis, by Material, 2022E & 2030F
Figure 43: Mexico Protective Cases Market Value Share Analysis, by Case Weight, 2022E
Figure 44: Mexico Protective Cases Market Value Share Analysis, by End-use, 2022E & 2030F
Figure 45: Germany Protective Cases Market Value Share Analysis, by Material, 2022E & 2030F
Figure 46: Germany Protective Cases Market Value Share Analysis, by Case Weight, 2022E
Figure 47: Germany Specialty Paper Market Value Share Analysis, by End-use, 2022E & 2030F
Figure 48: Spain Protective Cases Market Value Share Analysis, by Material, 2022E & 2030F
Figure 49: Spain Protective Cases Market Value Share Analysis, by Case Weight, 2022E
Figure 50: Spain Protective Cases Market Value Share Analysis, by End-use, 2022E & 2030F
Figure 51: France Protective Cases Market Value Share Analysis, by Material, 2022E & 2030F
Figure 52: France Protective Cases Market Value Share Analysis, by Case Weight, 2022E
Figure 53: France Protective Cases Market Value Share Analysis, by End-use, 2022E & 2030F
Figure 54: U.K. Protective Cases Market Value Share Analysis, by Material, 2022E & 2030F
Figure 55: U.K. Protective Cases Market Value Share Analysis, by Case Weight, 2022E
Figure 56: U.K. Protective Cases Market Value Share Analysis, by End-use, 2022E & 2030F
Figure 57: Italy Protective Cases Market Value Share Analysis, by Material, 2022E & 2030F
Figure 58: Italy Protective Cases Market Value Share Analysis, by Case Weight, 2022E
Figure 59: Italy Protective Cases Market Value Share Analysis, by End-use, 2022E & 2030F
Figure 60: Russia Protective Cases Market Value Share Analysis, by Material, 2022E & 2030F
Figure 61: Russia Protective Cases Market Value Share Analysis, by Case Weight, 2022E
Figure 62: Russia Protective Cases Market Value Share Analysis, by End-use, 2022E & 2030F
Figure 63: China Protective Cases Market Value Share Analysis, by Material, 2022E & 2030F
Figure 64: China Protective Cases Market Value Share Analysis, by Case Weight, 2022E
Figure 65: China Protective Cases Market Value Share Analysis, by End-use, 2022E & 2030F
Figure 66: India Protective Cases Market Value Share Analysis, by Material, 2022E & 2030F
Figure 67: India Protective Cases Market Value Share Analysis, by Case Weight, 2022E
Figure 68: India Protective Cases Market Value Share Analysis, by End-use, 2022E & 2030F
Figure 69: Japan Protective Cases Market Value Share Analysis, by Material, 2022E & 2030F
Figure 70: Japan Protective Cases Market Value Share Analysis, by Case Weight, 2022E
Figure 71: Japan Protective Cases Market Value Share Analysis, by End-use, 2022E & 2030F
Figure 72: GCC Countries Protective Cases Market Value Share Analysis, by Material, 2022E & 2030F
Figure 73: GCC Countries Protective Cases Market Value Share Analysis, by Case Weight, 2022E
Figure 74: GCC Countries Protective Cases Market Value Share Analysis, by End-use, 2022E & 2030F
Figure 75: South Africa Protective Cases Market Value Share Analysis, by Material, 2022E & 2030F
Figure 76: South Africa Protective Cases Market Value Share Analysis, by Case Weight, 2022E
Figure 77: South Africa Protective Cases Market Value Share Analysis, by End-use, 2022E & 2030F
Copyright © Transparency Market Research, Inc. All Rights reserved
Trust Online

Protective Cases Market