
Reports
Reports
Global Process Simulation Software in Oil and Gas Market: Snapshot
Players in the oil and gas industry have recognized the significance of advanced technologies that can optimize the overall operational processes in their production facilities. These players are increasingly adopting various emerging technologies such as connected devices and data analytics. This trend is positively influencing the demand in the global process simulation software in oil and gas market. Solutions offered by the players and developers in the global process simulation software in oil and gas market are set of software tools that offer modelling and designing capabilities. Products in the global process simulation software in oil and gas market are utilized for design, analysis, development, and optimization of various technical processes.
Solutions in the global process simulation software in oil and gas market offer the players in the oil and gas market to reduce the risk of error as well as in enhancing their productivity. Increasing demand for oil and gas as well as rising growth of the oil and gas industry is expected to further the development of the global process simulation software in oil and gas market in coming years. Increase in the research and development initiatives as well as growing investments aimed at research are also providing attractive growth opportunities for the players in the global process simulation software in oil and gas market in coming years.
Furthermore, increasing demand for automation systems in oil and gas sector is also anticipated to favor the augmentation of the global process simulation software in oil and gas market in coming years. On the other hand, high initial cost of investment associated with simulation processes in oil and gas sector may challenge the growth of the global process simulation software in oil and gas market in years to come. Furthermore, complications regarding the interpretation of simulated processes in real life operations may also hamper the development of the global process simulation software in oil and gas market in coming years. However, rising applications in petrochemicals, oil and gas processing, and green engineering are expected to foster the growth in the global process simulation software in oil and gas market in coming years.
Process simulation software is a software or tool that provides designing and modeling capabilities to oil & gas plants, oil & gas pipelines, and other major equipment. These designing tools help project managers, site engineers, as well as site laborers to clearly understand the product/operation in a virtualized environment which eventually helps them in designing the plant, pipeline, etc. as per requirement. The software helps oil and gas companies to minimize the risk of error and optimize total cost of production.
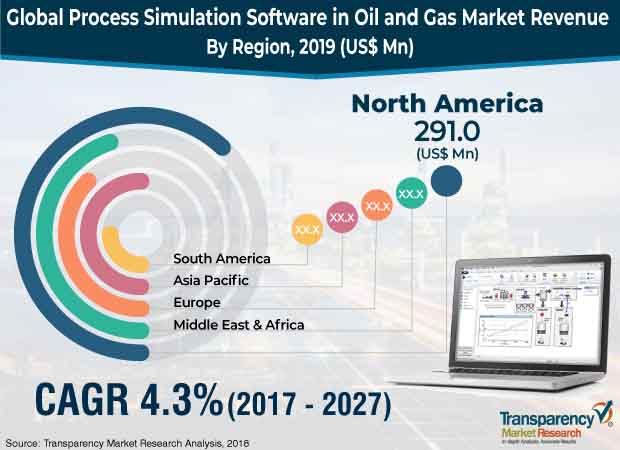
The global process simulation software in oil and gas market was valued at US$927.7 Mn in 2018. It is anticipated to expand at a CAGR of 4.3% during the forecast period.
Software segment is expected to dominate the market throughout the forecast period. Growing implementation of process simulation software at oil and gas facilities to efficiently design and analyze each process during exploration and production of oil and gas is a crucial factor which is boosting the growth of the process simulation software in oil and gas market globally. Oil and gas industry is witnessing tremendous transformation due to industry 4.0. Oil and gas companies are therefore realigning investment by focusing on operational efficiencies and by investing in latest technologies. One such prominent technology is virtual reality/augmented reality. This factor is expected to provide new opportunities for the growth of the market during the forecast period. In terms of application, the upstream, oil & gas processing, and refinery segments constituted a prominent share in the market. Modeling solutions help engineers and contractors to efficiently model and design any kind of infrastructure in minimal time and cost, which reduces the overall time of the project. Midstream, petrochemicals, and green engineering application segments are anticipated to expand at a substantial growth rate during the forecast period. The use of HSE system at oil and gas plants can reduce accidents and increase efficiency.
The global process simulation software in oil and gas market is primarily driven by increasing drilling activities globally and rising overall IT expenditure by oil and gas companies. Furthermore, rising adoption of cloud-based solutions is also driving the growth of the process simulation software in oil and gas market around the globe. Cloud-based solutions help oil and gas companies in increasing the life span, uptime, and reliability of their plant infrastructure, which eventually increases return on investment (ROI).
Growing investment in AR/ VR based 3D simulation tools/solution is one of the major factors which is likely to create new opportunities for the growth of the process simulation software in oil and gas market during the forecast period. Oil and gas companies are expected to increasingly use AR/VR to fix and maintain equipment at oil and gas facilities, train engineers and other staff, and efficiently visualize underground assets and pipelines to avoid any type of breaks during digging.
The adoption rate of process simulation software in oil & gas market in developed regions such as Europe and North America are estimated to increase substantially in the next few years. In terms of revenue, North America accounts for the largest share in the global process simulation software in oil and gas market. Growing digitalization and rapid technology adoption are the major trends contributing to the growth of the process simulation software in oil & gas market in the region. Asia Pacific is anticipated to witness lucrative growth in the process simulation software in oil and gas market during the forecast period. The Asia Pacific market in the short run is largely driven by increasing drilling activity in China. In the long run, countries such as India, Indonesia, Australia, Vietnam, and Malaysia are expected to drive the market.
The global process simulation software in oil & gas market includes different players such as Aspen Technology, Inc., Honeywell Process Solutions, KBC (Yokogawa), AVEVA Group Plc, Process System Enterprise, Ltd., Chemstations, Inc., Kongsberg Gruppen, GSE Systems, Inc., Virtual Material Group Inc. (Schlumberger), ProSim, EQ-Comp, Schneider Electric SE, and Bryan Research & Engineering, LLC.
Process Simulation Software in Oil and Gas Market to expand at a CAGR of 4.3% during the forecast period 2027
increasing demand for automation systems in oil and gas sector is also anticipated to favor the augmentation of the global process simulation software in oil and gas market in coming years
North America holds highest share during 2017-2027
The global process simulation software in oil & gas market includes different players such as Aspen Technology, Inc., Honeywell Process Solutions, KBC (Yokogawa), AVEVA Group Plc, Process System Enterprise, Ltd., Chemstations, Inc., Kongsberg Gruppen, GSE Systems, Inc., Virtual Material Group Inc. (Schlumberger), ProSim, EQ-Comp, Schneider Electric SE, and Bryan Research & Engineering, LLC.
Process Simulation Software in Oil and Gas Market is expected to rise to US$ 1,349.3 Mn by 2027
1. Preface
1.1. Market Scope
1.2. Market Segmentation
1.3. Key Research Objectives
2. Assumptions and Research Methodology
2.1. Market Taxonomy - Segment Definitions
2.2. Research Methodology
2.2.1. List of Primary and Secondary Sources
2.3. Key Assumptions for Data Modeling
3. Executive Summary : Global Process Simulation Software in Oil and Gas Market
4. Market Overview
4.1. Introduction
4.2. Global Market – Macro Economic Factors Overview
4.2.1. Global ICT Spending (US$ Mn), 2012, 2018, 2027
4.2.2. Key Regional Socio-Political-Technological Developments and Their Impact Considerations
4.3. Technology/Product Roadmap
4.4. Market Factor Analysis
4.4.1. Porter’s Five Forces Analysis
4.4.2. Value Chain Analysis
4.4.3. Market Dynamics
4.4.3.1. Drivers
4.4.3.2. Restraints
4.4.3.3. Opportunities
4.4.3.4. Impact Analysis of Drivers & Restraints
4.4.3.5. Trends
4.5. Global Process Simulation Software in Oil and Gas Market Analysis and Forecast, 2017 - 2027
4.5.1. Market Revenue Analysis (US$ Mn)
4.5.1.1. Historic growth trends, 2013-2018
4.5.1.2. Forecast trends, 2019-2027
4.6. Market Attractiveness Analysis – By Region (Global/North America/Europe/Asia Pacific/Middle East & Africa/South America)
4.6.1. By Region/Country
4.6.2. By Component
4.6.3. By Operation Type
4.6.4. By Application
4.7. Market Outlook
4.8. Competitive Scenario and Trends
4.8.1. Process Simulation Software in Oil and Gas Market Concentration Rate
4.8.1.1. List of New Entrants
4.8.2. Mergers & Acquisitions, Expansions
5. Global Process Simulation Software in Oil and Gas Market Analysis and Forecast, By Component
5.1. Overview and Definitions
5.2. Process Simulation Software in Oil and Gas Market Size (US$ Mn) Forecast, By Component, 2017 - 2027
5.2.1. Software
5.2.1.1. Cloud Based
5.2.1.2. On-premise
5.2.2. Services
5.2.2.1. Consultancy
5.2.2.2. Training
5.2.2.3. Support
6. Global Process Simulation Software in Oil and Gas Market Analysis and Forecast, By Operation Type
6.1. Overview and Definitions
6.2. Process Simulation Software in Oil and Gas Market Size (US$ Mn) Forecast, By Operation Type, 2017 - 2027
6.2.1. On-shore
6.2.2. Off-shore
6.2.3. Heavy Oil
6.2.4. Unconventional
7. Global Process Simulation Software in Oil and Gas Market Analysis and Forecast, By Application
7.1. Overview and Definitions
7.2. Process Simulation Software in Oil and Gas Market Size (US$ Mn) Forecast, By Application, 2017– 2027
7.2.1. Upstream
7.2.1.1. Flow Assurance
7.2.1.2. Fluid Properties
7.2.1.3. Production Facilities Equipment Design and Analysis
7.2.1.4. Gathering Systems
7.2.2. Midstream
7.2.2.1. Storage
7.2.2.2. Pipeline Design and Analysis & Pipeline Equipment’s
7.2.2.3. Pipeline Integrity
7.2.2.4. Flow Dynamics
7.2.2.5. Flow Assurance (Metering & Economics)
7.2.2.6. Network Analysis & Optimization
7.2.3. Oil and Gas Processing
7.2.3.1. Oil and Gas Separation
7.2.3.2. Sulfur Recovery
7.2.3.3. Sweetening
7.2.3.4. CO2 Freezing
7.2.3.5. Liquefaction
7.2.3.6. Dehydration
7.2.3.7. Cryogenic Processes
7.2.4. Refining
7.2.4.1. Crude Oil Distillation
7.2.4.2. Heavy Oil Processing
7.2.5. Petrochemicals
7.2.6. Green Engineering
7.2.6.1. HSE Systems
7.2.6.2. Flaring
8. Global Process Simulation Software in Oil and Gas Market Analysis and Forecast, by Region
8.1. Key Findings
8.2. Process Simulation Software in Oil and Gas Market Size (US$ Mn) Forecast, by Region, 2017 - 2027
8.2.1. North America
8.2.2. Europe
8.2.3. Asia Pacific
8.2.4. Middle East & Africa
8.2.5. South America
9. North America Process Simulation Software in Oil and Gas Market Analysis and Forecast
9.1. Key Findings
9.2. Process Simulation Software in Oil and Gas Market Size (US$ Mn) Forecast, By Component, 2017 - 2027
9.2.1. Software
9.2.1.1. Cloud Based
9.2.1.2. On-premise
9.2.2. Services
9.2.2.1. Consultancy
9.2.2.2. Training
9.2.2.3. Support
9.3. Process Simulation Software in Oil and Gas Market Size (US$ Mn) Forecast, By Operation Type, 2017 - 2027
9.3.1. On-shore
9.3.2. Off-shore
9.3.3. Heavy Oil
9.3.4. Unconventional
9.4. Process Simulation Software in Oil and Gas Market Size (US$ Mn) Forecast, By Application, 2017– 2027
9.4.1. Upstream
9.4.1.1. Flow Assurance
9.4.1.2. Fluid Properties
9.4.1.3. Production Facilities Equipment Design and Analysis
9.4.1.4. Gathering Systems
9.4.2. Midstream
9.4.2.1. Storage
9.4.2.2. Pipeline Design and Analysis & Pipeline Equipment’s
9.4.2.3. Pipeline Integrity
9.4.2.4. Flow Dynamics
9.4.2.5. Flow Assurance (Metering & Economics)
9.4.2.6. Network Analysis & Optimization
9.4.3. Oil and Gas Processing
9.4.3.1. Oil and Gas Separation
9.4.3.2. Sulfur Recovery
9.4.3.3. Sweetening
9.4.3.4. CO2 Freezing
9.4.3.5. Liquefaction
9.4.3.6. Dehydration
9.4.3.7. Cryogenic Processes
9.4.4. Refining
9.4.4.1. Crude Oil Distillation
9.4.4.2. Heavy Oil Processing
9.4.5. Petrochemicals
9.4.6. Green Engineering
9.4.6.1. HSE Systems
9.4.6.2. Flaring
9.5. Process Simulation Software in Oil and Gas Market Size (US$ Mn) Forecast, By Country & Sub-region, 2017 - 2027
9.5.1. The U.S.
9.5.2. Canada
9.5.3. Rest of North America
10. Europe Process Simulation Software in Oil and Gas Market Analysis and Forecast
10.1. Key Findings
10.2. Process Simulation Software in Oil and Gas Market Size (US$ Mn) Forecast, By Component, 2017 - 2027
10.2.1. Software
10.2.1.1. Cloud Based
10.2.1.2. On-premise
10.2.2. Services
10.2.2.1. Consultancy
10.2.2.2. Training
10.2.2.3. Support
10.3. Process Simulation Software in Oil and Gas Market Size (US$ Mn) Forecast, By Operation Type, 2017 - 2027
10.3.1. On-shore
10.3.2. Off-shore
10.3.3. Heavy Oil
10.3.4. Unconventional
10.4. Process Simulation Software in Oil and Gas Market Size (US$ Mn) Forecast, By Application, 2017– 2027
10.4.1. Upstream
10.4.1.1. Flow Assurance
10.4.1.2. Fluid Properties
10.4.1.3. Production Facilities Equipment Design and Analysis
10.4.1.4. Gathering Systems
10.4.2. Midstream
10.4.2.1. Storage
10.4.2.2. Pipeline Design and Analysis & Pipeline Equipment’s
10.4.2.3. Pipeline Integrity
10.4.2.4. Flow Dynamics
10.4.2.5. Flow Assurance (Metering & Economics)
10.4.2.6. Network Analysis & Optimization
10.4.3. Oil and Gas Processing
10.4.3.1. Oil and Gas Separation
10.4.3.2. Sulfur Recovery
10.4.3.3. Sweetening
10.4.3.4. CO2 Freezing
10.4.3.5. Liquefaction
10.4.3.6. Dehydration
10.4.3.7. Cryogenic Processes
10.4.4. Refining
10.4.4.1. Crude Oil Distillation
10.4.4.2. Heavy Oil Processing
10.4.5. Petrochemicals
10.4.6. Green Engineering
10.4.6.1. HSE Systems
10.4.6.2. Flaring
10.5. Process Simulation Software in Oil and Gas Market Size (US$ Mn) Forecast, By Country & Sub-region, 2017 - 2027
10.5.1. Germany
10.5.2. France
10.5.3. U.K.
10.5.4. Rest of Europe
11. Asia Pacific Process Simulation Software in Oil and Gas Market Analysis and Forecast
11.1. Key Findings
11.2. Process Simulation Software in Oil and Gas Market Size (US$ Mn) Forecast, By Component, 2017 - 2027
11.2.1. Software
11.2.1.1. Cloud Based
11.2.1.2. On-premise
11.2.2. Services
11.2.2.1. Consultancy
11.2.2.2. Training
11.2.2.3. Support
11.3. Process Simulation Software in Oil and Gas Market Size (US$ Mn) Forecast, By Operation Type, 2017 - 2027
11.3.1. On-shore
11.3.2. Off-shore
11.3.3. Heavy Oil
11.3.4. Unconventional
11.4. Process Simulation Software in Oil and Gas Market Size (US$ Mn) Forecast, By Application, 2017– 2027
11.4.1. Upstream
11.4.1.1. Flow Assurance
11.4.1.2. Fluid Properties
11.4.1.3. Production Facilities Equipment Design and Analysis
11.4.1.4. Gathering Systems
11.4.2. Midstream
11.4.2.1. Storage
11.4.2.2. Pipeline Design and Analysis & Pipeline Equipment’s
11.4.2.3. Pipeline Integrity
11.4.2.4. Flow Dynamics
11.4.2.5. Flow Assurance (Metering & Economics)
11.4.2.6. Network Analysis & Optimization
11.4.3. Oil and Gas Processing
11.4.3.1. Oil and Gas Separation
11.4.3.2. Sulfur Recovery
11.4.3.3. Sweetening
11.4.3.4. CO2 Freezing
11.4.3.5. Liquefaction
11.4.3.6. Dehydration
11.4.3.7. Cryogenic Processes
11.4.4. Refining
11.4.4.1. Crude Oil Distillation
11.4.4.2. Heavy Oil Processing
11.4.5. Petrochemicals
11.4.6. Green Engineering
11.4.6.1. HSE Systems
11.4.6.2. Flaring
11.5. Process Simulation Software in Oil and Gas Market Size (US$ Mn) Forecast, By Country & Sub-region, 2017 - 2027
11.5.1. China
11.5.2. Japan
11.5.3. India
11.5.4. Australia
11.5.5. Rest of Asia Pacific
12. Middle East & Africa (MEA) Process Simulation Software in Oil and Gas Market Analysis and Forecast
12.1. Key Findings
12.2. Process Simulation Software in Oil and Gas Market Size (US$ Mn) Forecast, By Component, 2017 - 2027
12.2.1. Software
12.2.1.1. Cloud Based
12.2.1.2. On-premise
12.2.2. Services
12.2.2.1. Consultancy
12.2.2.2. Training
12.2.2.3. Support
12.3. Process Simulation Software in Oil and Gas Market Size (US$ Mn) Forecast, By Operation Type, 2017 - 2027
12.3.1. On-shore
12.3.2. Off-shore
12.3.3. Heavy Oil
12.3.4. Unconventional
12.4. Process Simulation Software in Oil and Gas Market Size (US$ Mn) Forecast, By Application, 2017– 2027
12.4.1. Upstream
12.4.1.1. Flow Assurance
12.4.1.2. Fluid Properties
12.4.1.3. Production Facilities Equipment Design and Analysis
12.4.1.4. Gathering Systems
12.4.2. Midstream
12.4.2.1. Storage
12.4.2.2. Pipeline Design and Analysis & Pipeline Equipment’s
12.4.2.3. Pipeline Integrity
12.4.2.4. Flow Dynamics
12.4.2.5. Flow Assurance (Metering & Economics)
12.4.2.6. Network Analysis & Optimization
12.4.3. Oil and Gas Processing
12.4.3.1. Oil and Gas Separation
12.4.3.2. Sulfur Recovery
12.4.3.3. Sweetening
12.4.3.4. CO2 Freezing
12.4.3.5. Liquefaction
12.4.3.6. Dehydration
12.4.3.7. Cryogenic Processes
12.4.4. Refining
12.4.4.1. Crude Oil Distillation
12.4.4.2. Heavy Oil Processing
12.4.5. Petrochemicals
12.4.6. Green Engineering
12.4.6.1. HSE Systems
12.4.6.2. Flaring
12.5. Process Simulation Software in Oil and Gas Market Size (US$ Mn) Forecast, By Country& Sub-region, 2017 - 2027
12.5.1. GCC
12.5.2. South Africa
12.5.3. Rest of MEA
13. South America Process Simulation Software in Oil and Gas Market Analysis and Forecast
13.1. Key Findings
13.2. Process Simulation Software in Oil and Gas Market Size (US$ Mn) Forecast, By Component, 2017 - 2027
13.2.1. Software
13.2.1.1. Cloud Based
13.2.1.2. On-premise
13.2.2. Services
13.2.2.1. Consultancy
13.2.2.2. Training
13.2.2.3. Support
13.3. Process Simulation Software in Oil and Gas Market Size (US$ Mn) Forecast, By Operation Type, 2017 - 2027
13.3.1. On-shore
13.3.2. Off-shore
13.3.3. Heavy Oil
13.3.4. Unconventional
13.4. Process Simulation Software in Oil and Gas Market Size (US$ Mn) Forecast, By Application, 2017– 2027
13.4.1. Upstream
13.4.1.1. Flow Assurance
13.4.1.2. Fluid Properties
13.4.1.3. Production Facilities Equipment Design and Analysis
13.4.1.4. Gathering Systems
13.4.2. Midstream
13.4.2.1. Storage
13.4.2.2. Pipeline Design and Analysis & Pipeline Equipment’s
13.4.2.3. Pipeline Integrity
13.4.2.4. Flow Dynamics
13.4.2.5. Flow Assurance (Metering & Economics)
13.4.2.6. Network Analysis & Optimization
13.4.3. Oil and Gas Processing
13.4.3.1. Oil and Gas Separation
13.4.3.2. Sulfur Recovery
13.4.3.3. Sweetening
13.4.3.4. CO2 Freezing
13.4.3.5. Liquefaction
13.4.3.6. Dehydration
13.4.3.7. Cryogenic Processes
13.4.4. Refining
13.4.4.1. Crude Oil Distillation
13.4.4.2. Heavy Oil Processing
13.4.5. Petrochemicals
13.4.6. Green Engineering
13.4.6.1. HSE Systems
13.4.6.2. Flaring
13.5. Process Simulation Software in Oil and Gas Market Size (US$ Mn) Forecast, By Country & Sub-region, 2017 - 2027
13.5.1. Brazil
13.5.2. Mexico
13.5.3. Rest of South America
14. Competition Landscape
14.1. Market Player – Competition Matrix
14.2. Market Revenue Share Analysis (%), By Company (2018)
14.3. Other Players (other than mentioned 13), Product Overview
14.4. Company Mapping, by Application
15. Company Profiles(Details – Basic Overview, Product Overview, Recent Developments, Revenue, Strategy, SWOT Analysis)
15.1. Aspen Technology, Inc.
15.1.1. Business Overview
15.1.2. Sales Area/Geographical Presence
15.1.3. Product Overview
15.1.4. Revenue
15.1.5. SWOT Analysis
15.1.6. Recent Developments and Strategy
15.2. Honeywell Process Solutions
15.2.1. Business Overview
15.2.2. Sales Area/Geographical Presence
15.2.3. Product Overview
15.2.4. Revenue
15.2.5. SWOT Analysis
15.2.6. Recent Developments and Strategy
15.3. KBC (Yokogawa)
15.3.1. Business Overview
15.3.2. Sales Area/Geographical Presence
15.3.3. Product Overview
15.3.4. Revenue
15.3.5. SWOT Analysis
15.3.6. Recent Developments and Strategy
15.4. AVEVA Group Plc
15.4.1. Business Overview
15.4.2. Sales Area/Geographical Presence
15.4.3. Product Overview
15.4.4. Revenue
15.4.5. SWOT Analysis
15.4.6. Recent Developments and Strategy
15.5. Process System Enterprise Ltd.
15.5.1. Business Overview
15.5.2. Sales Area/Geographical Presence
15.5.3. Product Overview
15.5.4. Revenue
15.5.5. SWOT Analysis
15.5.6. Recent Developments and Strategy
15.6. Kongsberg Group
15.6.1. Business Overview
15.6.2. Sales Area/Geographical Presence
15.6.3. Product Overview
15.6.4. Revenue
15.6.5. SWOT Analysis
15.6.6. Recent Developments and Strategy
15.7. Chemstations Inc.
15.7.1. Business Overview
15.7.2. Sales Area/Geographical Presence
15.7.3. Product Overview
15.7.4. Revenue
15.7.5. SWOT Analysis
15.7.6. Recent Developments and Strategy
15.8. GSE Systems
15.8.1. Business Overview
15.8.2. Sales Area/Geographical Presence
15.8.3. Product Overview
15.8.4. Revenue
15.8.5. SWOT Analysis
15.8.6. Recent Developments and Strategy
15.9. Virtual Materials Group Inc. (Schlumberger)
15.9.1. Business Overview
15.9.2. Sales Area/Geographical Presence
15.9.3. Product Overview
15.9.4. Revenue
15.9.5. SWOT Analysis
15.9.6. Recent Developments and Strategy
15.10. ProSim
15.10.1. Business Overview
15.10.2. Sales Area/Geographical Presence
15.10.3. Product Overview
15.10.4. Revenue
15.10.5. SWOT Analysis
15.10.6. Recent Developments and Strategy
15.11. Eq-comp
15.11.1. Business Overview
15.11.2. Sales Area/Geographical Presence
15.11.3. Product Overview
15.11.4. Revenue
15.11.5. SWOT Analysis
15.11.6. Recent Developments and Strategy
15.12. Schneider Electric
15.12.1. Business Overview
15.12.2. Sales Area/Geographical Presence
15.12.3. Product Overview
15.12.4. Revenue
15.12.5. SWOT Analysis
15.12.6. Recent Developments and Strategy
15.13. Bryan Research & Engineering, LLC.
15.13.1. Business Overview
15.13.2. Sales Area/Geographical Presence
15.13.3. Product Overview
15.13.4. Revenue
15.13.5. SWOT Analysis
15.13.6. Recent Developments and Strategy
16. Key Takeaways
List of Tables
Table 1: New Entrant, Mergers and Acquisitions Timeline
Table 2: Global Process Simulation Software in Oil and Gas Market Revenue (US$ Mn) Forecast, by Component, 2017 - 2027
Table 3: Global Process Simulation Software in Oil and Gas Market Revenue (US$ Mn) Forecast, by Operation Type, 2017 - 2027
Table 4: Global Process Simulation Software in Oil and Gas Market Revenue (US$ Mn) Forecast, by Application, 2017 - 2027
Table 5: Global Process Simulation Software in Oil and Gas Market Revenue (US$ Mn) Forecast, by Application, By Upstream, 2017 - 2027
Table 6: Global Process Simulation Software in Oil and Gas Market Revenue (US$ Mn) Forecast, by Application, By Midstream, 2017 - 2027
Table 7: Global Process Simulation Software in Oil and Gas Market Revenue (US$ Mn) Forecast, by Application, By Oil & Gas Processing, 2019 - 2027
Table 8: Global Process Simulation Software in Oil and Gas Market Revenue (US$ Mn) Forecast, by Application, By Refining, 2019 - 2027
Table 9: Global Process Simulation Software in Oil and Gas Market Revenue (US$ Mn) Forecast, by Application, By Green Engineering, 2017 - 2027
Table 10: Global Process Simulation Software in Oil and Gas Market Revenue (US$ Mn) Forecast, by Region, 2019 - 2027
Table 11: North America Process Simulation Software in Oil and Gas Market Revenue (US$ Mn) Forecast, by Component, 2019 - 2027
Table 12: North America Process Simulation Software in Oil and Gas Market Revenue (US$ Mn) Forecast, by Operation Type, 2017 - 2027
Table 13: North America Process Simulation Software in Oil and Gas Market Revenue (US$ Mn) Forecast, by Application, 2017 - 2027
Table 14: North America Process Simulation Software in Oil and Gas Market Revenue (US$ Mn) Forecast, by Application, By Upstream, 2017 - 2027
Table 15: North America Process Simulation Software in Oil and Gas Market Revenue (US$ Mn) Forecast, by Application, By Midstream, 2017 - 2027
Table 16: North America Process Simulation Software in Oil and Gas Market Revenue (US$ Mn) Forecast, by Application, By Oil & Gas Processing, 2017 - 2027
Table 17: North America Process Simulation Software in Oil and Gas Market Revenue (US$ Mn) Forecast, by Application, By Refining, 2017 - 2027
Table 18: North America Process Simulation Software in Oil and Gas Market Revenue (US$ Mn) Forecast, by Application, By Green Engineering, 2017 - 2027
Table 19: North America Process Simulation Software in Oil and Gas Market Revenue (US$ Mn) Forecast, by Country, 2017 - 2027
Table 20: Europe Process Simulation Software in Oil and Gas Market Revenue (US$ Mn) Forecast, by Component, 2017 - 2027
Table 21: Europe Process Simulation Software in Oil and Gas Market Revenue (US$ Mn) Forecast, by Operation Type, 2017 - 2027
Table 22: Europe Process Simulation Software in Oil and Gas Market Revenue (US$ Mn) Forecast, by Application, 2017 - 2027
Table 23: Europe Process Simulation Software in Oil and Gas Market Revenue (US$ Mn) Forecast, by Application, By Upstream, 2017 - 2027
Table 24: Europe Process Simulation Software in Oil and Gas Market Revenue (US$ Mn) Forecast, by Application, By Midstream, 2017 - 2027
Table 25: Europe Process Simulation Software in Oil and Gas Market Revenue (US$ Mn) Forecast, by Application, By Oil & Gas Processing, 2017 - 2027
Table 26: Europe Process Simulation Software in Oil and Gas Market Revenue (US$ Mn) Forecast, by Application, By Refining, 2017 - 2027
Table 27: Europe Process Simulation Software in Oil and Gas Market Revenue (US$ Mn) Forecast, by Application, By Green Engineering, 2017 - 2027
Table 28: Europe Process Simulation Software in Oil and Gas Market Revenue (US$ Mn) Forecast, by Country, 2017 - 2027
Table 29: Asia Pacific Process Simulation Software in Oil and Gas Market Revenue (US$ Mn) Forecast, by Component, 2017 - 2027
Table 30: Asia Pacific Process Simulation Software in Oil and Gas Market Revenue (US$ Mn) Forecast, by Operation Type, 2017 - 2027
Table 31: Asia Pacific Process Simulation Software in Oil and Gas Market Revenue (US$ Mn) Forecast, by Application, 2017 - 2027
Table 32: Asia Pacific Process Simulation Software in Oil and Gas Market Revenue (US$ Mn) Forecast, by Application, By Upstream, 2017 - 2027
Table 33: Asia Pacific Process Simulation Software in Oil and Gas Market Revenue (US$ Mn) Forecast, by Application, By Midstream, 2017 - 2027
Table 34: Asia Pacific Process Simulation Software in Oil and Gas Market Revenue (US$ Mn) Forecast, by Application, By Oil & Gas Processing, 2017 - 2027
Table 35: Asia Pacific Process Simulation Software in Oil and Gas Market Revenue (US$ Mn) Forecast, by Application, By Refining, 2017 - 2027
Table 36: Asia Pacific Process Simulation Software in Oil and Gas Market Revenue (US$ Mn) Forecast, by Application, By Green Engineering, 2017 - 2027
Table 37: Asia Pacific Process Simulation Software in Oil and Gas Market Revenue (US$ Mn) Forecast, by Country, 2017 - 2027
Table 38: MEA Process Simulation Software in Oil and Gas Market Revenue (US$ Mn) Forecast, by Component, 2017 - 2027
Table 39: MEA Process Simulation Software in Oil and Gas Market Revenue (US$ Mn) Forecast, by Operation Type, 2017 - 2027
Table 40: MEA Process Simulation Software in Oil and Gas Market Revenue (US$ Mn) Forecast, by Application, 2017 - 2027
Table 41: MEA Process Simulation Software in Oil and Gas Market Revenue (US$ Mn) Forecast, by Application, By Upstream, 2017 - 2027
Table 42: MEA Process Simulation Software in Oil and Gas Market Revenue (US$ Mn) Forecast, by Application, By Midstream, 2017 - 2027
Table 43: MEA Process Simulation Software in Oil and Gas Market Revenue (US$ Mn) Forecast, by Application, By Oil & Gas Processing, 2017 - 2027
Table 44: MEA Process Simulation Software in Oil and Gas Market Revenue (US$ Mn) Forecast, by Application, By Refining, 2017 - 2027
Table 45: MEA Process Simulation Software in Oil and Gas Market Revenue (US$ Mn) Forecast, by Application, By Green Engineering, 2017 - 2027
Table 46: MEA Process Simulation Software in Oil and Gas Market Revenue (US$ Mn) Forecast, by Country, 2017 - 2027
Table 47: South America Process Simulation Software in Oil and Gas Market Revenue (US$ Mn) Forecast, by Component, 2017 - 2027
Table 48: South America Process Simulation Software in Oil and Gas Market Revenue (US$ Mn) Forecast, by Operation Type, 2017 - 2027
Table 49: South America Process Simulation Software in Oil and Gas Market Revenue (US$ Mn) Forecast, by Application, 2017 - 2027
Table 50: South America Process Simulation Software in Oil and Gas Market Revenue (US$ Mn) Forecast, by Application, By Upstream, 2017 - 2027
Table 51: South America Process Simulation Software in Oil and Gas Market Revenue (US$ Mn) Forecast, by Application, By Midstream, 2017 - 2027
Table 52: South America Process Simulation Software in Oil and Gas Market Revenue (US$ Mn) Forecast, by Application, By Oil & Gas Processing, 2017 - 2027
Table 53: South America Process Simulation Software in Oil and Gas Market Revenue (US$ Mn) Forecast, by Application, By Refining, 2017 - 2027
Table 54: South America Process Simulation Software in Oil and Gas Market Revenue (US$ Mn) Forecast, by Application, By Green Engineering, 2017 - 2027
Table 55: South America Process Simulation Software in Oil and Gas Market Revenue (US$ Mn) Forecast, by Country, 2017 - 2027
List of Figures
Figure 1: Global Process Simulation Software in Oil and Gas Size (US$ Mn) Forecast, 2017–2027
Figure 2: Global Oil and Gas CAPEX (US$ Mn), 2015 – 2018
Figure 3: Global Oil and Gas IT Spending CAPEX (US$ Mn), 2015 – 2018
Figure 4: Yearly Trend Comparison of Number of Wells Drilled with CAPEX Analysis
Figure 5: Global Process Simulation Software in Oil and Gas Market Attractiveness Analysis, by Region (from the year 2019- 2027)
Figure 6: Global Process Simulation Software in Oil and Gas Market Attractiveness Analysis, by Component (from the year 2019- 2027)
Figure 7: Global Process Simulation Software in Oil and Gas Market Attractiveness Analysis, by Operation Type (from the year 2019- 2027)
Figure 8: Global Process Simulation Software in Oil and Gas Market Attractiveness Analysis, by Application (from the year 2019- 2027)
Figure 9: Global Process Simulation Software in Oil and Gas Market Share Analysis, by Component, 2019 and 2027
Figure 10: Global Process Simulation Software in Oil and Gas Market Share Analysis, by Component, By Software (2019)
Figure 11: Global Process Simulation Software in Oil and Gas Market Share Analysis, by Component, By Software (2027)
Figure 12: Global Process Simulation Software in Oil and Gas Market Share Analysis, by Component, By Service (2019)
Figure 13: Global Process Simulation Software in Oil and Gas Market Share Analysis, by Component, By Service (2027)
Figure 14: Global Process Simulation Software in Oil and Gas Market Share Analysis, by Operation Type, 2019 and 2027
Figure 15: Global Process Simulation Software in Oil and Gas Market Share Analysis, by Application, 2019 and 2027
Figure 16: Global Process Simulation Software in Oil and Gas Market Share Analysis, by Application, by Upstream (2019)
Figure 17: Global Process Simulation Software in Oil and Gas Market Share Analysis, by Application, by Upstream (2027)
Figure 18: Global Process Simulation Software in Oil and Gas Market Share Analysis, by Application, by Midstream (2019)
Figure 19: Global Process Simulation Software in Oil and Gas Market Share Analysis, by Application, by Midstream (2027)
Figure 20: Global Process Simulation Software in Oil and Gas Market Share Analysis, by Application, by Oil & Gas Processing (2019)
Figure 21: Global Process Simulation Software in Oil and Gas Market Share Analysis, by Application, by Oil & Gas Processing (2027)
Figure 22: Global Process Simulation Software in Oil and Gas Market Share Analysis, by Application, by Refining (2019)
Figure 23: Global Process Simulation Software in Oil and Gas Market Share Analysis, by Application, by Refining (2027)
Figure 24: Global Process Simulation Software in Oil and Gas Market Share Analysis, by Application, by Green Engineering (2019)
Figure 25: Global Process Simulation Software in Oil and Gas Market Share Analysis, by Application, by Green Engineering (2027)
Figure 26: Global Process Simulation Software in Oil and Gas Market Share Analysis, by Region (2019)
Figure 27: Global Process Simulation Software in Oil and Gas Market Share Analysis, by Region (2027)
Figure 28: North America Process Simulation Software in Oil and Gas Market Share Analysis, by Component (2019)
Figure 29: North America Process Simulation Software in Oil and Gas Market Share Analysis, by Component (2027)
Figure 30: North America Process Simulation Software in Oil and Gas Market Share Analysis, by Component, By Software (2019)
Figure 31: North America Process Simulation Software in Oil and Gas Market Share Analysis, by Component, By Software (2027)
Figure 32: North America Process Simulation Software in Oil and Gas Market Share Analysis, by Component, By Service (2019)
Figure 33: North America Process Simulation Software in Oil and Gas Market Share Analysis, by Component, By Service (2027)
Figure 34: North America Process Simulation Software in Oil and Gas Market, by Operation Type (2019)
Figure 35: North America Process Simulation Software in Oil and Gas Market, by Operation Type (2027)
Figure 36: North America Process Simulation Software in Oil and Gas Market, by Application (2019)
Figure 37: North America Process Simulation Software in Oil and Gas Market, by Application (2027)
Figure 38: North America Process Simulation Software in Oil and Gas Market Share Analysis, by Application, by Upstream (2019)
Figure 39: North America Process Simulation Software in Oil and Gas Market Share Analysis, by Application, by Upstream (2027)
Figure 40: North America Process Simulation Software in Oil and Gas Market Share Analysis, by Application, by Midstream (2019)
Figure 41: North America Process Simulation Software in Oil and Gas Market Share Analysis, by Application, by Midstream (2027)
Figure 42: North America Process Simulation Software in Oil and Gas Market Share Analysis, by Application, by Oil & Gas Processing (2019)
Figure 43: North America Process Simulation Software in Oil and Gas Market Share Analysis, by Application, by Oil & Gas Processing (2027)
Figure 44: North America Process Simulation Software in Oil and Gas Market Share Analysis, by Application, by Refining (2019)
Figure 45: North America Process Simulation Software in Oil and Gas Market Share Analysis, by Application, by Refining (2027)
Figure 46: North America Process Simulation Software in Oil and Gas Market Share Analysis, by Application, by Green Engineering (2019)
Figure 47: North America Process Simulation Software in Oil and Gas Market Share Analysis, by Application, by Green Engineering (2027)
Figure 48: North America Process Simulation Software in Oil and Gas Market Share Analysis, by Country (2019)
Figure 49: North America Process Simulation Software in Oil and Gas Market Share Analysis, by Country (2027)
Figure 50: Europe Process Simulation Software in Oil and Gas Market Share Analysis, by Component (2019)
Figure 51: Europe Process Simulation Software in Oil and Gas Market Share Analysis, by Component (2027)
Figure 52: Europe Process Simulation Software in Oil and Gas Market Share Analysis, by Component, By Software (2019)
Figure 53: Europe Process Simulation Software in Oil and Gas Market Share Analysis, by Component, By Software (2027)
Figure 54: Europe Process Simulation Software in Oil and Gas Market Share Analysis, by Component, By Service (2019)
Figure 55: Europe Process Simulation Software in Oil and Gas Market Share Analysis, by Component, By Service (2027)
Figure 56: Europe Process Simulation Software in Oil and Gas Market, by Operation Type (2019)
Figure 57: Europe Process Simulation Software in Oil and Gas Market, by Operation Type (2027)
Figure 58: Europe Process Simulation Software in Oil and Gas Market, by Application (2019)
Figure 59: Europe Process Simulation Software in Oil and Gas Market, by Application (2027)
Figure 60: Europe Process Simulation Software in Oil and Gas Market Share Analysis, by Application, by Upstream (2019)
Figure 61: Europe Process Simulation Software in Oil and Gas Market Share Analysis, by Application, by Upstream (2027)
Figure 62: Europe Process Simulation Software in Oil and Gas Market Share Analysis, by Application, by Midstream (2019)
Figure 63: Europe Process Simulation Software in Oil and Gas Market Share Analysis, by Application, by Midstream (2027)
Figure 64: Europe Process Simulation Software in Oil and Gas Market Share Analysis, by Application, by Oil & Gas Processing (2019)
Figure 65: Europe Process Simulation Software in Oil and Gas Market Share Analysis, by Application, by Oil & Gas Processing (2027)
Figure 66: Europe Process Simulation Software in Oil and Gas Market Share Analysis, by Application, by Refining (2019)
Figure 67: Europe Process Simulation Software in Oil and Gas Market Share Analysis, by Application, by Refining (2027)
Figure 68: Europe Process Simulation Software in Oil and Gas Market Share Analysis, by Application, by Green Engineering (2019)
Figure 69: Europe Process Simulation Software in Oil and Gas Market Share Analysis, by Application, by Green Engineering (2027)
Figure 70: Europe Process Simulation Software in Oil and Gas Market Share Analysis, by Country (2019)
Figure 71: Europe Process Simulation Software in Oil and Gas Market Share Analysis, by Country (2027)
Figure 72: Asia Pacific Process Simulation Software in Oil and Gas Market Share Analysis, by Component (2019)
Figure 73: Asia Pacific Process Simulation Software in Oil and Gas Market Share Analysis, by Component (2027)
Figure 74: Asia Pacific Process Simulation Software in Oil and Gas Market Share Analysis, by Component, By Software (2019)
Figure 75: Asia Pacific Process Simulation Software in Oil and Gas Market Share Analysis, by Component, By Software (2027)
Figure 76: Asia Pacific Process Simulation Software in Oil and Gas Market Share Analysis, by Component, By Service (2019)
Figure 77: Asia Pacific Process Simulation Software in Oil and Gas Market Share Analysis, by Component, By Service (2027)
Figure 78: Asia Pacific Process Simulation Software in Oil and Gas Market, by Operation Type (2019)
Figure 79: Asia Pacific Process Simulation Software in Oil and Gas Market, by Operation Type (2027)
Figure 80: Asia Pacific Process Simulation Software in Oil and Gas Market, by Application (2019)
Figure 81: Asia Pacific Process Simulation Software in Oil and Gas Market, by Application (2027)
Figure 82: Asia Pacific Process Simulation Software in Oil and Gas Market Share Analysis, by Application, by Upstream (2019)
Figure 83: Asia Pacific Process Simulation Software in Oil and Gas Market Share Analysis, by Application, by Upstream (2027)
Figure 84: Asia Pacific Process Simulation Software in Oil and Gas Market Share Analysis, by Application, by Midstream (2019)
Figure 85: Asia Pacific Process Simulation Software in Oil and Gas Market Share Analysis, by Application, by Midstream (2027)
Figure 86: Asia Pacific Process Simulation Software in Oil and Gas Market Share Analysis, by Application, by Oil & Gas Processing (2019)
Figure 87: Asia Pacific Process Simulation Software in Oil and Gas Market Share Analysis, by Application, by Oil & Gas Processing (2027)
Figure 88: Asia Pacific Process Simulation Software in Oil and Gas Market Share Analysis, by Application, by Refining (2019)
Figure 89: Asia Pacific Process Simulation Software in Oil and Gas Market Share Analysis, by Application, by Refining (2027)
Figure 90: Asia Pacific Process Simulation Software in Oil and Gas Market Share Analysis, by Application, by Green Engineering (2019)
Figure 91: Asia Pacific Process Simulation Software in Oil and Gas Market Share Analysis, by Application, by Green Engineering (2027)
Figure 92: Asia Pacific Process Simulation Software in Oil and Gas Market Share Analysis, by Country (2019)
Figure 93: Asia Pacific Process Simulation Software in Oil and Gas Market Share Analysis, by Country (2027)
Figure 94: MEA Process Simulation Software in Oil and Gas Market Share Analysis, by Component (2019)
Figure 95: MEA Process Simulation Software in Oil and Gas Market Share Analysis, by Component (2027)
Figure 96: MEA Process Simulation Software in Oil and Gas Market Share Analysis, by Component, By Software (2019)
Figure 97: MEA Process Simulation Software in Oil and Gas Market Share Analysis, by Component, By Software (2027)
Figure 98: MEA Process Simulation Software in Oil and Gas Market Share Analysis, by Component, By Service (2019)
Figure 99: MEA Process Simulation Software in Oil and Gas Market Share Analysis, by Component, By Service (2027)
Figure 100: MEA Process Simulation Software in Oil and Gas Market, by Operation Type (2019)
Figure 101: MEA Process Simulation Software in Oil and Gas Market, by Operation Type (2027)
Figure 102: MEA Process Simulation Software in Oil and Gas Market, by Application (2019)
Figure 103: MEA Process Simulation Software in Oil and Gas Market, by Application (2027)
Figure 104: MEA Process Simulation Software in Oil and Gas Market Share Analysis, by Application, by Upstream (2019)
Figure 105: MEA Process Simulation Software in Oil and Gas Market Share Analysis, by Application, by Upstream (2027)
Figure 106: MEA Process Simulation Software in Oil and Gas Market Share Analysis, by Application, by Midstream (2019)
Figure 107: MEA Process Simulation Software in Oil and Gas Market Share Analysis, by Application, by Midstream (2027)
Figure 108: MEA Process Simulation Software in Oil and Gas Market Share Analysis, by Application, by Oil & Gas Processing (2019)
Figure 109: MEA Process Simulation Software in Oil and Gas Market Share Analysis, by Application, by Oil & Gas Processing (2027)
Figure 110: MEA Process Simulation Software in Oil and Gas Market Share Analysis, by Application, by Refining (2019)
Figure 111: MEA Process Simulation Software in Oil and Gas Market Share Analysis, by Application, by Refining (2027)
Figure 112: MEA Process Simulation Software in Oil and Gas Market Share Analysis, by Application, by Green Engineering (2019)
Figure 113: MEA Process Simulation Software in Oil and Gas Market Share Analysis, by Application, by Green Engineering (2027)
Figure 114: MEA Process Simulation Software in Oil and Gas Market Share Analysis, by Country (2019)
Figure 115: MEA Process Simulation Software in Oil and Gas Market Share Analysis, by Country (2027)
Figure 116: South America Process Simulation Software in Oil and Gas Market Share Analysis, by Component (2019)
Figure 117: South America Process Simulation Software in Oil and Gas Market Share Analysis, by Component (2027)
Figure 118: South America Process Simulation Software in Oil and Gas Market Share Analysis, by Component, By Software (2019)
Figure 119: South America Process Simulation Software in Oil and Gas Market Share Analysis, by Component, By Software (2027)
Figure 120: South America Process Simulation Software in Oil and Gas Market Share Analysis, by Component, By Service (2019)
Figure 121: South America Process Simulation Software in Oil and Gas Market Share Analysis, by Component, By Service (2027)
Figure 122: South America Process Simulation Software in Oil and Gas Market, by Operation Type (2019)
Figure 123: South America Process Simulation Software in Oil and Gas Market, by Operation Type (2027)
Figure 124: South America Process Simulation Software in Oil and Gas Market, by Application (2019)
Figure 125: South America Process Simulation Software in Oil and Gas Market, by Application (2027)
Figure 126: South America Process Simulation Software in Oil and Gas Market Share Analysis, by Application, by Upstream (2019)
Figure 127: South America Process Simulation Software in Oil and Gas Market Share Analysis, by Application, by Upstream (2027)
Figure 128: South America Process Simulation Software in Oil and Gas Market Share Analysis, by Application, by Midstream (2019)
Figure 129: South America Process Simulation Software in Oil and Gas Market Share Analysis, by Application, by Midstream (2027)
Figure 130: South America Process Simulation Software in Oil and Gas Market Share Analysis, by Application, by Oil & Gas Processing (2019)
Figure 131: South America Process Simulation Software in Oil and Gas Market Share Analysis, by Application, by Oil & Gas Processing (2027)
Figure 132: South America Process Simulation Software in Oil and Gas Market Share Analysis, by Application, by Refining (2019)
Figure 133: South America Process Simulation Software in Oil and Gas Market Share Analysis, by Application, by Refining (2027)
Figure 134: South America Process Simulation Software in Oil and Gas Market Share Analysis, by Application, by Green Engineering (2019)
Figure 135: South America Process Simulation Software in Oil and Gas Market Share Analysis, by Application, by Green Engineering (2027)
Figure 136: South America Process Simulation Software in Oil and Gas Market Share Analysis, by Country (2019)
Figure 137: South America Process Simulation Software in Oil and Gas Market Share Analysis, by Country (2027)
Figure 138: Global Process Simulation Software Market Share Analysis (2018)
Copyright © Transparency Market Research, Inc. All Rights reserved
Trust Online

Process Simulation Software in Oil and Gas Market