
Reports
Reports
Manufacturers in the potato flakes market are teaming up to develop record-sized potato drying drums to increase their production capabilities. For instance, food processing companies - Idaho Steel and Kiremko - have teamed up to build drum dryers that provide an exuberant output of potato flakes within a matter of few hours. Manufacturers in the potato flakes landscape are innovating the newest technologies to increase their production capacities of drum dryers. They are increasing efforts in R&D to build multipurpose drum dryers that not only dry potato mash but also mill the mash into flakes or powder.
With the introduction of high-tech drum dryers, manufacturers in the potato flakes market are gaining credibility on a global level by providing state-of-the-art turnkey solutions to the potato industry. Latest design innovations in drum dryers help in the production of premium-quality food products. In this way, manufacturers in the potato flakes market are capable of fulfilling the global consumer demand for high-quality potato products. To maintain longer and stronger partnership ties, companies are aiming to strengthen their partnerships by onboarding individuals with the best engineering talent. They are investing in manpower to achieve common organizational objectives, such as the development of leading technology in the market. In order to use these leading technologies to their full potential, companies are launching training programs to educate employees about the various functions of drum dryers through factory visits, workshops, and assembly-line inspections.
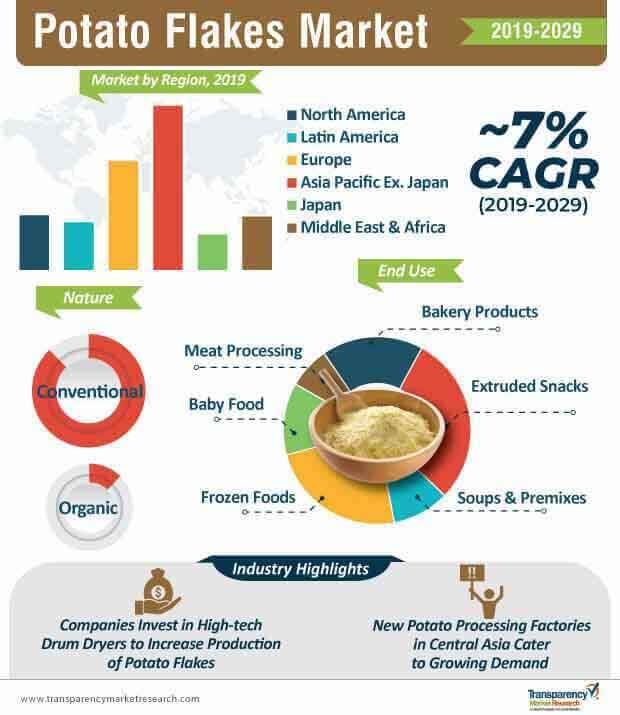
There is the growing emergence of new potato processing factories in Central Asia. Ever-increasing population growth is one of the key factors for the increased consumption of potatoes. Thus, manufacturers in the potato flakes market are eyeing strategic growth in Central Asia, since there aren’t many large-scale food processing factories in the region. In this way, they are able to gain a monopoly in the region’s market landscape. In order to achieve dominance in the region, manufacturers in the potato flakes ecosystem are streamlining their production activities by utilizing the best potatoes grown in domestic farms. This is justified, since the organic production of potato flakes is gaining impetus on a global level, as compared to the production of conventionally-produced potatoes.
The potato flakes market is flourishing in Central Asia due to increasing population growth. Companies in the potato flakes landscape have seen a shift in the production practices of the region, since increased population has led to the large-scale cultivation of potatoes. As such, companies are adopting modern technologies of cultivation, such as mechanized irrigation and harvesting. They are importing high-quality potatoes from other counties to strengthen the domestic supply chain in countries in Central Asia.
Certain challenges in the potato flakes landscape are predicted to negatively influence market growth. For instance, rapid development of food factories in developed and developing economies has added to the environmental stress. Due to this, strict regulations have been implemented by governments to minimize the environmental impact caused as a result of pollution, emissions, and excessive energy and water consumption. The emergence of new potato processing factories is contributing to the global revenue growth of the potato flakes market. But factors such as solid waste generation and negative impacts on the aquatic habitat have given rise to strict regulations in the potato flakes space.
There is the growing need to improve water and energy efficiency for potato processing factories. To overcome the challenges in food processing, companies in the potato flakes market are adopting two key operations - non-thermal processing and membrane processes. To achieve higher water efficiency, companies are practicing reconditioning treatments that help reuse water for other purposes than just potato processing. To reduce the volumes of food processing waste, companies in the potato flakes market are relying on the production of renewable energy, since potatoes are rich in various carbohydrates such as starch, cellulose, and hemicellulose. These practices help improve the bottom line of companies. Newer technologies such as molecular interactions via microwaves are gaining increased acceptance to achieve energy efficiency. Non-thermal methods also provide increased energy efficiency, and help minimize the impact on the nutritional and sensory attributes of food products.
Analysts’ Viewpoint
The growing trend of ready-to-eat food is one of the key drivers for the exponential growth of the potato flakes market. Consumers are exploring ingenious ways to use instant potato flakes to make crispy meat cuisines, and provide the added texture and consistency in meals. However, potatoes are found to have increased amounts of carbohydrates and fat, which is creating a resistance for their adoption from health-conscious consumers. Hence, companies are capitalizing on alternative requirements, such as the growing need for potato starch, which serves as a substitute to processed potato flour. Companies should focus on increasing their production capabilities in regions such as Central Asia that are comparatively lenient in terms of import and export tariff duties.
Potato Flakes Market: Overview
Escalating Demand for Potato Flakes from Bakery Industry
Potato Flakes Market: Increasing Penetration of Established Players
Potato Flakes Market: Competitive Landscape
Potato Flakes Market: Key Developments
Some of the key developments in the potato flakes market during the past few years are as follows:
1. Global Potato Flake Market - Executive Summary
1.1. Global Potato Flake Market Country Analysis
1.2. Vertical Specific Market Penetration
1.3. Application – Product Mapping
1.4. Competition Blueprint
1.5. Technology Time Line Mapping
1.6. FMI Analysis and Recommendations
2. Market Overview
2.1. Market Introduction
2.2. Market Definition
2.3. Market Taxonomy
3. Consumer Behavior and Attitude Measurement
3.1. Deciphering Consumer Buying Pattern
3.2. What are Suppliers Criterion’s
3.3. Decrypting Channel Preferences
3.4. Product Visibility at Channel Shelves and Analysis of the Proposals
3.5. Impact of Labelling, Claims, and Certifications
3.6. Metamorphosis in Consumer Behavior
3.7. Prime Tendencies
3.8. Social & Economic Influencers – Factors
4. Market Tendencies & Latest Buzz
4.1. Standard with Food Legislation
4.2. Labelling Claim
4.3. Food Traceability
4.4. Regional Variance in Preference
4.5. Product and Strategy in – synced Categories
5. Product Launch Track & Trends
5.1. Key Product Launches in Last Three Years
5.2. Product Launch Frequency
5.3. Type of Launches
5.4. Regions and Countries in Focus
5.5. Available Alternatives
5.6. Channel Presence and Likely Impact
6. Market Dynamics
6.1. Macro-economic Factors
6.2.1. Organized Retail Penetration
6.2.2. Per Capita Food Consumption
6.2.3. Population of Key Countries
6.2.4. Increasing Number of Internet Users
6.2.5. Spices, Sauces & Condiments industry Growth
6.2.6. Middle Income Population Group
6.2.7. Retail Sector GVA and Growth
6.3. Opportunities
6.3.1. Cultural Customization to Parsley Specific Population and Ethnic Group
6.3.2. Creating New Delivery Mechanisms
6.3.3. Indication Specific / Parsley Supplement Formulation
6.3.4. Shift Toward Natural Ingredients
6.3.5. Preferential Inclination towards Non-Modified Functional Ingredients
6.3.6. Transformed Packaging to Suit Customer Orientation
6.3.7. Brand Differentiation through Packaging
6.4. Forecast Factors – Relevance and Impact
6.5. Policy Developments and Regulatory Scenario
6.5.1. Regulation by Region
6.5.2. Generally Regarded as Safe (GRAS)
6.5.3. FDA Regulation
6.5.4. Quality Compliances
6.5.4.1. Kosher Certification
6.5.4.2. Organic Certification
7. Key Success Factors
6.1. Powerful Portfolio of Formulation and Brands
7.2. Nuanced Marketing Campaigns
7.3. Exploiting Economies of Scale
7.4. Establishing Flexible Supply Chain to Optimize on Miracle Ingredients
7.5. Strategic Promotional Activity
8. Trade Analysis
6.1. Global Potato Production (Top 15 Countries), 2017
8.2. Key Countries Exporting Potato, 2017
8.3. Key Countries Importing Potato, 2017
8.4. Supplier Concentration for Potatoes, 2017
9. Supply Chain Analysis
6.1. Profitability and Gross Margin Analysis By Competition
9.2. List of Active Participants- By Region
9.2.1. Raw Material Suppliers
9.2.2. Key Manufacturers
9.2.3. Integrators
9.2.4. Key Distributor/Retailers
10. % of Demand Analysis , By Region
10.1. Demand Analysis by Packaging Type
10.1.1. Box
10.1.2. Pouch
10.1.3. Tray
10.1.4. Cup
10.2. Demand Analysis by Price Range
10.2.1. Economy (Less Than $ 15)
10.2.2. Mid-Range ($ 15 to 50)
10.2.3. Premium (More Than $ 50)
10.3. Demand Analysis by Special Diet Needs
10.3.1. Gluten Free
10.3.2. Non-GMO
10.3.3. Kosher
10.3.4. No MSG
10.3.5. Natural
10.3.6. Vegan
10.3.7. Iodized
10.3.8. Salt-Free
10.3.9. Trans Fat-Free
11. Global Potato Flake Market Pricing Analysis
11.1. Price Point Assessment by Product Type
11.2. Regional Average Pricing Analysis
11.2.1. North America
11.2.2. Latin America
11.2.3. Europe
11.2.4. Asia Pacific Ex. Japan (APEJ)
11.2.5. Japan
11.2.6. Oceania
11.2.7. Middle East and Africa
11.3. Price Forecast till 2027
11.4. Factors Influencing Pricing
12. Global Potato Flake Market Analysis and Forecast
12.1. Market Size Analysis (2014-2018) and Forecast (2019-2029)
12.2.1. Market Value (US$ Mn) and Volume (Tons) and Y-o-Y Growth
12.2.2. Absolute $ Opportunity
12.3. Global Potato Flake Market Scenario Forecast (Optimistic, Likely and Conservative Market Conditions)
12.3.1. Forecast Factors and Relevance of Impact
12.3.2. Regional Potato Flake Market Business Performance Summary
13. Global Potato Flake Market Analysis By Nature
13.1. Introduction
13.2.1. Y-o-Y Growth Comparison By Nature
13.2.2. Basis Point Share (BPS) Analysis By Nature
13.3. Potato Flake Market Size (US$ Mn) and Volume (MT) Analysis (2014-2018) & Forecast (2019-2029) By Nature
13.3.1. Organic
13.3.2. Conventional
13.4. Market Attractiveness Analysis By Nature
14. Global Potato Flake Market Analysis By Form
14.1. Introduction
14.1.1. Y-o-Y Growth Comparison By Form
14.1.2. Basis Point Share (BPS) Analysis By Form
14.3. Potato Flake Market Size (US$ Mn) and Volume (MT) Analysis (2014-2018) & Forecast (2019-2029) By Form
14.3.1. Frozen
14.3.2. Dehydrated
14.4. Market Attractiveness Analysis By Form
15. Global Potato Flake Market Analysis By End Use Application
15.1. Introduction
15.1.1. Y-o-Y Growth Comparison By End Use Application
15.1.2. Basis Point Share (BPS) Analysis By End Use Application
15.2. Potato Flake Market Size (US$ Mn) and Volume (MT) Analysis (2014-2018) & Forecast (2019-2029) By End Use Application
15.2.1. Bakery Products
15.2.2. Extruded snacks
15.2.3. Soups & Premixes
15.2.4. Frozen Food
15.2.5. Baby Food
15.2.6. Meat Processing
15.3. Market Attractiveness Analysis By End Use Application
16. Global Potato Flake Market Analysis By Distribution Channel
16.1. Introduction
16.1.1. Y-o-Y Growth Comparison By Distribution Channel
16.1.2. Basis Point Share (BPS) Analysis By Distribution Channel
16.2. Potato Flake Market Size (US$ Mn) and Volume (MT) Analysis (2014-2018) & Forecast (2019-2029) By Distribution Channel
16.2.1. Direct Sales
16.2.1.1. HoReCa
16.2.1.2. Food Industry
16.3.2. Indirect Sales
16.3.2.1. Modern Trade
16.3.2.2. Convenience store
16.3.2.3. Specialty Store
16.3.2.4. Online Retailers
16.3.2.5. Departmental Stores
16.3.2.6. Other distribution channel
16.4. Market Attractiveness Analysis By Distribution Channel
17. Global Potato Flake Market Analysis and Forecast, By Region
17.1. Introduction
17.2.1. Basis Point Share (BPS) Analysis By Region
17.2.2. Y-o-Y Growth Projections By Region
17.3. Potato Flake Market Size (US$ Mn) and Volume (MT) & Forecast (2019-2029) Analysis By Region
17.3.1. North America
17.3.2. Europe
17.3.3. APEJ
17.3.4. Japan
17.3.5. Oceania
17.3.6. Latin America
17.3.7. Middle East and Africa
17.4. Market Attractiveness Analysis By Region
18. North America Potato Flake Market Analysis and Forecast
18.1. Introduction
18.2.1. Basis Point Share (BPS) Analysis By Country
18.2.2. Y-o-Y Growth Projections By Country
18.3. Potato Flake Market Size (Value (US$) and Volume (MT) Analysis (2014-2018) and Forecast (2019-2029)
18.3.1. Market Attractiveness By Country
18.3.1.1. U.S.
18.3.1.2. Canada
18.3.2. By Nature
18.3.3. By Distribution Channel
18.3.4. By End Use Application
18.3.5. By Form
18.4. Market Attractiveness Analysis
18.4.1. By Country
18.4.2. By Nature
18.4.3. By Distribution Channel
18.4.4. By End Use Application
18.4.5. By Form
18.5. Drivers and Restraints: Impact Analysis
19. Latin America Potato Flake Market Analysis and Forecast
19.1. Introduction
19.2.1. Basis Point Share (BPS) Analysis By Country
19.2.2. Y-o-Y Growth Projections By Country
19.2.3. Key Regulations
19.3. Potato Flake Market Size (Value (US$) and Volume (MT) Analysis (2014-2018) and Forecast (2019-2029)
19.3.1. By Country
19.3.1.1. Brazil
19.3.1.2. Mexico
19.3.1.3. Chile
19.3.1.4. Peru
19.3.1.5. Argentina
19.3.1.6. Rest of Latin America
19.3.2. By Nature
19.3.3. By Distribution Channel
19.3.4. By End Use Application
19.3.5. By Form
19.4. Market Attractiveness Analysis
19.4.1. By Country
19.4.2. By Nature
19.4.3. By Distribution Channel
19.4.4. By End Use Application
19.4.5. By Form
20. Europe Potato Flake Market Analysis and Forecast
20.1. Introduction
20.2.1. Basis Point Share (BPS) Analysis By Country
20.2.2. Y-o-Y Growth Projections By Country
20.2.3. Key Regulations
20.3. Potato Flake Market Size (Value (US$) and Volume (MT) Analysis (2014-2018) and Forecast (2019-2029)
20.3.1. By Country
20.3.1.1. EU-4 (Germany, France, Italy, Spain)
20.3.1.2. U.K.
20.3.1.3. BENELUX
20.3.1.4. Nordic
20.3.1.5. Russia
20.3.1.6. Poland
20.3.1.7. Rest of Europe
20.3.2. By Nature
20.3.3. By Distribution Channel
20.3.4. By End Use Application
20.3.5. By Form
20.4. Market Attractiveness Analysis
20.4.1. By Country
20.4.2. By Nature
20.4.3. By Distribution Channel
20.4.4. By End Use Application
20.4.5. By Form
21. APEJ Potato Flake Market Analysis and Forecast
21.1. Introduction
21.2.1. Basis Point Share (BPS) Analysis By Country
21.2.2. Y-o-Y Growth Projections By Country
21.2.3. Key Regulations
21.3. Potato Flake Market Size (Value (US$) and Volume (MT) Analysis (2014-2018) and Forecast (2019-2029)
21.3.1. By Country
21.3.1.1. China
21.3.1.2. India
21.3.1.3. South Korea
21.3.1.4. ASEAN
21.3.2. By Nature
21.3.3. By Distribution Channel
21.3.4. By End Use Application
21.3.5. By Form
21.4. Market Attractiveness Analysis
21.4.1. By Country
21.4.2. By Nature
21.4.3. By Distribution Channel
21.4.4. By End Use Application
21.4.5. By Form
22. Japan Potato Flake Market Analysis and Forecast
22.1. Introduction
22.2.1. Basis Point Share (BPS) Analysis By Country
22.2.2. Y-o-Y Growth Projections By Country
22.2.3. Key Regulations
22.3. Potato Flake Market Size (Value (US$) and Volume (MT) Analysis (2014-2018) and Forecast (2019-2029)
22.3.1. By Nature
22.3.2. By Distribution Channel
22.3.3. By End Use Application
22.3.4. By Form
22.4. Market Attractiveness Analysis
22.4.1. By Nature
22.4.2. By Distribution Channel
22.4.3. By End Use Application
22.4.4. By Form
23. Oceania Potato Flake Market Analysis and Forecast
23.1. Introduction
23.2.1. Basis Point Share (BPS) Analysis By Country
23.2.2. Y-o-Y Growth Projections By Country
23.2.3. Key Regulations
23.3. Potato Flake Market Size (Value (US$) and Volume (MT) Analysis (2014-2018) and Forecast (2019-2029)
23.3.1. By Nature
23.3.2. By Distribution Channel
23.3.3. By End Use Application
23.3.4. By Form
23.4. Market Attractiveness Analysis
23.4.1. By Nature
23.4.2. By Distribution Channel
23.4.3. By End Use Application
23.4.4. By Form
24. Middle East and Africa (MEA) Potato Flake Market Analysis and Forecast
24.1. Introduction
24.2.1. Basis Point Share (BPS) Analysis By Country
24.2.2. Y-o-Y Growth Projections By Country
24.2.3. Key Regulations
24.3. Potato Flake Market Size (Value (US$) and Volume (MT) Analysis (2014-2018) and Forecast (2019-2029)
24.3.1. By Country
24.3.1.1. GCC Countries
24.3.1.2. South Africa
24.3.1.3. North Africa
24.3.1.4. Rest of MEA
24.3.2. By Nature
24.3.3. By Distribution Channel
24.3.4. By End Use Application
24.3.5. By Form
24.4. Market Attractiveness Analysis
24.4.1. By Country
24.4.2. By Nature
24.4.3. By Distribution Channel
24.4.4. By End Use Application
24.4.5. By Form
25. Competition Assessment
25.1. Global Potato Flake Market Competition - a Dashboard View
25.2. Global Potato Flake Market Structure Analysis
25.3. Global Potato Flake Market Company Share Analysis
25.3.1. For Tier 1 Market Players, 2018
25.3.2. Company Market Share Analysis of Top 10 Players, By Region
25.4. Key Participants Market Presence (Intensity Mapping) by Region
26. Brand Assessment
26.1. Brand Identity (Brand as Product, Brand as Organization, Brand as Person, Brand as Symbol)
26.2. Potato Flake Audience and Positioning (Demographic Segmentation, Geographic Segmentation, Psychographic Segmentation, Situational Segmentation)
26.3. Brand Strategy
27. Key Brands
27.1. Idahoan
27.2. Great Value
27.3. Bob Evans
27.4. Banquet
27.5. Hormel
27.6. Idaho Spuds
27.7. Baf Potato Pearls
27.8. COMPLEATS
27.9. Lieber's
27.10. Night Hawk
27.11. BAF POTATO PEARLS
27.12. Betty Crocker
27.13. Diners Choice
27.14. Gefen
27.15. Green Giant
27.16. Marketside
27.17. Ore-Ida
27.18. Osemm
27.19. RESERS
27.20. Austin Homebrew Supply
27.21. Other key players (As Requested)
28. Competition Deep-dive (Manufacturers/Suppliers)
28.1. Agrarfrost GmbH & Co. KG,
28.2.1. Overview
28.2.2. Product Portfolio
28.2.3. Sales Footprint
28.2.4. Channel Footprint
28.2.4.1. Distributors List
28.2.4.2. Form (Clients)
28.2.5. Strategy Overview
28.2.5.1. Marketing Strategy
28.2.5.2. Culture Strategy
28.2.5.3. Channel Strategy
28.2.6. SWOT Analysis
28.2.7. Financial Analysis
28.2.8. Revenue Share
28.2.8.1. By Nature
28.2.8.2. By Region
28.2.9. Key Clients
28.2.10. Analyst Comments
28.3. Basic American Foods, Inc.,
28.3.1. Overview
28.3.2. Product Portfolio
28.3.3. Sales Footprint
28.3.4. Channel Footprint
28.3.4.1. Distributors List
28.3.4.2. Form (Clients)
28.3.5. Strategy Overview
28.3.5.1. Marketing Strategy
28.3.5.2. Culture Strategy
28.3.5.3. Channel Strategy
28.3.6. SWOT Analysis
28.3.7. Financial Analysis
28.3.8. Revenue Share
28.3.8.1. By Nature
28.3.8.2. By Region
28.3.9. Key Clients
28.3.10. Analyst Comments
28.4. Bem Brasil Alimentos LTDA
28.4.1. Overview
28.4.2. Product Portfolio
28.4.3. Sales Footprint
28.4.4. Channel Footprint
28.4.4.1. Distributors List
28.4.4.2. Form (Clients)
28.4.5. Strategy Overview
28.4.5.1. Marketing Strategy
28.4.5.2. Culture Strategy
28.4.5.3. Channel Strategy
28.4.6. SWOT Analysis
28.4.7. Financial Analysis
28.4.8. Revenue Share
28.4.8.1. By Nature
28.4.8.2. By Region
28.4.9. Key Clients
28.4.10. Analyst Comments
28.5. Bob's Red Mill Natural Foods, Inc.
28.5.1. Overview
28.5.2. Product Portfolio
28.5.3. Sales Footprint
28.5.4. Channel Footprint
28.5.4.1. Distributors List
28.5.4.2. Form (Clients)
28.5.5. Strategy Overview
28.5.5.1. Marketing Strategy
28.5.5.2. Culture Strategy
28.5.5.3. Channel Strategy
28.5.6. SWOT Analysis
28.5.7. Financial Analysis
28.5.8. Revenue Share
28.5.8.1. By Nature
28.5.8.2. By Region
28.5.9. Key Clients
28.5.10. Analyst Comments
28.6. Clarebout Potatoes NV
28.6.1. Overview
28.6.2. Product Portfolio
28.6.3. Sales Footprint
28.6.4. Channel Footprint
28.6.4.1. Distributors List
28.6.4.2. Form (Clients)
28.6.5. Strategy Overview
28.6.5.1. Marketing Strategy
28.6.5.2. Culture Strategy
28.6.5.3. Channel Strategy
28.6.6. SWOT Analysis
28.6.7. Financial Analysis
28.6.8. Revenue Share
28.6.8.1. By Nature
28.6.8.2. By Region
28.6.9. Key Clients
28.6.10. Analyst Comments
28.7. Emsland-Stärke GmbH
28.7.1. Overview
28.7.2. Product Portfolio
28.7.3. Sales Footprint
28.7.4. Channel Footprint
28.7.4.1. Distributors List
28.7.4.2. Form (Clients)
28.7.5. Strategy Overview
28.7.5.1. Marketing Strategy
28.7.5.2. Culture Strategy
28.7.5.3. Channel Strategy
28.7.6. SWOT Analysis
28.7.7. Financial Analysis
28.7.8. Revenue Share
28.7.8.1. By Nature
28.7.8.2. By Region
28.7.9. Key Clients
28.7.10. Analyst Comments
28.8. Goodrich Cereals
28.8.1. Overview
28.8.2. Product Portfolio
28.8.3. Sales Footprint
28.8.4. Channel Footprint
28.8.4.1. Distributors List
28.8.4.2. Form (Clients)
28.8.5. Strategy Overview
28.8.5.1. Marketing Strategy
28.8.5.2. Culture Strategy
28.8.5.3. Channel Strategy
28.8.6. SWOT Analysis
28.8.7. Financial Analysis
28.8.8. Revenue Share
28.8.8.1. By Nature
28.8.8.2. By Region
28.8.9. Key Clients
28.8.10. Analyst Comments
28.9. Idahoan Foods, LLC.
28.9.1. Overview
28.9.2. Product Portfolio
28.9.3. Sales Footprint
28.9.4. Channel Footprint
28.9.4.1. Distributors List
28.9.4.2. Form (Clients)
28.9.5. Strategy Overview
28.9.5.1. Marketing Strategy
28.9.5.2. Culture Strategy
28.9.5.3. Channel Strategy
28.9.6. SWOT Analysis
28.9.7. Financial Analysis
28.9.8. Revenue Share
28.9.8.1. By Nature
28.9.8.2. By Region
28.9.9. Key Clients
28.9.10. Analyst Comments
28.10. Iscon Balaji Foods Pvt Limited
28.10.1. Overview
28.10.2. Product Portfolio
28.10.3. Sales Footprint
28.10.4. Channel Footprint
28.10.4.1. Distributors List
28.10.4.2. Form (Clients)
28.10.5. Strategy Overview
28.10.5.1. Marketing Strategy
28.10.5.2. Culture Strategy
28.10.5.3. Channel Strategy
28.10.6. SWOT Analysis
28.10.7. Financial Analysis
28.10.8. Revenue Share
28.10.8.1. By Nature
28.10.8.2. By Region
28.10.9. Key Clients
28.10.10. Analyst Comments
28.11. Lamb Weston Holdings, Inc.
28.11.1. Overview
28.11.2. Product Portfolio
28.11.3. Sales Footprint
28.11.4. Channel Footprint
28.11.4.1. Distributors List
28.11.4.2. Form (Clients)
28.11.5. Strategy Overview
28.11.5.1. Marketing Strategy
28.11.5.2. Culture Strategy
28.11.5.3. Channel Strategy
28.11.6. SWOT Analysis
28.11.7. Financial Analysis
28.11.8. Revenue Share
28.11.8.1. By Nature
28.11.8.2. By Region
28.11.9. Key Clients
28.11.10. Analyst Comments
28.12. Lutosa SA
28.12.1. Overview
28.12.2. Product Portfolio
28.12.3. Sales Footprint
28.12.4. Channel Footprint
28.12.4.1. Distributors List
28.12.4.2. Form (Clients)
28.12.5. Strategy Overview
28.12.5.1. Marketing Strategy
28.12.5.2. Culture Strategy
28.12.5.3. Channel Strategy
28.12.6. SWOT Analysis
28.12.7. Financial Analysis
28.12.8. Revenue Share
28.12.8.1. By Nature
28.12.8.2. By Region
28.12.9. Key Clients
28.12.10. Analyst Comments
28.13. McCain Foods Limited
28.13.1. Overview
28.13.2. Product Portfolio
28.13.3. Sales Footprint
28.13.4. Channel Footprint
28.13.4.1. Distributors List
28.13.4.2. Form (Clients)
28.13.5. Strategy Overview
28.13.5.1. Marketing Strategy
28.13.5.2. Culture Strategy
28.13.5.3. Channel Strategy
28.13.6. SWOT Analysis
28.13.7. Financial Analysis
28.13.8. Revenue Share
28.13.8.1. By Nature
28.13.8.2. By Region
28.13.9. Key Clients
28.13.10. Analyst Comments
28.14. Nahr-Engel GmbH
28.14.1. Overview
28.14.2. Product Portfolio
28.14.3. Sales Footprint
28.14.4. Channel Footprint
28.14.4.1. Distributors List
28.14.4.2. Form (Clients)
28.14.5. Strategy Overview
28.14.5.1. Marketing Strategy
28.14.5.2. Culture Strategy
28.14.5.3. Channel Strategy
28.14.6. SWOT Analysis
28.14.7. Financial Analysis
28.14.8. Revenue Share
28.14.8.1. By Nature
28.14.8.2. By Region
28.14.9. Key Clients
28.14.10. Analyst Comments
28.15. Oregon Potato Co.
28.15.1. Overview
28.15.2. Product Portfolio
28.15.3. Sales Footprint
28.15.4. Channel Footprint
28.15.4.1. Distributors List
28.15.4.2. Form (Clients)
28.15.5. Strategy Overview
28.15.5.1. Marketing Strategy
28.15.5.2. Culture Strategy
28.15.5.3. Channel Strategy
28.15.6. SWOT Analysis
28.15.7. Financial Analysis
28.15.8. Revenue Share
28.15.8.1. By Nature
28.15.8.2. By Region
28.15.9. Key Clients
28.15.10. Analyst Comments
28.16. Patwary Potato Flakes Ltd
28.16.1. Overview
28.16.2. Product Portfolio
28.16.3. Sales Footprint
28.16.4. Channel Footprint
28.16.4.1. Distributors List
28.16.4.2. Form (Clients)
28.16.5. Strategy Overview
28.16.5.1. Marketing Strategy
28.16.5.2. Culture Strategy
28.16.5.3. Channel Strategy
28.16.6. SWOT Analysis
28.16.7. Financial Analysis
28.16.8. Revenue Share
28.16.8.1. By Nature
28.16.8.2. By Region
28.16.9. Key Clients
28.16.10. Analyst Comments
28.17. Rixona B.V.
28.17.1. Overview
28.17.2. Product Portfolio
28.17.3. Sales Footprint
28.17.4. Channel Footprint
28.17.4.1. Distributors List
28.17.4.2. Form (Clients)
28.17.5. Strategy Overview
28.17.5.1. Marketing Strategy
28.17.5.2. Culture Strategy
28.17.5.3. Channel Strategy
28.17.6. SWOT Analysis
28.17.7. Financial Analysis
28.17.8. Revenue Share
28.17.8.1. By Nature
28.17.8.2. By Region
28.17.9. Key Clients
28.17.10. Analyst Comments
28.18. PepsiCo
28.18.1. Overview
28.18.2. Product Portfolio
28.18.3. Sales Footprint
28.18.4. Channel Footprint
28.18.4.1. Distributors List
28.18.4.2. Form (Clients)
28.18.5. Strategy Overview
28.18.5.1. Marketing Strategy
28.18.5.2. Culture Strategy
28.18.5.3. Channel Strategy
28.18.6. SWOT Analysis
28.18.7. Financial Analysis
28.18.8. Revenue Share
28.18.8.1. By Nature
28.18.8.2. By Region
28.18.9. Key Clients
28.18.10. Analyst Comments
28.19. General Mills
28.19.1. Overview
28.19.2. Product Portfolio
28.19.3. Sales Footprint
28.19.4. Channel Footprint
28.19.4.1. Distributors List
28.19.4.2. Form (Clients)
28.19.5. Strategy Overview
28.19.5.1. Marketing Strategy
28.19.5.2. Culture Strategy
28.19.5.3. Channel Strategy
28.19.6. SWOT Analysis
28.19.7. Financial Analysis
28.19.8. Revenue Share
28.19.8.1. By Nature
28.19.8.2. By Region
28.19.9. Key Clients
28.19.10. Analyst Comments
28.20. Kellogg
28.20.1. Overview
28.20.2. Product Portfolio
28.20.3. Sales Footprint
28.20.4. Channel Footprint
28.20.4.1. Distributors List
28.20.4.2. Form (Clients)
28.20.5. Strategy Overview
28.20.5.1. Marketing Strategy
28.20.5.2. Culture Strategy
28.20.5.3. Channel Strategy
28.20.6. SWOT Analysis
28.20.7. Financial Analysis
28.20.8. Revenue Share
28.20.8.1. By Nature
28.20.8.2. By Region
28.20.9. Key Clients
28.20.10. Analyst Comments
28.21. Albert'S Organic
28.21.1. Overview
28.21.2. Product Portfolio
28.21.3. Sales Footprint
28.21.4. Channel Footprint
28.21.4.1. Distributors List
28.21.4.2. Form (Clients)
28.21.5. Strategy Overview
28.21.5.1. Marketing Strategy
28.21.5.2. Culture Strategy
28.21.5.3. Channel Strategy
28.21.6. SWOT Analysis
28.21.7. Financial Analysis
28.21.8. Revenue Share
28.21.8.1. By Nature
28.21.8.2. By Region
28.21.9. Key Clients
28.21.10. Analyst Comments
28.22. The American Golden Foods
28.22.1. Overview
28.22.2. Product Portfolio
28.22.3. Sales Footprint
28.22.4. Channel Footprint
28.22.4.1. Distributors List
28.22.4.2. Form (Clients)
28.22.5. Strategy Overview
28.22.5.1. Marketing Strategy
28.22.5.2. Culture Strategy
28.22.5.3. Channel Strategy
28.22.6. SWOT Analysis
28.22.7. Financial Analysis
28.22.8. Revenue Share
28.22.8.1. By Nature
28.22.8.2. By Region
28.22.9. Key Clients
28.22.10. Analyst Comments
28.23. Nestle SA
28.23.1. Overview
28.23.2. Product Portfolio
28.23.3. Sales Footprint
28.23.4. Channel Footprint
28.23.4.1. Distributors List
28.23.4.2. Form (Clients)
28.23.5. Strategy Overview
28.23.5.1. Marketing Strategy
28.23.5.2. Culture Strategy
28.23.5.3. Channel Strategy
28.23.6. SWOT Analysis
28.23.7. Financial Analysis
28.23.8. Revenue Share
28.23.8.1. By Nature
28.23.8.2. By Region
28.23.9. Key Clients
28.23.10. Analyst Comments
28.24. Orion Corporation
28.24.1. Overview
28.24.2. Product Portfolio
28.24.3. Sales Footprint
28.24.4. Channel Footprint
28.24.4.1. Distributors List
28.24.4.2. Form (Clients)
28.24.5. Strategy Overview
28.24.5.1. Marketing Strategy
28.24.5.2. Culture Strategy
28.24.5.3. Channel Strategy
28.24.6. SWOT Analysis
28.24.7. Financial Analysis
28.24.8. Revenue Share
28.24.8.1. By Nature
28.24.8.2. By Region
28.24.9. Key Clients
28.24.10. Analyst Comments
28.25. Desai Brothers Ltd.
28.25.1. Overview
28.25.2. Product Portfolio
28.25.3. Sales Footprint
28.25.4. Channel Footprint
28.25.4.1. Distributors List
28.25.4.2. Form (Clients)
28.25.5. Strategy Overview
28.25.5.1. Marketing Strategy
28.25.5.2. Culture Strategy
28.25.5.3. Channel Strategy
28.25.6. SWOT Analysis
28.25.7. Financial Analysis
28.25.8. Revenue Share
28.25.8.1. By Nature
28.25.8.2. By Region
28.25.9. Key Clients
28.25.10. Analyst Comments
28.26. Pruthvi's Foods Private Limited
28.26.1. Overview
28.26.2. Product Portfolio
28.26.3. Sales Footprint
28.26.4. Channel Footprint
28.26.4.1. Distributors List
28.26.4.2. Form (Clients)
28.26.5. Strategy Overview
28.26.5.1. Marketing Strategy
28.26.5.2. Culture Strategy
28.26.5.3. Channel Strategy
28.26.6. SWOT Analysis
28.26.7. Financial Analysis
28.26.8. Revenue Share
28.26.8.1. By Nature
28.26.8.2. By Region
28.26.9. Key Clients
28.26.10. Analyst Comments
28.27. V P Food Products
28.27.1. Overview
28.27.2. Product Portfolio
28.27.3. Sales Footprint
28.27.4. Channel Footprint
28.27.4.1. Distributors List
28.27.4.2. Form (Clients)
28.27.5. Strategy Overview
28.27.5.1. Marketing Strategy
28.27.5.2. Culture Strategy
28.27.5.3. Channel Strategy
28.27.6. SWOT Analysis
28.27.7. Financial Analysis
28.27.8. Revenue Share
28.27.8.1. By Nature
28.27.8.2. By Region
28.27.9. Key Clients
28.27.10. Analyst Comments
28.28. Other key players (As Requested)
29. Recommendation- Critical Success Factors
30. Research Methodology Assumptions & Acronyms Used
List of Table
Table 1: Global Potato Flakes Historical Market Value (US$ Mn) Analysis, by Nature, 2014 – 2018
Table 2: Global Potato Flakes Historical Market Volume (MT) Analysis, by Nature, 2014 – 2018
Table 3: Global Potato Flakes Forecast Market Value (US$ Mn) Analysis, by Nature, 2019 – 2029
Table 4: Global Potato Flakes Forecast Market Volume (MT) Analysis, by Nature, 2019 – 2029
Table 5: Global Potato Flakes Historical Market Value (US$ Mn) Analysis, by Form, 2014 – 2018
Table 6: Global Potato Flakes Historical Market Volume (MT) Analysis, by Form, 2014 – 2018
Table 7: Global Potato Flakes Forecast Market Value (US$ Mn) Analysis, by Form, 2019 – 2029
Table 8: Global Potato Flakes Forecast Market Volume (MT) Analysis, by Form, 2019 – 2029
Table 9: Global Potato Flakes Historical Market Value (US$ Mn) Analysis, by End Use, 2014 – 2018
Table 10: Global Potato Flakes Historical Market Volume (MT) Analysis, by End Use, 2014 – 2018
Table 11: Global Potato Flakes Forecast Market Value (US$ Mn) Analysis, by End Use, 2019 – 2029
Table 12: Global Potato Flakes Forecast Market Volume (MT) Analysis, by End Use, 2019 – 2029
Table 13: Global Potato Flakes Historical Market Value (US$ Mn) Analysis, by Distribution Channel, 2014 – 2018
Table 14: Global Potato Flakes Historical Market Volume (MT) Analysis, by Distribution Channel, 2014 – 2018
Table 15: Global Potato Flakes Forecast Market Value (US$ Mn) Analysis, by Distribution Channel, 2019 – 2029
Table 16: Global Potato Flakes Forecast Market Volume (MT) Analysis, by Distribution Channel, 2019 – 2029
Table 17: Global Potato Flakes Historical Market Value (US$ Mn) Analysis, by Region, 2014 – 2018
Table 18: Global Potato Flakes Historical Market Volume (MT) Analysis, by Region, 2014 – 2018
Table 19: Global Potato Flakes Forecast Market Value (US$ Mn) Analysis, by Region, 2019 – 2029
Table 20: Global Potato Flakes Forecast Market Volume (MT) Analysis, by Region, 2019 – 2029
Table 21: North America Potato Flakes Historical Market Value (US$ Mn) Analysis, by Nature, 2014 – 2018
Table 22: North America Potato Flakes Historical Market Volume (MT) Analysis, by Nature, 2014 – 2018
Table 23: North America Potato Flakes Forecast Market Value (US$ Mn) Analysis, by Nature, 2019 – 2029
Table 24: North America Potato Flakes Forecast Market Volume (MT) Analysis, by Nature, 2019 – 2029
Table 25: North America Potato Flakes Historical Market Value (US$ Mn) Analysis, by Form, 2014 – 2018
Table 26: North America Potato Flakes Historical Market Volume (MT) Analysis, by Form, 2014 – 2018
Table 27: North America Potato Flakes Forecast Market Value (US$ Mn) Analysis, by Form, 2019 – 2029
Table 28: North America Potato Flakes Forecast Market Volume (MT) Analysis, by Form, 2019 – 2029
Table 29: North America Potato Flakes Historical Market Value (US$ Mn) Analysis, by End Use, 2014 – 2018
Table 30: North America Potato Flakes Historical Market Volume (MT) Analysis, by End Use, 2014 – 2018
Table 31: North America Potato Flakes Forecast Market Value (US$ Mn) Analysis, by End Use, 2019 – 2029
Table 32: North America Potato Flakes Forecast Market Volume (MT) Analysis, by End Use, 2019 – 2029
Table 33: North America Potato Flakes Historical Market Value (US$ Mn) Analysis, by Distribution Channel, 2014 – 2018
Table 34: North America Potato Flakes Historical Market Volume (MT) Analysis, by Distribution Channel, 2014 – 2018
Table 35: North America Potato Flakes Forecast Market Value (US$ Mn) Analysis, by Distribution Channel, 2019 – 2029
Table 36: North America Potato Flakes Forecast Market Volume (MT) Analysis, by Distribution Channel, 2019 – 2029
Table 37: North America Potato Flakes Historical Market Value (US$ Mn) Analysis, by Country, 2014 – 2018
Table 38: North America Potato Flakes Historical Market Volume (MT) Analysis, by Country, 2014 – 2018
Table 39: North America Potato Flakes Forecast Market Value (US$ Mn) Analysis, by Country, 2019 – 2029
Table 40: North America Potato Flakes Forecast Market Volume (MT) Analysis, by Country, 2019 – 2029
Table 41: Latin America Potato Flakes Historical Market Value (US$ Mn) Analysis, by Nature, 2014 – 2018
Table 42: Latin America Potato Flakes Historical Market Volume (MT) Analysis, by Nature, 2014 – 2018
Table 43: Latin America Potato Flakes Forecast Market Value (US$ Mn) Analysis, by Nature, 2019 – 2029
Table 44: Latin America Potato Flakes Forecast Market Volume (MT) Analysis, by Nature, 2019 – 2029
Table 45: Latin America Potato Flakes Historical Market Value (US$ Mn) Analysis, by Form, 2014 – 2018
Table 46: Latin America Potato Flakes Historical Market Volume (MT) Analysis, by Form, 2014 – 2018
Table 47: Latin America Potato Flakes Forecast Market Value (US$ Mn) Analysis, by Form, 2019 – 2029
Table 48: Latin America Potato Flakes Forecast Market Volume (MT) Analysis, by Form, 2019 – 2029
Table 49: Latin America Potato Flakes Historical Market Value (US$ Mn) Analysis, by End Use, 2014 – 2018
Table 50: Latin America Potato Flakes Historical Market Volume (MT) Analysis, by End Use, 2014 – 2018
Table 51: Latin America Potato Flakes Forecast Market Value (US$ Mn) Analysis, by End Use, 2019 – 2029
Table 52: Latin America Potato Flakes Forecast Market Volume (MT) Analysis, by End Use, 2019 – 2029
Table 53: Latin America Potato Flakes Historical Market Value (US$ Mn) Analysis, by Distribution Channel, 2014 – 2018
Table 54: Latin America Potato Flakes Historical Market Volume (MT) Analysis, by Distribution Channel, 2014 – 2018
Table 55: Latin America Potato Flakes Forecast Market Value (US$ Mn) Analysis, by Distribution Channel, 2019 – 2029
Table 56: Latin America Potato Flakes Forecast Market Volume (MT) Analysis, by Distribution Channel, 2019 – 2029
Table 57: Latin America Potato Flakes Historical Market Value (US$ Mn) Analysis, by Country, 2014 – 2018
Table 58: Latin America Potato Flakes Historical Market Volume (MT) Analysis, by Country, 2014 – 2018
Table 59: Latin America Potato Flakes Forecast Market Value (US$ Mn) Analysis, by Country, 2019 – 2029
Table 60: Latin America Potato Flakes Forecast Market Volume (MT) Analysis, by Country, 2019 – 2029
Table 61: Europe Potato Flakes Historical Market Value (US$ Mn) Analysis, by Nature, 2014 – 2018
Table 62: Europe Potato Flakes Historical Market Volume (MT) Analysis, by Nature, 2014 – 2018
Table 63: Europe Potato Flakes Forecast Market Value (US$ Mn) Analysis, by Nature, 2019 – 2029
Table 64: Europe Potato Flakes Forecast Market Volume (MT) Analysis, by Nature, 2019 – 2029
Table 65: Europe Potato Flakes Historical Market Value (US$ Mn) Analysis, by Form, 2014 – 2018
Table 66: Europe Potato Flakes Historical Market Volume (MT) Analysis, by Form, 2014 – 2018
Table 67: Europe Potato Flakes Forecast Market Value (US$ Mn) Analysis, by Form, 2019 – 2029
Table 68: Europe Potato Flakes Forecast Market Volume (MT) Analysis, by Form, 2019 – 2029
Table 69: Europe Potato Flakes Historical Market Value (US$ Mn) Analysis, by End Use, 2014 – 2018
Table 70: Europe Potato Flakes Historical Market Volume (MT) Analysis, by End Use, 2014 – 2018
Table 71: Europe Potato Flakes Forecast Market Value (US$ Mn) Analysis, by End Use, 2019 – 2029
Table 72: Europe Potato Flakes Forecast Market Volume (MT) Analysis, by End Use, 2019 – 2029
Table 73: Europe Potato Flakes Historical Market Value (US$ Mn) Analysis, by Distribution Channel, 2014 – 2018
Table 74: Europe Potato Flakes Historical Market Volume (MT) Analysis, by Distribution Channel, 2014 – 2018
Table 75: Europe Potato Flakes Forecast Market Value (US$ Mn) Analysis, by Distribution Channel, 2019 – 2029
Table 76: Europe Potato Flakes Forecast Market Volume (MT) Analysis, by Distribution Channel, 2019 – 2029
Table 77: Europe Potato Flakes Historical Market Value (US$ Mn) Analysis, by Country, 2014 – 2018
Table 78: Europe Potato Flakes Historical Market Volume (MT) Analysis, by Country, 2014 – 2018
Table 79: Europe Potato Flakes Forecast Market Value (US$ Mn) Analysis, by Country, 2019 – 2029
Table 80: Europe Potato Flakes Forecast Market Volume (MT) Analysis, by Country, 2019 – 2029
Table 81: Asia Pacific Potato Flakes Historical Market Value (US$ Mn) Analysis, by Nature, 2014 – 2018
Table 82: Asia Pacific Potato Flakes Historical Market Volume (MT) Analysis, by Nature, 2014 – 2018
Table 83: Asia Pacific Potato Flakes Forecast Market Value (US$ Mn) Analysis, by Nature, 2019 – 2029
Table 84: Asia Pacific Potato Flakes Forecast Market Volume (MT) Analysis, by Nature, 2019 – 2029
Table 85: Asia Pacific Potato Flakes Historical Market Value (US$ Mn) Analysis, by Form, 2014 – 2018
Table 86: Asia Pacific Potato Flakes Historical Market Volume (MT) Analysis, by Form, 2014 – 2018
Table 87: Asia Pacific Potato Flakes Forecast Market Value (US$ Mn) Analysis, by Form, 2019 – 2029
Table 88: Asia Pacific Potato Flakes Forecast Market Volume (MT) Analysis, by Form, 2019 – 2029
Table 89: Asia Pacific Potato Flakes Historical Market Value (US$ Mn) Analysis, by End Use, 2014 – 2018
Table 90: Asia Pacific Potato Flakes Historical Market Volume (MT) Analysis, by End Use, 2014 – 2018
Table 91: Asia Pacific Potato Flakes Forecast Market Value (US$ Mn) Analysis, by End Use, 2019 – 2029
Table 92: Asia Pacific Potato Flakes Forecast Market Volume (MT) Analysis, by End Use, 2019 – 2029
Table 93: Asia Pacific Potato Flakes Historical Market Value (US$ Mn) Analysis, by Distribution Channel, 2014 – 2018
Table 94: Asia Pacific Potato Flakes Historical Market Volume (MT) Analysis, by Distribution Channel, 2014 – 2018
Table 95: Asia Pacific Potato Flakes Forecast Market Value (US$ Mn) Analysis, by Distribution Channel, 2019 – 2029
Table 96: Asia Pacific Potato Flakes Forecast Market Volume (MT) Analysis, by Distribution Channel, 2019 – 2029
Table 97: Asia Pacific Potato Flakes Historical Market Value (US$ Mn) Analysis, by Country, 2014 – 2018
Table 98: Asia Pacific Potato Flakes Historical Market Volume (MT) Analysis, by Country, 2014 – 2018
Table 99: Asia Pacific Potato Flakes Forecast Market Value (US$ Mn) Analysis, by Country, 2019 – 2029
Table 100: Asia Pacific Potato Flakes Forecast Market Volume (MT) Analysis, by Country, 2019 – 2029
Table 101: Japan Potato Flakes Historical Market Value (US$ Mn) Analysis, by Nature, 2014 – 2018
Table 102: Japan Potato Flakes Historical Market Volume (MT) Analysis, by Nature, 2014 – 2018
Table 103: Japan Potato Flakes Forecast Market Value (US$ Mn) Analysis, by Nature, 2019 – 2029
Table 104: Japan Potato Flakes Forecast Market Volume (MT) Analysis, by Nature, 2019 – 2029
Table 105: Japan Potato Flakes Historical Market Value (US$ Mn) Analysis, by Form, 2014 – 2018
Table 106: Japan Potato Flakes Historical Market Volume (MT) Analysis, by Form, 2014 – 2018
Table 107: Japan Potato Flakes Forecast Market Value (US$ Mn) Analysis, by Form, 2019 – 2029
Table 108: Japan Potato Flakes Forecast Market Volume (MT) Analysis, by Form, 2019 – 2029
Table 109: Japan Potato Flakes Historical Market Value (US$ Mn) Analysis, by End Use, 2014 – 2018
Table 110: Japan Potato Flakes Historical Market Volume (MT) Analysis, by End Use, 2014 – 2018
Table 111: Japan Potato Flakes Forecast Market Value (US$ Mn) Analysis, by End Use, 2019 – 2029
Table 112: Japan Potato Flakes Forecast Market Volume (MT) Analysis, by End Use, 2019 – 2029
Table 113: Japan Potato Flakes Historical Market Value (US$ Mn) Analysis, by Distribution Channel, 2014 – 2018
Table 114: Japan Potato Flakes Historical Market Volume (MT) Analysis, by Distribution Channel, 2014 – 2018
Table 115: Japan Potato Flakes Forecast Market Value (US$ Mn) Analysis, by Distribution Channel, 2019 – 2029
Table 116: Japan Potato Flakes Forecast Market Volume (MT) Analysis, by Distribution Channel, 2019 – 2029
Table 117: Oceania Potato Flakes Historical Market Value (US$ Mn) Analysis, by Nature, 2014 – 2018
Table 118: Oceania Potato Flakes Historical Market Volume (MT) Analysis, by Nature, 2014 – 2018
Table 119: Oceania Potato Flakes Forecast Market Value (US$ Mn) Analysis, by Nature, 2019 – 2029
Table 120: Oceania Potato Flakes Forecast Market Volume (MT) Analysis, by Nature, 2019 – 2029
Table 121: Oceania Potato Flakes Historical Market Value (US$ Mn) Analysis, by Form, 2014 – 2018
Table 122: Oceania Potato Flakes Historical Market Volume (MT) Analysis, by Form, 2014 – 2018
Table 123: Oceania Potato Flakes Forecast Market Value (US$ Mn) Analysis, by Form, 2019 – 2029
Table 124: Oceania Potato Flakes Forecast Market Volume (MT) Analysis, by Form, 2019 – 2029
Table 125: Oceania Potato Flakes Historical Market Value (US$ Mn) Analysis, by End Use, 2014 – 2018
Table 126: Oceania Potato Flakes Historical Market Volume (MT) Analysis, by End Use, 2014 – 2018
Table 127: Oceania Potato Flakes Forecast Market Value (US$ Mn) Analysis, by End Use, 2019 – 2029
Table 128: Oceania Potato Flakes Forecast Market Volume (MT) Analysis, by End Use, 2019 – 2029
Table 129: Oceania Potato Flakes Historical Market Value (US$ Mn) Analysis, by Distribution Channel, 2014 – 2018
Table 130: Oceania Potato Flakes Historical Market Volume (MT) Analysis, by Distribution Channel, 2014 – 2018
Table 131: Oceania Potato Flakes Forecast Market Value (US$ Mn) Analysis, by Distribution Channel, 2019 – 2029
Table 132: Oceania Potato Flakes Forecast Market Volume (MT) Analysis, by Distribution Channel, 2019 – 2029
Table 133: MEA Potato Flakes Historical Market Value (US$ Mn) Analysis, by Nature, 2014 – 2018
Table 134: MEA Potato Flakes Historical Market Volume (MT) Analysis, by Nature, 2014 – 2018
Table 135: MEA Potato Flakes Forecast Market Value (US$ Mn) Analysis, by Nature, 2019 – 2029
Table 136: MEA Potato Flakes Forecast Market Volume (MT) Analysis, by Nature, 2019 – 2029
Table 137: MEA Potato Flakes Historical Market Value (US$ Mn) Analysis, by Form, 2014 – 2018
Table 138: MEA Potato Flakes Historical Market Volume (MT) Analysis, by Form, 2014 – 2018
Table 139: MEA Potato Flakes Forecast Market Value (US$ Mn) Analysis, by Form, 2019 – 2029
Table 140: MEA Potato Flakes Forecast Market Volume (MT) Analysis, by Form, 2019 – 2029
Table 141: MEA Potato Flakes Historical Market Value (US$ Mn) Analysis, by End Use, 2014 – 2018
Table 142: MEA Potato Flakes Historical Market Volume (MT) Analysis, by End Use, 2014 – 2018
Table 143: MEA Potato Flakes Forecast Market Value (US$ Mn) Analysis, by End Use, 2019 – 2029
Table 144: MEA Potato Flakes Forecast Market Volume (MT) Analysis, by End Use, 2019 – 2029
Table 145: MEA Potato Flakes Historical Market Value (US$ Mn) Analysis, by Distribution Channel, 2014 – 2018
Table 146: MEA Potato Flakes Historical Market Volume (MT) Analysis, by Distribution Channel, 2014 – 2018
Table 147: MEA Potato Flakes Forecast Market Value (US$ Mn) Analysis, by Distribution Channel, 2019 – 2029
Table 148: MEA Potato Flakes Forecast Market Volume (MT) Analysis, by Distribution Channel, 2019 – 2029
Table 149: MEA Potato Flakes Historical Market Value (US$ Mn) Analysis, by Country, 2014 – 2018
Table 150: MEA Potato Flakes Historical Market Volume (MT) Analysis, by Country, 2014 – 2018
Table 151: MEA Potato Flakes Forecast Market Value (US$ Mn) Analysis, by Country, 2019 – 2029
Table 152: MEA Potato Flakes Forecast Market Volume (MT) Analysis, by Country, 2019 – 2029
List of Figures
Figure 1: Global Potato Flakes Market – Scenario Forecast, 2019–2029 (US$ Mn)
Figure 2: Global Potato Flakes Market Size Forecast in terms of Value (US$ Mn) 2019-2029
Figure 3: Global Potato Flakes Market, by Region (US$ Mn), 2019 and 2029
Figure 4: Global Potato Flakes Market Value BPS Analysis, by Nature, 2019 & 2029
Figure 5: Global Potato Flakes Market Value Y-o-Y Growth (%), by Nature, 2019–2029
Figure 6: Global Potato Flakes Market Attractiveness Analysis, by Nature, 2019 & 2029
Figure 7: Global Potato Flakes Market Value BPS Analysis, by Form, 2019 & 2029
Figure 8: Global Potato Flakes Market Value Y-o-Y Growth (%), by Form, 2019–2029
Figure 9: Global Potato Flakes Market Attractiveness Analysis, By Form, 2019 & 2029
Figure 10: Global Potato Flakes Market Value BPS Analysis, by end use, 2019 & 2029
Figure 11: Global Potato Flakes Market Value Y-o-Y Growth (%), by end use, 2019–2029
Figure 12: Global Potato Flakes Market Attractiveness Analysis, by end use, 2019 & 2029
Figure 13: Global Potato Flakes Market Value BPS Analysis, by Distribution Channel, 2019 & 2029
Figure 14: Global Potato Flakes Market Value Y-o-Y Growth (%), by Distribution Channel, 2019–2029
Figure 15: Global Potato Flakes Market Attractiveness Analysis, By Distribution Channel, 2019 & 2029
Figure 16: Global Potato Flakes Market Value BPS Analysis, by Region, 2019 & 2029
Figure 17: Global Potato Flakes Market Value Y-o-Y Growth (%), by Region, 2019–2029
Figure 18: Global Potato Flakes Market Attractiveness Analysis, By Region, 2019 & 2029
Figure 19: North America Potato Flakes Market Value BPS Analysis, by Nature, 2019 & 2029
Figure 20: North America Potato Flakes Market Value Y-o-Y Growth (%), by Nature, 2019–2029
Figure 21: North America Potato Flakes Market Attractiveness Analysis, by Nature, 2019 & 2029
Figure 22: North America Potato Flakes Market Value BPS Analysis, by Form, 2019 & 2029
Figure 23: North America Potato Flakes Market Value Y-o-Y Growth (%), by Form, 2019–2029
Figure 24: North America Potato Flakes Market Attractiveness Analysis, By Form, 2019 & 2029
Figure 25: North America Potato Flakes Market Value BPS Analysis, by end use, 2019 & 2029
Figure 26: North America Potato Flakes Market Value Y-o-Y Growth (%), by end use, 2019–2029
Figure 27: North America Potato Flakes Market Attractiveness Analysis, by end use, 2019 & 2029
Figure 28: North America Potato Flakes Market Value BPS Analysis, by Distribution Channel, 2019 & 2029
Figure 29: North America Potato Flakes Market Value Y-o-Y Growth (%), by Distribution Channel, 2019–2029
Figure 30: North America Potato Flakes Market Attractiveness Analysis, By Distribution Channel, 2019 & 2029
Figure 31: North America Potato Flakes Market Value BPS Analysis, by Country, 2019 & 2029
Figure 32: North America Potato Flakes Market Value Y-o-Y Growth (%), by Country, 2019–2029
Figure 33: North America Potato Flakes Market Attractiveness Analysis, By Country, 2019 & 2029
Figure 34: Latin America Potato Flakes Market Value BPS Analysis, by Nature, 2019 & 2029
Figure 35: Latin America Potato Flakes Market Value Y-o-Y Growth (%), by Nature, 2019–2029
Figure 36: Latin America Potato Flakes Market Attractiveness Analysis, by Nature, 2019 & 2029
Figure 37: Latin America Potato Flakes Market Value BPS Analysis, by Form, 2019 & 2029
Figure 38: Latin America Potato Flakes Market Value Y-o-Y Growth (%), by Form, 2019–2029
Figure 39: Latin America Potato Flakes Market Attractiveness Analysis, By Form, 2019 & 2029
Figure 40: Latin America Potato Flakes Market Value BPS Analysis, by end use, 2019 & 2029
Figure 41: Latin America Potato Flakes Market Value Y-o-Y Growth (%), by end use, 2019–2029
Figure 42: Latin America Potato Flakes Market Attractiveness Analysis, by end use, 2019 & 2029
Figure 43: Latin America Potato Flakes Market Value BPS Analysis, by Distribution Channel, 2019 & 2029
Figure 44: Latin America Potato Flakes Market Value Y-o-Y Growth (%), by Distribution Channel, 2019–2029
Figure 45: Latin America Potato Flakes Market Attractiveness Analysis, By Distribution Channel, 2019 & 2029
Figure 46: Latin America Potato Flakes Market Value BPS Analysis, by Country, 2019 & 2029
Figure 47: Latin America Potato Flakes Market Value Y-o-Y Growth (%), by Country, 2019–2029
Figure 48: Latin America Potato Flakes Market Attractiveness Analysis, By Country, 2019 & 2029
Figure 49: Europe Potato Flakes Market Value BPS Analysis, by nature, 2019 & 2029
Figure 50: Europe Potato Flakes Market Value Y-o-Y Growth (%), by nature, 2019–2029
Figure 51: Europe Potato Flakes Market Attractiveness Analysis, by nature, 2019 & 2029
Figure 52: Europe Potato Flakes Market Value BPS Analysis, by Form, 2019 & 2029
Figure 53: Europe Potato Flakes Market Value Y-o-Y Growth (%), by Form, 2019–2029
Figure 54: Europe Potato Flakes Market Attractiveness Analysis, By Form, 2019 & 2029
Figure 55: Europe Potato Flakes Market Value BPS Analysis, by end use, 2019 & 2029
Figure 56: Europe Potato Flakes Market Value Y-o-Y Growth (%), by end use, 2019–2029
Figure 57: Europe Potato Flakes Market Attractiveness Analysis, by end use, 2019 & 2029
Figure 58: Europe Potato Flakes Market Value BPS Analysis, by Distribution Channel, 2019 & 2029
Figure 59: Europe Potato Flakes Market Value Y-o-Y Growth (%), by Distribution Channel, 2019–2029
Figure 60: Europe Potato Flakes Market Attractiveness Analysis, By Distribution Channel, 2019 & 2029
Figure 61: Europe Potato Flakes Market Value BPS Analysis, by Country, 2019 & 2029
Figure 62: Europe Potato Flakes Market Value Y-o-Y Growth (%), by Country, 2019–2029
Figure 63: Europe Potato Flakes Market Attractiveness Analysis, By Country, 2019 & 2029
Figure 64: Asia Pacific Potato Flakes Market Value BPS Analysis, by nature, 2019 & 2029
Figure 65: Asia Pacific Potato Flakes Market Value Y-o-Y Growth (%), by nature, 2019–2029
Figure 66: Asia Pacific Potato Flakes Market Attractiveness Analysis, by nature, 2019 & 2029
Figure 67: Asia Pacific Potato Flakes Market Value BPS Analysis, by Form, 2019 & 2029
Figure 68: Asia Pacific Potato Flakes Market Value Y-o-Y Growth (%), by Form, 2019–2029
Figure 69: Asia Pacific Potato Flakes Market Attractiveness Analysis, By Form, 2019 & 2029
Figure 70: Asia Pacific Potato Flakes Market Value BPS Analysis, by end use, 2019 & 2029
Figure 71: Asia Pacific Potato Flakes Market Value Y-o-Y Growth (%), by end use, 2019–2029
Figure 72: Asia Pacific Potato Flakes Market Attractiveness Analysis, by end use, 2019 & 2029
Figure 73: Asia Pacific Potato Flakes Market Value BPS Analysis, by Distribution Channel, 2019 & 2029
Figure 74: Asia Pacific Potato Flakes Market Value Y-o-Y Growth (%), by Distribution Channel, 2019–2029
Figure 75: Asia Pacific Potato Flakes Market Attractiveness Analysis, By Distribution Channel, 2019 & 2029
Figure 76: Asia Pacific Potato Flakes Market Value BPS Analysis, by Country, 2019 & 2029
Figure 77: Asia Pacific Potato Flakes Market Value Y-o-Y Growth (%), by Country, 2019–2029
Figure 78: Asia Pacific Potato Flakes Market Attractiveness Analysis, By Country, 2019 & 2029
Figure 79: Japan Potato Flakes Market Value BPS Analysis, by nature, 2019 & 2029
Figure 80: Japan Potato Flakes Market Value Y-o-Y Growth (%), by nature, 2019–2029
Figure 81: Japan Potato Flakes Market Attractiveness Analysis, by nature, 2019 & 2029
Figure 82: Japan Potato Flakes Market Value BPS Analysis, by Form, 2019 & 2029
Figure 83: Japan Potato Flakes Market Value Y-o-Y Growth (%), by Form, 2019–2029
Figure 84: Japan Potato Flakes Market Attractiveness Analysis, By Form, 2019 & 2029
Figure 85: Japan Potato Flakes Market Value BPS Analysis, by end use, 2019 & 2029
Figure 86: Japan Potato Flakes Market Value Y-o-Y Growth (%), by end use, 2019–2029
Figure 87: Japan Potato Flakes Market Attractiveness Analysis, by end use, 2019 & 2029
Figure 88: Japan Potato Flakes Market Value BPS Analysis, by Distribution Channel, 2019 & 2029
Figure 89: Japan Potato Flakes Market Value Y-o-Y Growth (%), by Distribution Channel, 2019–2029
Figure 90: Japan Potato Flakes Market Attractiveness Analysis, By Distribution Channel, 2019 & 2029
Figure 91: Japan Potato Flakes Market Value BPS Analysis, by Country, 2019 & 2029
Figure 92: Japan Potato Flakes Market Value Y-o-Y Growth (%), by Country, 2019–2029
Figure 93: Japan Potato Flakes Market Attractiveness Analysis, By Country, 2019 & 2029
Figure 94: Oceania Potato Flakes Market Value BPS Analysis, by nature, 2019 & 2029
Figure 95: Oceania Potato Flakes Market Value Y-o-Y Growth (%), by nature, 2019–2029
Figure 96: Oceania Potato Flakes Market Attractiveness Analysis, by nature, 2019 & 2029
Figure 97: Oceania Potato Flakes Market Value BPS Analysis, by Form, 2019 & 2029
Figure 98: Oceania Potato Flakes Market Value Y-o-Y Growth (%), by Form, 2019–2029
Figure 99: Oceania Potato Flakes Market Attractiveness Analysis, By Form, 2019 & 2029
Figure 100: Oceania Potato Flakes Market Value BPS Analysis, by end use, 2019 & 2029
Figure 101: Oceania Potato Flakes Market Value Y-o-Y Growth (%), by end use, 2019–2029
Figure 102: Oceania Potato Flakes Market Attractiveness Analysis, by end use, 2019 & 2029
Figure 103: Oceania Potato Flakes Market Value BPS Analysis, by Distribution Channel, 2019 & 2029
Figure 104: Oceania Potato Flakes Market Value Y-o-Y Growth (%), by Distribution Channel, 2019–2029
Figure 105: Oceania Potato Flakes Market Attractiveness Analysis, By Distribution Channel, 2019 & 2029
Figure 106: Oceania Potato Flakes Market Value BPS Analysis, by Country, 2019 & 2029
Figure 107: Oceania Potato Flakes Market Value Y-o-Y Growth (%), by Country, 2019–2029
Figure 108: Oceania Potato Flakes Market Attractiveness Analysis, By Country, 2019 & 2029
Figure 109: MEA Potato Flakes Market Value BPS Analysis, by nature, 2019 & 2029
Figure 110: MEA Potato Flakes Market Value Y-o-Y Growth (%), by nature, 2019–2029
Figure 111: MEA Potato Flakes Market Attractiveness Analysis, by nature, 2019 & 2029
Figure 112: MEA Potato Flakes Market Value BPS Analysis, by Form, 2019 & 2029
Figure 113: MEA Potato Flakes Market Value Y-o-Y Growth (%), by Form, 2019–2029
Figure 114: MEA Potato Flakes Market Attractiveness Analysis, By Form, 2019 & 2029
Figure 115: MEA Potato Flakes Market Value BPS Analysis, by end use, 2019 & 2029
Figure 116: MEA Potato Flakes Market Value Y-o-Y Growth (%), by end use, 2019–2029
Figure 117: MEA Potato Flakes Market Attractiveness Analysis, by end use, 2019 & 2029
Figure 118: MEA Potato Flakes Market Value BPS Analysis, by Distribution Channel, 2019 & 2029
Figure 119: MEA Potato Flakes Market Value Y-o-Y Growth (%), by Distribution Channel, 2019–2029
Figure 120: MEA Potato Flakes Market Attractiveness Analysis, By Distribution Channel, 2019 & 2029
Figure 121: MEA Potato Flakes Market Value BPS Analysis, by Country, 2019 & 2029
Figure 122: MEA Potato Flakes Market Value Y-o-Y Growth (%), by Country, 2019–2029
Figure 123: MEA Potato Flakes Market Attractiveness Analysis, By Country, 2019 & 2029
Copyright © Transparency Market Research, Inc. All Rights reserved
Trust Online

Potato Flakes Market Analysis, 2019-2029