
Reports
Reports
Polyphenylene ether is a polymer alloy obtained by combining polyphenylene ether with a high impact polystyrene material. The PPE market has made steady progress over the last few years and is expected to grow stronger in future, as well.
A TMR report projects the global PPE alloy market to grow at a compound annual growth rate (CAGR) of 4.9 percent during the forecast period between 2017 & 2025. The PPE market is estimated to grow, in terms of revenue from US $ 1264.7 Mn in 2016 to US $ 1951.2 Mn by 2025.
An increasing demand to reduce the weight of automotive parts for fuel efficiency, and a greater demand for cables in electrical and electronics products are some of the important factors, driving the PPE alloy market worldwide.
Some of the features of PPE include high dimensional stability, low water absorption, high temperature performance, low shrinkage, and high insulation. These features have made them a suitable choice in several applications in the medical and automotive industries, thereby fueling the global PPE market.
PPE are a group of polymers, the processing of which has led to several homo polymers and copolymers and their blends have been used in commercial applications. PPE blends have witnessed significant changes to meet the requirements in automotive and medical industries.
A few features of this class of polymers include greater water absorption than thermoplastics, excellent dielectric properties, remarkable mechanical and thermal characteristics, and superb dimensional stability.
The engineering smarting alloy variant has witnessed a rise in demand and has emerged as an important trend in the PPE market.
The increasing demand for lightweight components could help strengthen the growth prospects in the PPE alloy market.
The PPE alloy market is divided into five regions, globally: Europe, Asia Pacific, North America, Latin America, and Middle East & Africa. North America emerged as the leader in the global PPE market in 2016. The automotive segment emerged as the key enduser of PPE in North America in 2016.
Europe and Asia Pacific jointly heldsubstantial share in the polyphenylene ether ally market worldwide in 2016
In future, rising investments in the automotive sector in countries such as the UK, Spain, and France could present profitable growth opportunities for the PPE market.
The PPE market worldwide is segmented based on product type, geography, and end-user. Based on product type, it is divided into PPE/PA, PPE/PP and PPE/PS. In terms of revenue, PPE/PA is the leader in the PPE market.
The factor behind the domination is the presence of polyamide in the PPE/PA alloys, which improves toughness and increases the resistance to organic and chemical solvents. The PPE/PA and PPE/PP segments are anticipated to witness strong growth in future due to the rising demand for recycled plastic in electrical and electronic industries and demand for lightweight parts in automobiles.
Blends lends such as acrylonitrile butadiene styrene, polybutyl terephthalate, and polycarbonate are some products within others application segment. Polycarbonate provides excellent durability at low temperatures. Acrylonitrile helps develop chemical resistance, butadiene provides impact strength and resistance while styrene gives the substance a glossy appearance.
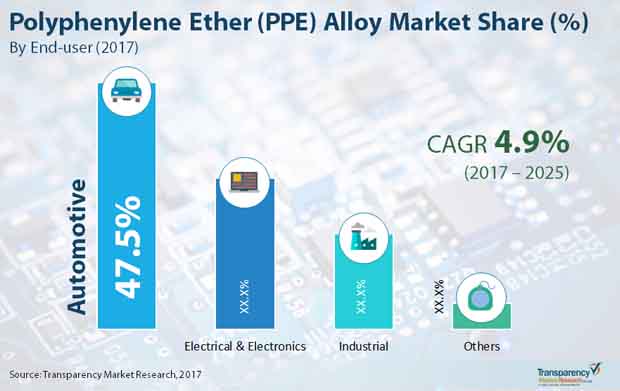
Depending on end-use, the PPE market is divided into electrical and electronics, automotive, and industrial applications. The automotive segment accounted for 47.5 percent of the overall share in the global PPE market in 2016.
Some of the important players in the global PPE market include Saudi Basic Industries Corporation, Sumitomo Chemical Company, Asahi Kasei Chemicals Corporation, and Mitsubishi Engineering Plastics Corporation.
The emergence of the COVID-19 has had a disastrous effect on some economies and that has impacted the demand and consumption number for the PPE market, too.
Polyphenylene Ether Alloy (PPE) Market is expected to reach US$ 1,951.2 mn by 2025
Polyphenylene Ether Alloy (PPE) Market is estimated to rise at a CAGR of 4.9% during forecast period
Increasing demand to reduce the weight of automotive parts for fuel efficiency, and a greater demand for cables in electrical and electronics products are some of the important factors, driving the PPE alloy market
North America is more attractive for vendors in the Polyphenylene Ether Alloy (PPE) Market
Key players of Polyphenylene Ether Alloy (PPE) Market are Saudi Basic Industries Corporation, Sumitomo Chemical Company, Asahi Kasei Chemicals Corporation, and Mitsubishi Engineering Plastics Corporation
1. Preface
1.1. Report Scope and Market Segmentation
1.2. Research Highlights
2. Assumptions and Research Methodology
2.1. Assumptions and Acronyms Used
2.2. Research Methodology
3. Executive Summary
3.1. Market Size, Indicative (US$ Bn)
3.2. Top 3 Trends
4. Market Overview
4.1. Product Overview
4.2. Key Industry Developments
4.3. Market Indicators
4.4. Drivers and Restraints Snapshot Analysis
4.4.1. Drivers
4.4.2. Restraints
4.4.3. Opportunities
4.5. Global Polyphenylene ether alloy Market Analysis and Forecasts
4.6. Polyphenylene ether alloy Market: Global Demand-Supply Scenario
4.7. Porter’s Analysis
4.7.1. Threat of Substitutes
4.7.2. Bargaining Power of Buyers
4.7.3. Bargaining Power of Suppliers
4.7.4. Threat of New Entrants
4.7.5. Degree of Competition
4.8. Value Chain Analysis
5. Global Polyphenylene ether alloy Market Value Share Analysis, by Product Type
5.1. Key Findings
5.1.1. PPE/PS
5.1.2. PPE/PA
5.1.3. PPE/PP
5.1.4. Others
5.2. Global Polyphenylene Ether Alloy Market Attractiveness Analysis, by Product
5.3. Key Findings
6. Global Polyphenylene ether alloy Market Value Share Analysis, by End-use Type
6.1. Key Findings
6.1.1. Automotive
6.1.2. Electrical & Electronics
6.1.3. Industrial
6.1.4. Others
6.2. Key Polyphenylene Ether Alloy Based Electric Vehicles
6.3. Global Polyphenylene Ether Alloy Market Attractiveness Analysis, by End-use Type
6.4. Key Trends
7. Global Polyphenylene ether alloy Market Analysis by Region
7.1. Global Regulatory Scenario
7.2. Global Polyphenylene ether alloy Market Value Share Analysis, by Region Type
7.3. Global Polyphenylene ether alloy Market Attractiveness Analysis, by Region Type
8. North America Polyphenylene ether alloy Market Overview
8.1. North America Polyphenylene Ether Alloy Market Value Share Analysis, by Product
8.2. North America Polyphenylene Ether Alloy Market Value Share Analysis, by End-use
8.3. North America Polyphenylene Ether Alloy Market Forecast, by Country
8.3.1. U.S. Polyphenylene Ether Alloy Market, by Product
8.3.2. U.S. Polyphenylene Ether Alloy Market, by End-user
8.3.3. Canada Polyphenylene Ether Alloy Market, by Product
8.3.4. Canada Polyphenylene Ether Alloy Market, by End-user
8.4. North America Market Attractiveness Analysis, by Product
8.5. North America Market Attractiveness Analysis, by End-user
8.6. PEST Analysis
8.7. Key Trends
9. Europe Polyphenylene ether alloy Market Overview
9.1. Europe Polyphenylene Ether Alloy Market Value Share Analysis, by Product
9.2. Europe Polyphenylene Ether Alloy Market Value Share Analysis, by End-use
9.3. Europe Polyphenylene ether alloy Market Forecast, by Country
9.4. Europe Polyphenylene Ether Alloy Market Forecast, by Country
9.4.1. Germany Polyphenylene Ether Alloy Market, by Product
9.4.2. Germany Polyphenylene Ether Alloy Market, by End-user
9.4.3. France Polyphenylene Ether Alloy Market, by Product
9.4.4. France Polyphenylene Ether Alloy Market, by End-user
9.4.5. U.K. Polyphenylene Ether Alloy Market, by Product
9.4.6. U.K. Polyphenylene Ether Alloy Market, by End-user
9.4.7. Italy Polyphenylene Ether Alloy Market, by Product
9.4.8. Italy Polyphenylene Ether Alloy Market, by End-user
9.4.9. Spain Polyphenylene Ether Alloy Market, by Product
9.4.10. Spain Polyphenylene Ether Alloy Market, by End-user
9.4.11. Rest of Europe Polyphenylene Ether Alloy Market Analysis
9.4.12. Rest of Europe Polyphenylene Ether Alloy Market Outlook
9.5. Europe Market Attractiveness Analysis, by Product
9.6. Europe Market Attractiveness Analysis, by End-user
9.7. PEST Analysis
9.8. Key Trends
10. Asia Pacific Polyphenylene ether alloy Market Overview
10.1. Asia Pacific Polyphenylene Ether Alloy Market Value Share Analysis, by Product
10.2. Asia Pacific Polyphenylene Ether Alloy Market Value Share Analysis, by End-use
10.3. Asia Pacific Polyphenylene Ether Alloy Market Forecast, by Country
10.3.1. China Polyphenylene Ether Alloy Market, by Product
10.3.2. China Polyphenylene Ether Alloy Market, by End-user
10.3.3. China Polyphenylene Ether Alloy Market, by Product
10.3.4. China Polyphenylene Ether Alloy Market, by End-user
10.3.5. India Polyphenylene Ether Alloy Market, by Product
10.3.6. India Polyphenylene Ether Alloy Market, by End-user
10.3.7. ASEAN Polyphenylene Ether Alloy Market, by Product
10.3.8. ASEAN Polyphenylene Ether Alloy Market, by End-user
10.3.9. Japan Polyphenylene Ether Alloy Market, by Product
10.3.10. Japan Polyphenylene Ether Alloy Market, by End-user
10.3.11. Rest of Asia Pacific Polyphenylene Ether Alloy Market, by Product
10.3.12. Rest of Asia Pacific Polyphenylene Ether Alloy Market, by End-user
10.4. Asia Pacific Market Attractiveness Analysis, by Product
10.5. Asia Pacific Market Attractiveness Analysis, by End-user
10.6. PEST Analysis
10.7. Key Trends
11. Latin America Polyphenylene ether alloy Market Overview
11.1. Latin America Polyphenylene ether alloy Market Analysis
11.2. Latin America Polyphenylene Ether Alloy Market Overview
11.3. Latin America Polyphenylene Ether Alloy Market Value Share Analysis, by Product
11.4. Latin America Polyphenylene Ether Alloy Market Value Share Analysis, by End-use
11.5. Latin America Polyphenylene Ether Alloy Market Forecast, by Country
11.5.1. Brazil Polyphenylene Ether Alloy Market, by Product
11.5.2. Brazil Polyphenylene Ether Alloy Market, by End-user
11.5.3. Mexico Polyphenylene Ether Alloy Market, by Product
11.5.4. Mexico Polyphenylene Ether Alloy Market, by End-user
11.5.5. Rest of Latin America Polyphenylene Ether Alloy Market, by Product
11.5.6. Rest of Latin America Polyphenylene Ether Alloy Market, by End-user
11.6. Latin America Market Attractiveness Analysis, by Product
11.7. Latin America Market Attractiveness Analysis, by End-user
11.8. PEST Analysis
12. Middle East & Africa Polyphenylene ether alloy Market Overview
12.1. Middle East & Africa Polyphenylene Ether Alloy Market Value Share Analysis, by Product
12.2. Middle East & Africa Polyphenylene Ether Alloy Market Value Share Analysis, by End-use
12.3. Middle East & Africa Polyphenylene Ether Alloy Market Forecast, by Country
12.3.1. GCC Polyphenylene Ether Alloy Market, by Product
12.3.2. GCC Polyphenylene Ether Alloy Market, by End-user
12.3.3. South Africa Polyphenylene Ether Alloy Market, by Product
12.3.4. South Africa Polyphenylene Ether Alloy Market, by End-user
12.3.5. Rest of Middle East & Africa Polyphenylene Ether Alloy Market, by Product
12.3.6. Rest of Middle East & Africa Polyphenylene Ether Alloy Market, by End-user
12.3.7. Middle East & Africa Market Attractiveness Analysis, by Product
12.3.8. Middle East & Africa Market Attractiveness Analysis, by End-user
12.4. PEST Analysis
12.5. Key Trends
13. Competition Landscape
13.1. Polyphenylene ether alloy Market Share Analysis by Company (2016)
13.2. Competition Matrix
13.2.1. Saudi Basic Industries Corporation
13.2.2. Asahi Kasei Corporation
13.2.3. Mitsui Chemicals, Inc.
13.2.4. Mitsubishi Engineering-Plastics Corporation
13.3. Product Mapping
13.4. Company Profile
13.4.1. Asahi Kasei Corporation
13.4.1.1. Company Description
13.4.1.2. Business Overview
13.4.1.3. Financial Details
13.4.1.4. Strategic Overview
13.4.1.5. Key Developments
13.4.2. Saudi Basic Industries Corporation
13.4.2.1. Company Description
13.4.2.2. Business Overview
13.4.2.3. Financial Details
13.4.2.4. Strategic Overview
13.4.2.5. Key Developments
13.4.3. Sumitomo Chemical Company
13.4.3.1. Company Description
13.4.3.2. Business Overview
13.4.3.3. Financial Details
13.4.3.4. Strategic Overview
13.4.3.5. Key Developments
13.4.4. Mitsui Chemicals, Inc.
13.4.4.1. Company Description
13.4.4.2. Business Overview
13.4.4.3. Financial Details
13.4.4.4. Strategic Overview
13.4.4.5. Key Developments
13.4.5. RTP Company
13.4.5.1. Company Description
13.4.5.2. Business Overview
13.4.5.3. Key Developments
13.4.6. Formulated Polymers Limited (FPL)
13.4.6.1. Company Description
13.4.6.2. Business Overview
13.4.7. Guangzhou OTEM Engineering Plastic Co. Ltd.
13.4.7.1. Company Description
13.4.7.2. Business Overview
13.4.8. Ashley Polymers, Inc.
13.4.8.1. Company Description
13.4.8.2. Business Overview
13.4.9. Tokai Rika Create Corporation
13.4.9.1. Company Description
13.4.9.2. Business Overview
13.4.10. Mitsubishi Engineering-Plastics Corporation
13.4.10.1. Company Description
13.4.10.2. Business Overview
13.4.11. Ensinger GmbH
13.4.11.1. Company Description
13.4.11.2. Business Overview
13.4.12. Nantong Xingchen Synthetic Material Co. Ltd.
13.4.12.1. Company Description
13.4.12.2. Business Overview
14. Primary Research - Key Insights
List of Tables
Table 01: Global Polyphenylene Ether Alloy Market Size (US$ Mn) and Volume (Tons) Forecast, by Product, 2016–2025
Table 02: Global Polyphenylene Ether Alloy Market Size (US$ Mn) and Volume (Tons) Forecast, by End-use, 2016–2025
Table 03: Global Polyphenylene Ether Alloy Market Size (US$ Mn) and Volume (Tons) Forecast, by Region, 2016–2025
Table 04: North America Polyphenylene Ether Alloy Market Size (US$ Mn) and Volume (Tons) Forecast, by Product, 2016–2025
Table 05: North America Polyphenylene Ether Alloy Market Size (US$ Mn) and Volume (Tons) Forecast, by End-use, 2016–2025
Table 06: North America Polyphenylene Ether Alloy Market Size (US$ Mn) and Volume (Units) Forecast, by Country, 2016–2025
Table 07: U.S. Polyphenylene Ether Alloy Market Size (US$ Mn) and Volume (Tons) Forecast, by Product, 2016–2025
Table 08: U.S. Polyphenylene Ether Alloy Market Size (US$ Mn) and Volume (Tons) Forecast, by End-use, 2016–2025
Table 09: Canada Polyphenylene Ether Alloy Market Size (US$ Mn) and Volume (Tons) Forecast, by Product, 2016–2025
Table 10: Canada Polyphenylene Ether Alloy Market Size (US$ Mn) and Volume (Tons) Forecast, by End-use, 2016–2025
Table 11: Europe Polyphenylene Ether Alloy Market Size (US$ Mn) and Volume (Tons) Forecast, by Product, 2016–2025
Table 12: Europe Polyphenylene Ether Alloy Market Size (US$ Mn) and Volume (Tons) Forecast, by End-use, 2016–2025
Table 13: Europe Polyphenylene Ether Alloy Market Size (US$ Mn) and Volume (Units) Forecast, by Country, 2016–2025
Table 14: Germany Polyphenylene Ether Alloy Market Size (US$ Mn) and Volume (Tons) Forecast, by Product, 2016–2025
Table 15: Germany Polyphenylene Ether Alloy Market Size (US$ Mn) and Volume (Tons) Forecast, by End-use, 2016–2025
Table 16: France Polyphenylene Ether Alloy Market Size (US$ Mn) and Volume (Tons) Forecast, by Product, 2016–2025
Table 17: France Polyphenylene Ether Alloy Market Size (US$ Mn) and Volume (Tons) Forecast, by End-use, 2016–2025
Table 18: U.K. Polyphenylene Ether Alloy Market Size (US$ Mn) and Volume (Tons) Forecast, by Product, 2016–2025
Table 19: U.K. Polyphenylene Ether Alloy Market Size (US$ Mn) and Volume (Tons) Forecast, by End-use, 2016–2025
Table 20: Italy Polyphenylene Ether Alloy Market Size (US$ Mn) and Volume (Tons) Forecast, by Product, 2016–2025
Table 21: Italy Polyphenylene Ether Alloy Market Size (US$ Mn) and Volume (Tons) Forecast, by End-use, 2016–2025
Table 22: Spain Polyphenylene Ether Alloy Market Size (US$ Mn) and Volume (Tons) Forecast, by Product, 2016–2025
Table 23: Spain Polyphenylene Ether Alloy Market Size (US$ Mn) and Volume (Tons) Forecast, by End-use, 2016–2025
Table 24: Rest of Europe Polyphenylene Ether Alloy Market Size (US$ Mn) and Volume (Tons) Forecast, by Product, 2016–2025
Table 25: Rest of Europe Polyphenylene Ether Alloy Market Size (US$ Mn) and Volume (Tons) Forecast, by End-use, 2016–2025
Table 26: Asia Pacific Polyphenylene Ether Alloy Market Size (US$ Mn) and Volume (Tons) Forecast, by Product, 2016–2025
Table 27: Asia Pacific Polyphenylene Ether Alloy Market Size (US$ Mn) and Volume (Tons) Forecast, by End-use, 2016–2025
Table 28: Asia Pacific Polyphenylene Ether Alloy Market Size (US$ Mn) and Volume (Tons) Forecast, by Country, 2017–2025
Table 29: China Polyphenylene Ether Alloy Market Size (US$ Mn) and Volume (Tons) Forecast, by Product, 2016–2025
Table 30: China Polyphenylene Ether Alloy Market Size (US$ Mn) and Volume (Tons) Forecast, by End-use, 2016–2025
Table 31: Corporate Average Fuel Consumption (CAFC)
Table 32: India Polyphenylene Ether Alloy Market Size (US$ Mn) and Volume (Tons) Forecast, by Product, 2016–2025
Table 33: India Polyphenylene Ether Alloy Market Size (US$ Mn) and Volume (Tons) Forecast, by End-use, 2016–2025
Table 34: ASEAN Polyphenylene Ether Alloy Market Size (US$ Mn) and Volume (Tons) Forecast, by Product, 2016–2025
Table 35: ASEAN Polyphenylene Ether Alloy Market Size (US$ Mn) and Volume (Tons) Forecast, by End-use, 2016–2025
Table 36: Japan Polyphenylene Ether Alloy Market Size (US$ Mn) and Volume (Tons) Forecast, by Product, 2016–2025
Table 37: Japan Polyphenylene Ether Alloy Market Size (US$ Mn) and Volume (Tons) Forecast, by End-use, 2016–2025
Table 38: Rest of Asia Pacific Polyphenylene Ether Alloy Market Size (US$ Mn) and Volume (Tons) Forecast, by Product, 2016–2025
Table 39: Rest of Asia Pacific Polyphenylene Ether Alloy Market Size (US$ Mn) and Volume (Tons) Forecast, by End-use, 2016–2025
Table 40: Latin America Polyphenylene Ether Alloy Market Size (US$ Mn) and Volume (Tons) Forecast, by Product, 2016–2025
Table 41: Latin America Polyphenylene Ether Alloy Market Size (US$ Mn) and Volume (Tons) Forecast, by End-use, 2016–2025
Table 42: Latin America Polyphenylene Ether Alloy Market Size (US$ Mn) and Volume (Units) Forecast, by Country, 2016–2025
Table 43: Brazil Polyphenylene Ether Alloy Market Size (US$ Mn) and Volume (Tons) Forecast, by Product, 2016–2025
Table 44: Brazil Polyphenylene Ether Alloy Market Size (US$ Mn) and Volume (Tons) Forecast, by End-use, 2016–2025
Table 45: Mexico Polyphenylene Ether Alloy Market Size (US$ Mn) and Volume (Tons) Forecast, by Product, 2016–2025
Table 46: Mexico Polyphenylene Ether Alloy Market Size (US$ Mn) and Volume (Tons) Forecast, by End-use, 2016–2025
Table 47: Rest of Latin America Polyphenylene Ether Alloy Market Size (US$ Mn) and Volume (Tons) Forecast, by Product, 2016–2025
Table 48: Rest of Latin America Polyphenylene Ether Alloy Market Size (US$ Mn) and Volume (Tons) Forecast, by End-use, 2016–2025
Table 49: Middle East & Africa Polyphenylene Ether Alloy Market Size (US$ Mn) and Volume (Tons) Forecast, by Product, 2016–2025
Table 50: Middle East & Africa Polyphenylene Ether Alloy Market Size (US$ Mn) and Volume (Tons) Forecast, by End-use, 2016–2025
Table 51: Middle East & Africa Polyphenylene Ether Alloy Market Size (US$ Mn) and Volume (Units) Forecast, by Country, 2016–2025
Table 52: GCC Polyphenylene Ether Alloy Market Size (US$ Mn) and Volume (Tons) Forecast, by Product, 2016–2025
Table 53: GCC Polyphenylene Ether Alloy Market Size (US$ Mn) and Volume (Tons) Forecast, by End-use, 2016–2025
Table 54: South Africa Polyphenylene Ether Alloy Market Size (US$ Mn) and Volume (Tons) Forecast, by Product, 2016–2025
Table 55: South Africa Polyphenylene Ether Alloy Market Size (US$ Mn) and Volume (Tons) Forecast, by End-use, 2016–2025
Table 56: Rest of Middle East & Africa Polyphenylene Ether Alloy Market Size (US$ Mn) and Volume (Tons) Forecast, by Product, 2016–2025
Table 57: Rest of Middle East & Africa Polyphenylene Ether Alloy Market Size (US$ Mn) and Volume (Tons) Forecast, by End-use, 2016–2025
List of Figures
Figure 01: Global Polyphenylene Ether Alloy Market (US$ Mn) Volume (Tons) Forecast, 2017–2025
Figure 02: Global Polyphenylene Ether Alloy Market Size (US$ Mn) and Volume (Tons) Forecast, 2016–2025
Figure 03: Global Polyphenylene Ether Alloy Average Prices (US$/Ton), 2016–2025
Figure 04: Global Polyphenylene Ether Alloy Market Value Share Analysis, by Product, 2016 and 2025
Figure 05: Global Polyphenylene Ether Alloy Market Size (US$ Mn) and Volume (Tons) Analysis, by PPE/PS, 2016–2025
Figure 06: Global Polyphenylene Ether Alloy Market Size (US$ Mn) and Volume (Tons) Analysis, by PPE/PA, 2016–2025
Figure 07: Global Polyphenylene Ether Alloy Market Size (US$ Mn) and Volume (Tons) Analysis, by PPE/PP, 2016–2025
Figure 08: Global Polyphenylene Ether Alloy Market Size (US$ Mn) and Volume (Tons) Analysis, by Others, 2016–2025
Figure 09: Global Polyphenylene Ether Alloy Market Attractiveness Analysis, by Product
Figure 10: Global Polyphenylene Ether Alloy Market Value Share Analysis, by End-use, 2016 and 2025
Figure 11: Global Polyphenylene Ether Alloy Market Size (US$ Mn) and Volume (Tons) Analysis, by Automotive, 2016–2025
Figure 12: Global Polyphenylene Ether Alloy Market Size (US$ Mn) and Volume (Tons) Analysis, by Electrical & Electronics, 2016–2025
Figure 13: Global Polyphenylene Ether Alloy Market Size (US$ Mn) and Volume (Tons) Analysis, by Industrial, 2016–2025
Figure 14: Global Polyphenylene Ether Alloy Market Size (US$ Mn) and Volume (Tons) Analysis, by Others, 2016–2025
Figure 15: Global Polyphenylene Ether Alloy Market Attractiveness Analysis, by End-use
Figure 16: Global Polyphenylene Ether Alloy Market Value Share Analysis, by Region, 2016 and 2025
Figure 17: North America Polyphenylene Ether Alloy Market Size (US$ Mn) and Volume (Tons) Forecast, 2017–2025
Figure 18: North America Polyphenylene Ether Alloy Market Size and Volume, Y-o-Y Growth Projection, 2017–2025
Figure 19: North America Market Attractiveness Analysis, by Country
Figure 20: North America Market Value Share Analysis, by Product, 2016 and 2025
Figure 21: North America Market Value Share Analysis, by End-use, 2016 and 2025
Figure 22: North America Market Value Share Analysis, by Country, 2016 and 2025
Figure 23: North America: Latest Development
Figure 24: Average Engineering & Other Plastics Content in Light Vehicles in North America (Pounds per Vehicle)
Figure 25: U.S. Polyphenylene Ether Alloy Market Size (US$ Mn) Forecast, 2016–2025
Figure 26: U.S. Polyphenylene Ether Alloy Market Volume (Tons) Forecast, 2016–2025
Figure 27: Polyphenylene Ether Alloy Use in Front Fenders description
Figure 28: Polyphenylene Ether Alloy Use in wires and cables description
Figure 29: U.S. Polyphenylene Ether Alloy Market Analysis, by Product, 2016-2025
Figure 30: U.S. Polyphenylene Ether Alloy Market Analysis, by End-user, 2016-2025
Figure 31: Canada Polyphenylene Ether Alloy Market Size (US$ Mn) Forecast, 2016–2025
Figure 32: Canada Polyphenylene Ether Alloy Market Volume (Tons) Forecast, 2016–2025
Figure 33: Canada Polyphenylene Ether Alloy Market Analysis, by Product
Figure 34: Canada Polyphenylene Ether Alloy Market Analysis, by End-user
Figure 35: North America Polyphenylene Ether Alloy Market Attractiveness Analysis, by Product, 2016-2025
Figure 36: North America Polyphenylene Ether Alloy Market Attractiveness Analysis, by End-user, 2016-2025
Figure 37: North America Light Weighted Vehicle Production (Million Units) by Top Manufacturers
Figure 38: Europe Polyphenylene Ether Alloy Market Size (US$ Mn) and Volume (Tons) Forecast, 2017–2025
Figure 39: Europe Polyphenylene Ether Alloy Market Size and Volume Y-o-Y Growth Projections, 2017–2025
Figure 40: Europe Market Attractiveness Analysis, by Country
Figure 41: Europe Market Value Share Analysis, by Product, 2016 and 2025
Figure 42: Europe Market Value Share Analysis, by End-use, 2016 and 2025
Figure 43: Europe Market Value Share Analysis, by Country, 2016 and 2025
Figure 44: Europe: Lightweight Vehicle
Figure 45: Europe Motor Vehicle Production, by Product, 2016
Figure 46: Europe Electric Vehicle Sales, January–March 2017
Figure 47: Europe: Electric Vehicle Model
Figure 48: Germany Polyphenylene Ether Alloy Market Size (US$ Mn) Forecast, 2016–2025
Figure 49: Germany Polyphenylene Ether Alloy Market Volume (Tons) Forecast, 2016–2025
Figure 50: Germany Polyphenylene Ether Alloy Market Analysis, by Product, 2016-2025
Figure 51: Germany Polyphenylene Ether Alloy Market Analysis, by End-user, 2016-2025
Figure 52: France Polyphenylene Ether Alloy Market Size (US$ Mn) Forecast, 2016–2025
Figure 53: France Polyphenylene Ether Alloy Market Volume (Tons) Forecast, 2016–2025
Figure 54: France Polyphenylene Ether Alloy Market Analysis, by Product, 2016-2025
Figure 55: France Polyphenylene Ether Alloy Market Analysis, by End-user, 2016-2025
Figure 56: U.K. Polyphenylene Ether Alloy Market Size (US$ Mn) Forecast, 2016–2025
Figure 57: U.K. Polyphenylene Ether Alloy Market Volume (Tons) Forecast, 2016–2025
Figure 58: U.K. Polyphenylene Ether Alloy Market Analysis, by Product, 2016-2025
Figure 59: U.K. Polyphenylene Ether Alloy Market Analysis, by End-user, 2016-2025
Figure 60: Italy Polyphenylene Ether Alloy Market Size (US$ Mn) Forecast, 2016–2025
Figure 61: Italy Polyphenylene Ether Alloy Market Volume (Tons) Forecast, 2016–2025
Figure 62: Italy Polyphenylene Ether Alloy Market Analysis, by Product, 2016-2025
Figure 63: Italy Polyphenylene Ether Alloy Market Analysis, by End-user, 2016-2025
Figure 64: Spain Polyphenylene Ether Alloy Market Size (US$ Mn) Forecast, 2016–2025
Figure 65: Spain Polyphenylene Ether Alloy Market Volume (Tons) Forecast, 2016–2025
Figure 66: Spain Polyphenylene Ether Alloy Market Analysis, by Product, 2016-2025
Figure 67: Spain Polyphenylene Ether Alloy Market Analysis, by End-user, 2016-2025
Figure 68: Rest of Europe Polyphenylene Ether Alloy Market Size (US$ Mn) Forecast, 2016–2025
Figure 69: Rest of Europe Polyphenylene Ether Alloy Market Volume (Tons) Forecast, 2016–2025
Figure 70: Rest of Europe Polyphenylene Ether Alloy Market Analysis, by Product, 2016-2025
Figure 71: Rest of Europe Polyphenylene Ether Alloy Market Analysis, by End-user, 2016-2025
Figure 72: Europe Polyphenylene Ether Alloy Market Attractiveness Analysis, by Product
Figure 73: Europe Polyphenylene Ether Alloy Market Attractiveness Analysis, by End-user
Figure 74: Europe Passenger Car Production and Registration (Million Units)
Figure 75: Asia Pacific Polyphenylene Ether Alloy Market Size (US$ Mn) and Volume (Tons) Forecast, 2016–2025
Figure 76: Asia Pacific Polyphenylene Ether Alloy Market Size and Volume Y-o-Y Growth Projections, 2016–2025
Figure 77: Asia Pacific Market Attractiveness Analysis, by Country
Figure 78: Asia Pacific Polyphenylene Ether Alloy Market Value Share Analysis, by Product, 2016 and 2025
Figure 79: Asia Pacific Polyphenylene Ether Alloy Market Value Share Analysis, by End-use, 2016 and 2025
Figure 80: Asia Pacific Polyphenylene Ether Alloy Market Value Share Analysis, by Country, 2016 and 2025
Figure 81: China Polyphenylene Ether Alloy Market Size (US$ Mn) Analysis 2016–2025
Figure 82: China Polyphenylene Ether Alloy Market Volume (Tons) Analysis 2016–2025
Figure 83: Polyphenylene Ether Alloy-based Wires & Cables
Figure 84: China Electric Vehicle Sales, January–May 2017
Figure 85: China Polyphenylene Ether Alloy Market Analysis, by Product, 2016-2025
Figure 86: China Polyphenylene Ether Alloy Market Analysis, by End-user, 2016-2025
Figure 87: India Polyphenylene Ether Alloy Market Size (US$ Mn) Analysis, 2016–2025
Figure 88: India Polyphenylene Ether Alloy Market Volume (Tons) Analysis, 2016–2025
Figure 89: India Lightweight XUV 500
Figure 90: India Lightweight Outlander Sport Crossover
Figure 91: India Polyphenylene Ether Alloy Market Analysis, by Product, 2016-2025
Figure 92: India Polyphenylene Ether Alloy Market Analysis, by End-user, 2016-2025
Figure 93: ASEAN Polyphenylene Ether Alloy Market Size (US$ Mn) Analysis, 2016–2025
Figure 94: ASEAN Polyphenylene Ether Alloy Market Volume (Tons) Analysis, 2016–2025
Figure 95: ASEAN Polyphenylene Ether Alloy Market Analysis, by Product, 2016-2025
Figure 96: ASEAN Polyphenylene Ether Alloy Market Analysis, by End-user, 2016-2025
Figure 97: Japan Polyphenylene Ether Alloy Market Size (US$ Mn) Analysis, 2016–2025
Figure 98: Japan Polyphenylene Ether Alloy Market Volume (Tons) Analysis, 2016–2025
Figure 99: Japan Light Weight Vehicle
Figure 100: Japan Photovoltaic Module
Figure 101: Japan Polyphenylene Ether Alloy Market Analysis, by Product, 2016-2025
Figure 102: Japan Polyphenylene Ether Alloy Market Analysis, by End-user, 2016-2025
Figure 103: Rest of Asia Pacific Polyphenylene Ether Alloy Market Size (US$ Mn) Analysis, 2016–2025
Figure 104: Rest of Asia Pacific Polyphenylene Ether Alloy Market Volume (Tons) Analysis, 2016–2025
Figure 105: Rest of Asia Pacific Polyphenylene Ether Alloy Market Analysis, by Product, 2016-2025
Figure 106: Rest of Asia Pacific Polyphenylene Ether Alloy Market Analysis, by End-user, 2016-2025
Figure 107: Asia Pacific Polyphenylene Ether Alloy Market Attractiveness Analysis, by Product
Figure 108: Asia Pacific Polyphenylene Ether Alloy Market Attractiveness Analysis, by End-user
Figure 109: Latin America Polyphenylene Ether Alloy Market Size (US$ Mn) and Volume (Tons) Forecast, 2016–2025
Figure 110: Latin America Polyphenylene Ether Alloy Market Size and Volume Y-o-Y Growth Projections, 2016–2025
Figure 111: Latin America Market Attractiveness Analysis, by Country
Figure 112: Latin America Polyphenylene Ether Alloy Market Value Share Analysis, by Product, 2016 and 2025
Figure 113: Latin America Polyphenylene Ether Alloy Market Value Share Analysis, by End-use, 2016 and 2025
Figure 114: Latin America Polyphenylene Ether Alloy Market Value Share Analysis, by Country, 2016 and 2025
Figure 115: Brazil Polyphenylene Ether Alloy Market Size (US$ Mn) Analysis 2016–2025
Figure 116: Brazil Polyphenylene Ether Alloy Market Volume (Tons) Analysis 2016–2025
Figure 117: Brazil Polyphenylene Ether Alloy Market Analysis, by Product, 2016-2025
Figure 118: Brazil Polyphenylene Ether Alloy Market Analysis, by End-user, 2016-2025
Figure 119: Mexico Polyphenylene Ether Alloy Market Size (US$ Mn) Analysis 2016–2025
Figure 120: Mexico Polyphenylene Ether Alloy Market Volume (Tons) Analysis 2016–2025
Figure 121: Mexico Polyphenylene Ether Alloy Market Analysis, by Product, 2016-2025
Figure 122: Mexico Polyphenylene Ether Alloy Market Analysis, by End-user, 2016-2025
Figure 123 : Rest of Latin America Polyphenylene Ether Alloy Market Size (US$ Mn) Analysis 2016–2025
Figure 124: Rest of Latin America Polyphenylene Ether Alloy Market Volume (Tons) Analysis 2016–2025
Figure 125: Rest of Latin America Polyphenylene Ether Alloy Market Analysis, by Product, 2016-2025
Figure 126: Rest of Latin America Polyphenylene Ether Alloy Market Analysis, by End-user, 2016-2025
Figure 127: Latin America Polyphenylene Ether Alloy Market Attractiveness Analysis, by Product
Figure 128: Latin America Polyphenylene Ether Alloy Market Attractiveness Analysis, by End-user
Figure 129: Brazil: Sales of New Passenger Cars by Brand
Figure 130: Middle East & Africa Polyphenylene Ether Alloy Market Size (US$ Mn) and Volume (Tons) Forecast, 2016–2025
Figure 131: Middle East & Africa Polyphenylene Ether Alloy Market Size and Volume, Y-o-Y Growth Projection, 2016–2025
Figure 132: Middle East & Africa Polyphenylene Ether Alloy Market Attractiveness Analysis, by Country
Figure 133: Middle East & Africa Polyphenylene Ether Alloy Market Value Share Analysis, by Product, 2016 and 2025
Figure 134: Middle East & Africa Polyphenylene Ether Alloy Market Value Share Analysis, by End-use, 2016 and 2025
Figure 135: Middle East & Africa Polyphenylene Ether Alloy Market Value Share Analysis, by Country, 2016 and 2025
Figure 136: GCC Polyphenylene Ether Alloy Market Size (US$ Mn) Analysis, 2016–2025
Figure 137: GCC Polyphenylene Ether Alloy Market Volume (Tons) Analysis, 2016–2025
Figure 138: GCC Polyphenylene Ether Alloy Market Analysis, by Product, 2016–2025
Figure 139: GCC Polyphenylene Ether Alloy Market Analysis, by End-use, 2016–2025
Figure 140: South Africa Polyphenylene Ether Alloy Market Size (US$ Mn) Analysis, 2016–2025
Figure 141: South Africa Polyphenylene Ether Alloy Market Volume (Tons) Analysis, 2016–2025
Figure 142: South Africa Polyphenylene Ether Alloy Market Analysis, by Product, 2016–2025
Figure 143: South Africa Polyphenylene Ether Alloy Market Analysis, by End-use, 2016–2025
Figure 144: Rest of Middle East & Africa Polyphenylene Ether Alloy Market Size (US$ Mn) Analysis, 2016–2025
Figure 145: Rest of Middle East & Africa Polyphenylene Ether Alloy Market Volume (Tons) Analysis, 2016–2025
Figure 146: Rest of Middle East & Africa Polyphenylene Ether Alloy Market Analysis, by Product, 2016–2025
Figure 147: Rest of Middle East & Africa Polyphenylene Ether Alloy Market Analysis, by End-use, 2016–2025
Figure 148: Middle East & Africa Polyphenylene Ether Alloy Market Attractiveness Analysis, by Product
Figure 149: Middle East & Africa Polyphenylene Ether Alloy Market Attractiveness Analysis, by End-use
Figure 150: Middle East & Africa Lightweight Vehicle
Figure 151: Global Polyphenylene Ether Alloy Market Share Analysis, by Company (2016)
Copyright © Transparency Market Research, Inc. All Rights reserved
Trust Online

Polyphenylene Ether Alloy (PPE) Market Analysis, 2017-2025