
Reports
Reports
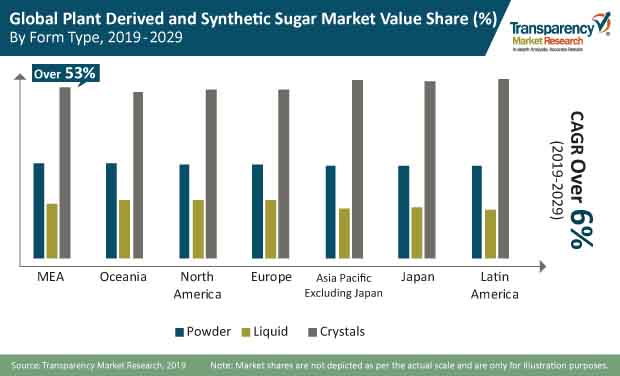
Plant Derived and Synthetic Sugar: Market Introduction
Sugar is a product used for sweetening. It is derived from sugar crops, cereals, fruits, milk, and seaweeds. Sugar can be extracted from plant sources or synthesized in laboratories. Sugar, which is extracted directly from a plant source and is available for commercialization without any value addition is defined as plant derived sugar. In our study, we have included 8 plant derived and synthetic sugar types excluding sucrose, which has major market share in the global sugar market.
We have included glucose, fructose, arabinose, xylose, fucose, galactose, mannose, and rhamnose in the overall plant derived and synthetic sugar market. Out of all plant derived and synthetic sugar products, sucrose, glucose, and fructose are being extensively used in the food industry, but increasing health consciousness among people has significantly escalated the demand for mannose, rhamnose, and xylose due to their health benefits.
Plant derived and synthetic sugars are the most common and one of the important ingredients in the global food and beverage industry as they change the taste and enhance the palatability of end products. The demand for few sugars such as glucose and fructose, has significantly increased over the years owing to their instant energy enrichment to the body.
Plant Derived and Synthetic Sugar: Market Outlook
Lucrative growth of the global food and beverage industry over the years has had a remarkable impact on the growth of the plant derived and synthetic sugar industry. Increasing health consciousness has significantly fuelled the demand for natural food ingredients, hence, there has been a subtle boom in the growth of plant derived sugar over the last few years. Naturally-derived sweeteners are preferred over synthetic sweeteners since they don't have any adverse impact on health. On the other hand, sugar types, which are produced indirectly from a different source are called synthetic sugars. The increasing demand for healthy food ingredients in the food and beverage industry has led to a decrease in consumption of plant derived and synthetic sugar. The main factor expected to hamper the plant derived and synthetic sugar market is synthetic sugar. There is a subsequent decrease in the consumption of food and beverages containing more plant derived and synthetic sugar. It is due to their adverse health consequences such as diabetes and obesity. Even though there is reduction in plant derived and synthetic sugar consumption at present, there is still great market demand for plant derived and synthetic sugar as it is an irreplaceable food ingredient.
Rising Population and Per Capita Food Consumption to Result in the Growth of the Plant Derived and Synthetic Sugar Market
As per the report published by the UN Department of Economic and Social Affairs (population division), world population reached nearly 7.6 billion in mid-2017. It is expected to reach 8.6 billion by 2030, and increase further to 9.8 billion by 2050. It has been observed that more than the actual increase in number, the per capita consumption of people will increase substantially. This factor is expected to create growth opportunities for the plant derived and synthetic sugar market.
Lifestyle and Demographic Changes to Induce Drinking Habits and Provide Impetus to Plant Derived and Synthetic Sugar Market Growth
Modernization and urbanization in emerging economy countries have bolstered the food and beverage industry. There is a remarkable change in the eating and drinking habits of consumers. Changing lifestyles have induced drinking habits among millennials. Improvements in economic conditions of various countries have led to increased disposable incomes and a higher standard of living, which has contributed to the rising trend of premiumization and consumption of convenient and ready-to-eat food and beverages, which has significantly increased the consumption of plant derived and synthetic sugar. With the increasing number of working women, the consumption of ready-to-eat food products has significantly increased over the last decade. The increasing demand for these products has escalated the sugar consumption and this, in turn, will increase the demand for plant derived and synthetic sugar products in the upcoming years.
Increasing Applications of Plant Derived and Synthetic Sugar in Biofuel Production
Plant derived and synthetic sugar has immense potential to be used as a biofuel, but challenges with extraction and constant decline in global crude oil prices have meant that widespread commercialization has been beset with challenges. Organizations involved in mass production of plant derived and synthetic sugar biofuel continue to face bottlenecks with scaling up, and a number of them have forayed into more pragmatic productions such as feed, pharmaceuticals, and industrial chemicals. During the early years of plant derived and synthetic sugar biofuel production, it was projected that technological innovations will mitigate some of the challenges; however, in spite of many advances, the cost of production has not gone down substantially to make plant derived and synthetic sugar an alternative for fossil fuel-based oils.
In 2019, Plant Derived Sugar and Synthetic Sugar Market was valued at US$70,000 mn
Plant Derived Sugar and Synthetic Sugar Market is estimated to rise at a CAGR of 6% during forecast period
Increasing demand for healthy food ingredients in the food and beverage industry is expected to drive the Plant Derived Sugar and Synthetic Sugar Market
North America is more attractive for vendors in the Plant Derived Sugar and Synthetic Sugar Market
Key players of Plant Derived Sugar and Synthetic Sugar Market are Toyota Tsusho Corporation, Sigma Aldrich Pte. Ltd., Qingdao Qingmei Biotech Co. Ltd., Profood International Inc., JnJ Consumer Nutritionals, and Merisant Worldwide Inc. among others
1. Global Plant Derived and Synthetic Sugar Market - Executive Summary
1.1. Global Plant Derived and Synthetic Sugar Market Country Analysis
1.2. Vertical Specific Market Penetration
1.3. Application – Product Mapping
1.4. Competition Blueprint
1.5. TMR Analysis and Recommendations
2. Market Overview
2.1. Market Introduction
2.2. Market Definition
2.3. Market Taxonomy
3. Consumer Behavior and Attitude Measurement
3.1. Deciphering Consumer Buying Pattern
3.1.1. Decision Centers
3.1.2. Buyer Decision Process
3.1.3. What are suppliers criterion’s
3.1.4. Frequency of purchase and volume at one go
3.2. Decrypting Channel Preferences
3.2.1. Development of the specification
3.2.2. Product visibility at channel shelves
3.2.3. Acquisition and analysis of the proposals
3.2.4. Impact of labelling, claims, and certifications
3.3. Metamorphosis in Consumer Behavior
3.3.1. Prime Tendencies
3.3.2. Fairtrade Certification
3.3.3. Social & Economic Influencers – Factors
3.3.4. Establishing sourcing plans
4. Market Tendencies & Latest Buzz
4.1. Product Oriented Market Buzz
4.1.1. Common product categories yet influential
4.1.2. Rare in the portfolio, albeit promises value return
4.1.3. Attractive segments for all Market Actors
4.1.4. Transformed product attributes
4.2. Business and Operational Market Buzz
4.2.1. Capacity factor optimization
4.2.2. Channel mix and strategies
4.2.3. Vertical and horizontal integration
4.2.4. Product Type optimization
5. Product Launch Track & Trends
5.1. Key Product Launches in last three years
5.2. Type of launches
5.3. Regions and countries in focus
5.4. Available alternatives
6. Risk and Opportunities
6.1. Associated Risk
6.1.1. Regulatory Landscape Associated Risk
6.1.2. Standard and Certification Risk
6.1.3. Risk of Alternatives and advanced Technology
6.2. Opportunities
6.2.1. Niche within the existing product line
6.2.2. Opportunities in new product categories
6.2.3. Latent opportunities in established market
6.2.4. White Spaces in Newer Markets
7. Market Dynamics
7.1. Macro-economic Factors
7.1.1. Rise in Consumption of Food Items across Globe
7.1.2. Global and Regional Per Capita Food Consumption (kcal per capita per day)
7.1.3. Population of Key Countries
7.1.4. Organic Agriculture Worldwide Statistics
7.1.5. Per Capita Disposable Income
7.1.6. Food and Beverage Industry Overview
7.1.7. Global Modern Trade Penetration and Grocery Market by Key Countries
7.1.8. Change in Consumer Price Indexes (Percentage Change) 2018 (Forecast)
7.1.9. Global Retail Dynamics
7.2. Drivers
7.3. Market Restraints
7.4. Forecast Factors – Relevance and Impact
8. Key Regulations and Claims
8.1. Dietary Supplement Health and Education Act (DSHEA)
8.2. Federal Food & Cosmetics Act
8.3. Europe Food & Safety Authority
8.4. State Food and Drug Administration (SFDA)
8.5. Foods for Specified Health Uses
8.6. FSSAI
8.7. Food Packaging Claims
8.8. Labeling and Claims
8.9. Import/Export Regulations
8.10. List of Market Participants
9. Supply Chain Analysis
9.1. Profitability and Gross Margin Analysis By Competition
9.2. List of Active Participants- By Region
9.2.1. Raw Material Suppliers
9.2.2. Key Manufacturers
9.2.3. Key Distributor/Retailers
9.2.4. Operating Margins
10. Global Plant Derived and Synthetic Sugar Market Pricing Analysis
10.1. Price Point Assessment by Product Type
10.2. Regional Average Pricing Analysis
10.2.1. North America
10.2.2. Latin America
10.2.3. Europe
10.2.4. Asia Pacific Ex. Japan (APEJ)
10.2.5. Japan
10.2.6. Oceania
10.2.7. Middle East and Africa
10.3. Price Forecast till 2029
10.4. Factors Influencing Pricing
11. Sentiment Analysis
11.1. Consumer Sentiment Analysis
11.1.1. Consumer Buying Pattern
11.1.2. Development of the Specification
11.1.3. Social & Economic Influencers – Factors
11.1.4. Consumer preferences: Historical Scenario and Futuristic Approach
11.1.5. Factors Affecting Consumer Preferences
11.1.6. Impact of labelling, claims, and certifications
11.1.7. Others
11.2. Social Media Sentiment Analysis
11.2.1. Consumer perception for products on social media platforms- Positive and Negative Mentions
11.2.2. Trending Brands
11.2.3. Social Media Platform Mentions (% of total mentions)
11.2.4. Trending Subject Titles
11.2.5. Others
12. Global Plant Derived and Synthetic Sugar Market Analysis and Forecast
12.1. Market Size Analysis (2014-2018) and Forecast (2019-2029)
12.1.1. Market Value (US$ Mn) and Volume (Tons) and Y-o-Y Growth
12.1.2. Absolute $ Opportunity
12.2. Global Plant Derived and Synthetic Sugar Market Scenario Forecast (Optimistic, Likely and Conservative Market Conditions)
12.2.1. Forecast Factors and Relevance of Impact
12.2.2. Regional Plant Derived and Synthetic Sugar Market Business Performance Summary
13. Global Plant Derived and Synthetic Sugar Market Analysis By gar Type
13.1. Introduction
13.1.1. Y-o-Y Growth Comparison By Sugar Type
13.1.2. Basis Point Share (BPS) Analysis By Sugar Type
13.2. Plant Derived and Synthetic Sugar Market Size (US$ Mn) and Volume (MT) Analysis (2014-2018) & Forecast (2019 - 2029) By Sugar Type
13.2.1. Rhamnose
13.2.1.1. Plant Derived
13.2.1.2. Synthetic
13.2.2. Galactose
13.2.2.1. Plant Derived
13.2.2.2. Synthetic
13.2.3. Arabinose
13.2.3.1. Plant Derived
13.2.3.2. Synthetic
13.2.4. Xylose
13.2.4.1. Plant Derived
13.2.4.2. Synthetic
13.2.5. Fucose
13.2.5.1. Plant Derived
13.2.5.2. Synthetic
13.2.6. Glucose
13.2.6.1. Plant Derived
13.2.6.2. Synthetic
13.2.7. Mannose
13.2.7.1. Plant Derived
13.2.7.2. Synthetic
13.2.8. Fructose
13.2.8.1. Plant Derived
13.2.8.2. Synthetic
13.3. Market Attractiveness Analysis By Sugar Type
14. Global Plant Derived and Synthetic Sugar Market Analysis By End Use
14.1. Introduction
14.1.1. Y-o-Y Growth Comparison By End Use
14.1.2. Basis Point Share (BPS) Analysis By End Use
14.2. Plant Derived and Synthetic Sugar Market Size (US$ Mn) and Volume (MT) Analysis (2014-2018) & Forecast (2019-2029) By End Use
14.2.1. Food
14.2.1.1. Bakery Goods
14.2.1.2. Sweet Spreads
14.2.1.3. Confectionery
14.2.1.4. Dairy Products
14.2.1.5. Canned Food
14.2.2. Beverages
14.2.2.1. Carbonated Drinks
14.2.2.2. Fruit Drinks & Juice
14.2.2.3. Powdered Drinks and Mixes
14.2.2.4. Alcoholic Beverages
14.2.3. Pharmaceuticals
14.2.4. Personal Care
14.2.5. Biofuel Industry
14.2.6. Animal Feed Industry
14.3. Market Attractiveness Analysis By End Use
15. Global Plant Derived and Synthetic Sugar Market Analysis By Form Type
15.1. Introduction
15.1.1. Y-o-Y Growth Comparison By Form Type
15.1.2. Basis Point Share (BPS) Analysis By Form Type
15.2. Plant Derived and Synthetic Sugar Market Size (US$ Mn) and Volume (MT) Analysis (2014-2018) & Forecast (2019-2029) By Form Type
15.2.1. Powder
15.2.2. Liquid
15.2.3. Crystals
15.3. Market Attractiveness Analysis By Form Type
16. Global Plant Derived and Synthetic Sugar Market Analysis and Forecast, By Region
16.1. Introduction
16.1.1. Basis Point Share (BPS) Analysis By Region
16.1.2. Y-o-Y Growth Projections By Region
16.2. Plant Derived and Synthetic Sugar Market Size (US$ Mn) and Volume (MT) & Forecast (2019-2029) Analysis By Region
16.2.1. North America
16.2.2. Europe
16.2.3. APEJ
16.2.4. Japan
16.2.5. Oceania
16.2.6. Latin America
16.2.7. Middle East and Africa
16.3. Market Attractiveness Analysis By Region
17. North America Plant Derived and Synthetic Sugar Market Analysis and Forecast
17.1. Introduction
17.1.1. Basis Point Share (BPS) Analysis By Country
17.1.2. Y-o-Y Growth Projections By Country
17.2. Plant Derived and Synthetic Sugar Market Size (Value (US$) and Volume (MT) Analysis (2013-2018) and Forecast (2019-2029)
17.2.1. Market Attractiveness By Country
17.2.1.1. U.S.
17.2.1.2. Canada
17.2.2. By Sugar Type
17.2.3. By End Use
17.2.4. By Form Type
17.3. Market Attractiveness Analysis
17.3.1. By Country
17.3.2. By Sugar Type
17.3.3. By End Use
17.3.4. By Form Type
17.4. Drivers and Restraints: Impact Analysis
18. Latin America Plant Derived and Synthetic Sugar Market Analysis and Forecast
18.1. Introduction
18.1.1. Basis Point Share (BPS) Analysis By Country
18.1.2. Y-o-Y Growth Projections By Country
18.1.3. Key Regulations
18.2. Plant Derived and Synthetic Sugar Market Size (Value (US$) and Volume (MT) Analysis (2013-2018) and Forecast (2019-2029)
18.2.1. By Country
18.2.1.1. Brazil
18.2.1.2. Mexico
18.2.1.3. Chile
18.2.1.4. Peru
18.2.1.5. Argentina
18.2.1.6. Rest of Latin America
18.2.2. By Sugar Type
18.2.3. By End Use
18.2.4. By Form Type
18.3. Market Attractiveness Analysis
18.3.1. By Country
18.3.2. By Sugar Type
18.3.3. By End Use
18.3.4. By Form Type
18.4. Drivers and Restraints: Impact Analysis
19. Europe Plant Derived and Synthetic Sugar Market Analysis and Forecast
19.1. Introduction
19.1.1. Basis Point Share (BPS) Analysis By Country
19.1.2. Y-o-Y Growth Projections By Country
19.1.3. Key Regulations
19.2. Plant Derived and Synthetic Sugar Market Size (Value (US$) and Volume (MT) Analysis (2013-2018) and Forecast (2019-2029)
19.2.1. By Country
19.2.1.1. EU-4 (Germany, France, Italy, Spain)
19.2.1.2. U.K.
19.2.1.3. BENELUX
19.2.1.4. Nordic
19.2.1.5. Russia
19.2.1.6. Poland
19.2.1.7. Rest of Europe
19.2.2. By Sugar Type
19.2.3. By End Use
19.2.4. By Form Type
19.3. Market Attractiveness Analysis
19.3.1. By Country
19.3.2. By Sugar Type
19.3.3. By End Use
19.3.4. By Form Type
19.4. Drivers and Restraints: Impact Analysis
20. APEJ Plant Derived and Synthetic Sugar Market Analysis and Forecast
20.1. Introduction
20.1.1. Basis Point Share (BPS) Analysis By Country
20.1.2. Y-o-Y Growth Projections By Country
20.1.3. Key Regulations
20.2. Plant Derived and Synthetic Sugar Market Size (Value (US$) and Volume (MT) Analysis (2013-2018) and Forecast (2019-2029)
20.2.1. By Country
20.2.1.1. China
20.2.1.2. India
20.2.1.3. South Korea
20.2.1.4. ASEAN
20.2.2. By Sugar Type
20.2.3. By End Use
20.2.4. By Form Type
20.3. Market Attractiveness Analysis
20.3.1. By Country
20.3.2. By Sugar Type
20.3.3. By End Use
20.3.4. By Form Type
20.4. Drivers and Restraints: Impact Analysis
21. Japan Plant Derived and Synthetic Sugar Market Analysis and Forecast
21.1. Introduction
21.1.1. Basis Point Share (BPS) Analysis By Country
21.1.2. Y-o-Y Growth Projections By Country
21.1.3. Key Regulations
21.2. Plant Derived and Synthetic Sugar Market Size (Value (US$) and Volume (MT) Analysis (2013-2018) and Forecast (2019-2029)
21.2.1. By Sugar Type
21.2.2. By End Use
21.2.3. By Form Type
21.3. Market Attractiveness Analysis
21.3.1. By Sugar Type
21.3.2. By End Use
21.3.3. By Form Type
21.4. Drivers and Restraints: Impact Analysis
22. Oceania Plant Derived and Synthetic Sugar Market Analysis and Forecast
22.1. Introduction
22.1.1. Basis Point Share (BPS) Analysis By Country
22.1.2. Y-o-Y Growth Projections By Country
22.1.3. Key Regulations
22.2. Plant Derived and Synthetic Sugar Market Size (Value (US$) and Volume (MT) Analysis (2013-2018) and Forecast (2019-2029)
22.2.1. By Sugar Type
22.2.2. By End Use
22.2.3. By Form Type
22.3. Market Attractiveness Analysis
22.3.1. By Sugar Type
22.3.2. By End Use
22.3.3. By Form Type
22.4. Drivers and Restraints: Impact Analysis
23. Middle East and Africa (MEA) Plant Derived and Synthetic Sugar Market Analysis and Forecast
23.1. Introduction
23.1.1. Basis Point Share (BPS) Analysis By Country
23.1.2. Y-o-Y Growth Projections By Country
23.1.3. Key Regulations
23.2. Plant Derived and Synthetic Sugar Market Size (Value (US$) and Volume (MT) Analysis (2013-2018) and Forecast (2019-2029)
23.2.1. By Country
23.2.1.1. GCC Countries
23.2.1.2. South Africa
23.2.1.3. North Africa
23.2.1.4. Rest of MEA
23.2.2. By Sugar Type
23.2.3. By End Use
23.2.4. By Form Type
23.3. Market Attractiveness Analysis
23.3.1. By Country
23.3.2. By Sugar Type
23.3.3. By End Use
23.3.4. By Form Type
23.4. Drivers and Restraints: Impact Analysis
24. Competition Assessment
24.1. Global Plant Derived and Synthetic Sugar Market Competition - a Dashboard View
24.2. Global Plant Derived and Synthetic Sugar Market Structure Analysis
24.3. Global Plant Derived and Synthetic Sugar Market Company Share Analysis
24.3.1. For Tier 1 Market Players, 2018
24.3.2. Company Market Share Analysis of Top 10 Players
24.4. Key Participants Market Presence (Intensity Mapping) by Region
25. Brand Assessment
25.1. Brand Identity (Brand as Product, Brand as Organization, Brand as Person, Brand as Symbol)
25.2. Plant Derived and Synthetic Sugar Audience and Positioning (Demographic Segmentation, Geographic Segmentation,Psychographic Segmentation, Situational
Segmentation)
25.3. Brand Strategy
26. Competition Deep-dive (Manufacturers/Suppliers)
26.1. Ajinomoto Co., Inc.
26.1.1. Overview
26.1.2. Product Portfolio
26.1.3. Sales Footprint
26.1.4. Channel Footprint
26.1.4.1. Distributors List
26.1.4.2. Sales Channel (Clients)
26.1.5. Strategy Overview
26.1.5.1. Marketing Strategy
26.1.5.2. Culture Strategy
26.1.5.3. Channel Strategy
26.1.6. SWOT Analysis
26.1.7. Financial Analysis
26.1.8. Revenue Share
26.1.8.1. By Type
26.1.8.2. By Region
26.1.9. Key Clients
26.1.10. Analyst Comments
26.2. A & Z food additives Co. Ltd
26.3. ADM Corn Processing
26.4. Atlantic Chemicals Trading GMBH
26.5. Carbone Scientific Co., Ltd
26.6. Cargill Incorporated
26.7. Celanese Corporation
26.8. CJ CheilJedang Corp
26.9. Cumberland Packing Corp
26.10. Dsb Chem Sdn Bhd
26.11. Dulcette Technologies LLC
26.12. DuPont Nutrition & health
26.13. Futaste Co., Ltd.
26.14. Hermes Sweeteners Ltd.
26.15. HighChem Co.,Ltd
26.16. Impala Imperial Sugar Company
26.17. Ingredion Food and beverage sweeteners
26.18. JINAN JUHE INDUSTRIAL CO LTD
26.19. JK Sucralose Inc.
26.20. JnJ Consumer Nutritionals
26.21. Kenko (Qingdao) Co., Ltd.
26.22. Merisant Worldwide Inc.
26.23. Naturex Nutrition & Health
26.24. Profood International, Inc.
26.25. Qingdao Qingmei Biotech Co.,Ltd.
26.26. Sigma Aldrich Pte.Ltd.
26.27. Toyota Tsusho Corporation
26.28. VWR International, LLC
26.29. Xieli Biotechnology
26.30. Others (On Request)
27. Recommendation- Critical Success Factors
28. Research Methodology
29. Assumptions & Acronyms Used
List of Table
Table 01: Global Plant Derived & Synthetic Sugar Market Value (US$ Mn) Forecast by Sugar Type, 2019-2029
Table 02: Global Plant Derived & Synthetic Sugar Market Volume (MT) Forecast by Sugar Type, 2019-2029
Table 03: Global Plant Derived & Synthetic Sugar Market Value (US$ Mn) & Volume (MT) Forecast by Form Type,
2019-2029
Table 04: Global Plant Derived & Synthetic Sugar Market Value (US$ Mn) Forecast by End Use, 2019-2029
Table 05: Global Plant Derived & Synthetic Sugar Market Volume (MT) Forecast by End Use, 2019-2029
Table 06: Global Plant Derived & Synthetic Sugar Market Value (US$ Mn) & Volume (MT)Forecast by Source, 2019-2029
Table 07: Global Plant Derived & Synthetic Sugar Market Value (US$ Mn) Forecast by Region, 2019-2029
Table 08: Global Plant Derived & Synthetic Sugar Market Volume (MT) Forecast by Region, 2019-2029
Table 09: North America Plant Derived & Synthetic Sugar Market Value (US$ Mn) Forecast by Sugar Type, 2019-2029
Table 10: North America Plant Derived & Synthetic Sugar Market Volume (MT) Forecast by Sugar Type, 2019-2029
Table 11: North America Plant Derived & Synthetic Sugar Market Value (US$ Mn) & Volume (MT) Forecast by Form Type, 2019-2029
Table 12: North America Plant Derived & Synthetic Sugar Market Value (US$ Mn) Forecast by End Use, 2019-2029
Table 13: North America Plant Derived & Synthetic Sugar Market Volume (MT) Forecast by End Use, 2019-2029
Table 14: North America Plant Derived & Synthetic Sugar Market Value (US$ Mn) & Volume (MT)Forecast by Source,
2019-2029
Table 15: North America Plant Derived & Synthetic Sugar Market Value (US$ Mn) & Volume (MT)Forecast by Country, 2019-2029
Table 16: Latin America Plant Derived & Synthetic Sugar Market Value (US$ Mn) Forecast by Sugar Type, 2019-2029
Table 17: Latin America Plant Derived & Synthetic Sugar Market Volume (MT) Forecast by Sugar Type, 2019-2029
Table 18: Latin America Plant Derived & Synthetic Sugar Market Value (US$ Mn) & Volume (MT) Forecast by Form Type,
2019-2029
Table 19: Latin America Plant Derived & Synthetic Sugar Market Value (US$ Mn) Forecast by End Use, 2019-2029
Table 20: Latin America Plant Derived & Synthetic Sugar Market Volume (MT) Forecast by End Use, 2019-2029
Table 21: Latin America Plant Derived & Synthetic Sugar Market Value (US$ Mn) & Volume (MT)Forecast by Source,
2019-2029
Table 22: Latin America Plant Derived & Synthetic Sugar Market Value (US$ Mn) & Volume (MT)Forecast by Country, 2019-2029
Table 23: Europe Plant Derived & Synthetic Sugar Market Value (US$ Mn) Forecast by Sugar Type, 2019-2029
Table 24: Europe Plant Derived & Synthetic Sugar Market Volume (MT) Forecast by Sugar Type, 2019-2029
Table 25: Europe Plant Derived & Synthetic Sugar Market Value (US$ Mn) & Volume (MT) Forecast by Form Type,
2019-2029
Table 26: Europe Plant Derived & Synthetic Sugar Market Value (US$ Mn) Forecast by End Use, 2019-2029
Table 27: Europe Plant Derived & Synthetic Sugar Market Volume (MT) Forecast by End Use, 2019-2029
Table 28: Europe Plant Derived & Synthetic Sugar Market Value (US$ Mn) & Volume (MT)Forecast by Source,
2019-2029
Table 29: Europe Plant Derived & Synthetic Sugar Market Value (US$ Mn) Forecast by Country, 2019-2029
Table 30: Europe Plant Derived & Synthetic Sugar Market Volume (MT) Forecast by Country, 2019-2029
Table 31: APEJ Plant Derived & Synthetic Sugar Market Value (US$ Mn) Forecast by Sugar Type, 2019-2029
Table 32: APEJ Plant Derived & Synthetic Sugar Market Volume (MT) Forecast by Sugar Type, 2019-2029
Table 33: APEJ Plant Derived & Synthetic Sugar Market Value (US$ Mn) & Volume (MT) Forecast by Form Type,
2019-2029
Table 34: APEJ Plant Derived & Synthetic Sugar Market Value (US$ Mn) Forecast by End Use, 2019-2029
Table 35: APEJ Plant Derived & Synthetic Sugar Market Volume (MT) Forecast by End Use, 2019-2029
Table 36: APEJ Plant Derived & Synthetic Sugar Market Value (US$ Mn) & Volume (MT)Forecast by Source, 2019-2029
Table 37: APEJ Plant Derived & Synthetic Sugar Market Value (US$ Mn) Forecast by Country, 2019-2029
Table 38: APEJ Plant Derived & Synthetic Sugar Market Volume (MT) Forecast by Country, 2019-2029
Table 39: Oceania Plant Derived & Synthetic Sugar Market Value (US$ Mn) Forecast by Sugar Type, 2019-2029
Table 40: Oceania Plant Derived & Synthetic Sugar Market Volume (MT) Forecast by Sugar Type, 2019-2029
Table 41: Oceania Plant Derived & Synthetic Sugar Market Value (US$ Mn) & Volume (MT) Forecast by Form Type,
2019-2029
Table 42: Oceania Plant Derived & Synthetic Sugar Market Value (US$ Mn) Forecast by End Use, 2019-2029
Table 43: Oceania Plant Derived & Synthetic Sugar Market Volume (MT) Forecast by End Use, 2019-2029
Table 44: Oceania Plant Derived & Synthetic Sugar Market Value (US$ Mn) & Volume (MT)Forecast by Source,
2019-2029
Table 45: Oceania Plant Derived & Synthetic Sugar Market Value (US$ Mn) Forecast by Country, 2019-2029
Table 46: Oceania Plant Derived & Synthetic Sugar Market Volume (MT) Forecast by Country, 2019-2029
Table 47: Japan Plant Derived & Synthetic Sugar Market Value (US$ Mn) Forecast by Sugar Type, 2019-2029
Table 48: Japan Plant Derived & Synthetic Sugar Market Volume (MT) Forecast by Sugar Type, 2019-2029
Table 49: Japan Plant Derived & Synthetic Sugar Market Value (US$ Mn) & Volume (MT) Forecast by Form Type,
2019-2029
Table 50: Japan Plant Derived & Synthetic Sugar Market Value (US$ Mn) Forecast by End Use, 2019-2029
Table 51: Japan Plant Derived & Synthetic Sugar Market Volume (MT) Forecast by End Use, 2019-2029
Table 52: Japan Plant Derived & Synthetic Sugar Market Value (US$ Mn) & Volume (MT)Forecast by Source,
2019-2029
Table 53: Japan Plant Derived & Synthetic Sugar Market Value (US$ Mn) Forecast by Country, 2019-2029
Table 54: Japan Plant Derived & Synthetic Sugar Market Volume (MT) Forecast by Country, 2019-2029
Table 55: MEA Plant Derived & Synthetic Sugar Market Value (US$ Mn) Forecast by Sugar Type, 2019-2029
Table 56: MEA Plant Derived & Synthetic Sugar Market Volume (MT) Forecast by Sugar Type, 2019-2029
Table 57: MEA Plant Derived & Synthetic Sugar Market Value (US$ Mn) & Volume (MT) Forecast by Form Type,
2019-2029
Table 58: MEA Plant Derived & Synthetic Sugar Market Value (US$ Mn) Forecast by End Use, 2019-2029
Table 59: MEA Plant Derived & Synthetic Sugar Market Volume (MT) Forecast by End Use, 2019-2029
Table 60: MEA Plant Derived & Synthetic Sugar Market Value (US$ Mn) & Volume (MT)Forecast by Source,
2019-2029
Table 61: MEA Plant Derived & Synthetic Sugar Market Value (US$ Mn) Forecast by Country, 2019-2029
Table 62: MEA Plant Derived & Synthetic Sugar Market Volume (MT) Forecast by Country, 2019-2029
List of Figures
Figure 1: Global Plant Derived & Synthetic Sugar Market Absolute $ Opportunity (US$ Mn), 2019-2029
Figure 2: Global Plant Derived & Synthetic Sugar Market Value (US$ Mn) and Volume (MT), 2014-2018
Figure 3: Global Plant Derived & Synthetic Sugar Market Value (US$ Mn) and Volume (MT) Forecast, 2019-2029
Figure 04 : Global Plant Derived & Synthetic Sugar Market Volume (MT) by Sugar Type, 2019 & 2029
Figure 05 : Global Plant Derived & Synthetic Sugar Market Value (US$ Mn) by Sugar Type, 2019 & 2029
Figure 06: Global Plant Derived & Synthetic Sugar Market Value Share (%) and BPS Analysis by Sugar Type, 2019 & 2029
Figure 07: Global Plant Derived & Synthetic Sugar Market Y-o-Y Growth (%) Projections by Sugar Type, 2019-2029
Figure 08: Global Plant Derived & Synthetic Sugar Market Volume (MT) Analysis by Form Type, 2019 & 2029
Figure 09: Global Plant Derived & Synthetic Sugar Market Value (US$ Mn) Analysis by Form Type, 2019 & 2029
Figure 10: Global Plant Derived & Synthetic Sugar Market Value Share (%) and BPS Analysis by Form Type, 2019 & 2029
Figure 11: Global Plant Derived & Synthetic Sugar Market Y-o-Y Growth (%) Projections by Form Type, 2019-2029
Figure 12: Global Plant Derived & Synthetic Sugar Market Volume (MT) Analysis by End Use, 2019 & 2029
Figure 13: Global Plant Derived & Synthetic Sugar Market Value (US$ Mn) Analysis by End Use, 2019 & 2029
Figure 14: Global Plant Derived & Synthetic Sugar Market Value Share (%) and BPS Analysis by End Use, 2019 & 2029
Figure 15: Global Plant Derived & Synthetic Sugar Market Y-o-Y Growth (%) Projections by End Use, 2019-2029
Figure 16: Global Plant Derived & Synthetic Sugar Market Volume (MT) Analysis by Source, 2019 & 2029
Figure 17: Global Plant Derived & Synthetic Sugar Market Value (US$ Mn) Analysis by Source, 2019 & 2029
Figure 18: Global Plant Derived & Synthetic Sugar Market Value Share (%) and BPS Analysis by Source, 2019 & 2029
Figure 19: Global Plant Derived & Synthetic Sugar Market Y-o-Y Growth (%) Projections by Source, 2019-2029
Figure 20: Global Plant Derived & Synthetic Sugar Market Value (MT) Analysis by Region, 2019 & 2029
Figure 21: Global Plant Derived & Synthetic Sugar Market Volume (US$ Mn) Analysis by Region, 2019 & 2029
Figure 22: Global Plant Derived & Synthetic Sugar Market Value Share (%) and BPS Analysis by Region, 2019 & 2029
Figure 23: Global Plant Derived & Synthetic Sugar Market Y-o-Y Growth (%) Projections by Region, 2019-2029
Figure 24: Global Plant Derived & Synthetic Sugar Market Attractiveness Analysis, by Sugar Type, 2019 & 2029
Figure 25: Global Plant Derived & Synthetic Sugar Market Attractiveness Analysis, by Form Type, 2019 & 2029
Figure 26: Global Plant Derived & Synthetic Sugar Market Attractiveness Analysis, by Source, 2019 & 2029
Figure 27: Global Plant Derived & Synthetic Sugar Market Attractiveness Analysis, by End Use
Figure 28: Global Plant Derived & Synthetic Sugar Market Attractiveness Analysis, by Region
Figure 29 : North America Plant Derived & Synthetic Sugar Market Volume (MT) by Sugar Type, 2019 & 2029
Figure 30 : North America Plant Derived & Synthetic Sugar Market Value (US$ Mn) by Sugar Type, 2019 & 2029
Figure 31: North America Plant Derived & Synthetic Sugar Market Value Share (%) and BPS Analysis by Sugar Type,
2019 & 2029
Figure 32: North America Plant Derived & Synthetic Sugar Market Y-o-Y Growth (%) Projections by Sugar Type,
2019-2029
Figure 33: North America Plant Derived & Synthetic Sugar Market Volume (MT) Analysis by Form Type, 2019 & 2029
Figure 34: North America Plant Derived & Synthetic Sugar Market Value (US$ Mn) Analysis by Form Type, 2019 & 2029
Figure 35: North America Plant Derived & Synthetic Sugar Market Value Share (%) and BPS Analysis by Form Type,
2019 & 2029
Figure 36: North America Plant Derived & Synthetic Sugar Market Y-o-Y Growth (%) Projections by Form Type,
2019-2029
Figure 37: North America Plant Derived & Synthetic Sugar Market Volume (MT) Analysis by End Use, 2019 & 2029
Figure 38: North America Plant Derived & Synthetic Sugar Market Value (US$ Mn) Analysis by End Use, 2019 & 2029
Figure 39: North America Plant Derived & Synthetic Sugar Market Value Share (%) and BPS Analysis by End Use, 2019 & 2029
Figure 40: North America Plant Derived & Synthetic Sugar Market Y-o-Y Growth (%) Projections by End Use, 2019-2029
Figure 41: North America Plant Derived & Synthetic Sugar Market Volume (MT) Analysis by Source, 2019 & 2029
Figure 42: North America Plant Derived & Synthetic Sugar Market Value (US$ Mn) Analysis by Source, 2019 & 2029
Figure 43: North America Plant Derived & Synthetic Sugar Market Value Share (%) and BPS Analysis by Source, 2019 & 2029
Figure 44: North America Plant Derived & Synthetic Sugar Market Y-o-Y Growth (%) Projections by Source, 2019-2029
Figure 45: North America Plant Derived & Synthetic Sugar Market Value (MT) Analysis by Country, 2019 & 2029
Figure 46: North America Plant Derived & Synthetic Sugar Market Volume (US$ Mn) Analysis by Country, 2019 & 2029
Figure 47: North America Plant Derived & Synthetic Sugar Market Value Share (%) and BPS Analysis by Country, 2019 & 2029
Figure 48: North America Plant Derived & Synthetic Sugar Market Y-o-Y Growth (%) Projections by Country, 2019-2029
Figure 49: North America Plant Derived & Synthetic Sugar Market Attractiveness Analysis, by Sugar Type, 2019 & 2029
Figure 50: North America Plant Derived & Synthetic Sugar Market Attractiveness Analysis, by Form Type, 2019 & 2029
Figure 51: North America Plant Derived & Synthetic Sugar Market Attractiveness Analysis, by Source, 2019 & 2029
Figure 52: North America Plant Derived & Synthetic Sugar Market Attractiveness Analysis, by End Use
Figure 53: North America Plant Derived & Synthetic Sugar Market Attractiveness Analysis, by Country
Figure 54 : Latin America Plant Derived & Synthetic Sugar Market Volume (MT) by Sugar Type, 2019 & 2029
Figure 55 : Latin America Plant Derived & Synthetic Sugar Market Value (US$ Mn) by Sugar Type, 2019 & 2029
Figure 56: Latin America Plant Derived & Synthetic Sugar Market Value Share (%) and BPS Analysis by Sugar Type,
2019 & 2029
Figure 57: Latin America Plant Derived & Synthetic Sugar Market Y-o-Y Growth (%) Projections by Sugar Type,
2019-2029
Figure 58: Latin America Plant Derived & Synthetic Sugar Market Volume (MT) Analysis by Form Type, 2019 & 2029
Figure 59: Latin America Plant Derived & Synthetic Sugar Market Value (US$ Mn) Analysis by Form Type, 2019 & 2029
Figure 60: Latin America Plant Derived & Synthetic Sugar Market Value Share (%) and BPS Analysis by Form Type,
2019 & 2029
Figure 61: Latin America Plant Derived & Synthetic Sugar Market Y-o-Y Growth (%) Projections by Form Type,
2019-2029
Figure 62: Latin America Plant Derived & Synthetic Sugar Market Volume (MT) Analysis by End Use, 2019 & 2029
Figure 63: Latin America Plant Derived & Synthetic Sugar Market Value (US$ Mn) Analysis by End Use, 2019 & 2029
Figure 64: Latin America Plant Derived & Synthetic Sugar Market Value Share (%) and BPS Analysis by End Use, 2019 & 2029
Figure 65: Latin America Plant Derived & Synthetic Sugar Market Y-o-Y Growth (%) Projections by End Use, 2019-2029
Figure 66: Latin America Plant Derived & Synthetic Sugar Market Volume (MT) Analysis by Source, 2019 & 2029
Figure 67: Latin America Plant Derived & Synthetic Sugar Market Value (US$ Mn) Analysis by Source, 2019 & 2029
Figure 68: Latin America Plant Derived & Synthetic Sugar Market Value Share (%) and BPS Analysis by Source,
2019 & 2029
Figure 69: Latin America Plant Derived & Synthetic Sugar Market Y-o-Y Growth (%) Projections by Source, 2019-2029
Figure 70: Latin America Plant Derived & Synthetic Sugar Market Value (MT) Analysis by Country, 2019 & 2029
Figure 71: Latin America Plant Derived & Synthetic Sugar Market Volume (US$ Mn) Analysis by Country, 2019 & 2029
Figure 72: Latin America Plant Derived & Synthetic Sugar Market Value Share (%) and BPS Analysis by Country, 2019 & 2029
Figure 73: Latin America Plant Derived & Synthetic Sugar Market Y-o-Y Growth (%) Projections by Country, 2019-2029
Figure 74: Latin America Plant Derived & Synthetic Sugar Market Attractiveness Analysis, by Sugar Type, 2019 & 2029
Figure 75: Latin America Plant Derived & Synthetic Sugar Market Attractiveness Analysis, by Form Type, 2019 & 2029
Figure 76: Latin America Plant Derived & Synthetic Sugar Market Attractiveness Analysis, by Source, 2019 & 2029
Figure 77: Latin America Plant Derived & Synthetic Sugar Market Attractiveness Analysis, by End Use
Figure 78: Latin America Plant Derived & Synthetic Sugar Market Attractiveness Analysis, by Country
Figure 79 : Europe Plant Derived & Synthetic Sugar Market Volume (MT) by Sugar Type, 2019 & 2029
Figure 80 : Europe Plant Derived & Synthetic Sugar Market Value (US$ Mn) by Sugar Type, 2019 & 2029
Figure 81: Europe Plant Derived & Synthetic Sugar Market Value Share (%) and BPS Analysis by Sugar Type, 2019 & 2029
Figure 82: Europe Plant Derived & Synthetic Sugar Market Y-o-Y Growth (%) Projections by Sugar Type, 2019-2029
Figure 83: Europe Plant Derived & Synthetic Sugar Market Volume (MT) Analysis by Form Type, 2019 & 2029
Figure 84: Europe Plant Derived & Synthetic Sugar Market Value (US$ Mn) Analysis by Form Type, 2019 & 2029
Figure 85: Europe Plant Derived & Synthetic Sugar Market Value Share (%) and BPS Analysis by Form Type, 2019 & 2029
Figure 86: Europe Plant Derived & Synthetic Sugar Market Y-o-Y Growth (%) Projections by Form Type, 2019-2029
Figure 87: Europe Plant Derived & Synthetic Sugar Market Volume (MT) Analysis by End Use, 2019 & 2029
Figure 88: Europe Plant Derived & Synthetic Sugar Market Value (US$ Mn) Analysis by End Use, 2019 & 2029
Figure 89: Europe Plant Derived & Synthetic Sugar Market Value Share (%) and BPS Analysis by End Use, 2019 & 2029
Figure 90: Europe Plant Derived & Synthetic Sugar Market Y-o-Y Growth (%) Projections by End Use, 2019-2029
Figure 91: Europe Plant Derived & Synthetic Sugar Market Volume (MT) Analysis by Source, 2019 & 2029
Figure 92: Europe Plant Derived & Synthetic Sugar Market Value (US$ Mn) Analysis by Source, 2019 & 2029
Figure 93: Europe Plant Derived & Synthetic Sugar Market Value Share (%) and BPS Analysis by Source, 2019 & 2029
Figure 94: Europe Plant Derived & Synthetic Sugar Market Y-o-Y Growth (%) Projections by Source, 2019-2029
Figure 95: Europe Plant Derived & Synthetic Sugar Market Value (MT) Analysis by Country, 2019 & 2029
Figure 96: Europe Plant Derived & Synthetic Sugar Market Volume (US$ Mn) Analysis by Country, 2019 & 2029
Figure 97: Europe Plant Derived & Synthetic Sugar Market Value Share (%) and BPS Analysis by Country, 2019 & 2029
Figure 98: Europe Plant Derived & Synthetic Sugar Market Y-o-Y Growth (%) Projections by Country, 2019-2029
Figure 99: Europe Plant Derived & Synthetic Sugar Market Attractiveness Analysis, by Sugar Type, 2019 & 2029
Figure 100: Europe Plant Derived & Synthetic Sugar Market Attractiveness Analysis, by Form Type, 2019 & 2029
Figure 101: Europe Plant Derived & Synthetic Sugar Market Attractiveness Analysis, by Source, 2019 & 2029
Figure 102: Europe Plant Derived & Synthetic Sugar Market Attractiveness Analysis, by End Use
Figure 103: Europe Plant Derived & Synthetic Sugar Market Attractiveness Analysis, by Country
Figure 104 : APEJ Plant Derived & Synthetic Sugar Market Volume (MT) by Sugar Type, 2019 & 2029
Figure 105 : APEJ Plant Derived & Synthetic Sugar Market Value (US$ Mn) by Sugar Type, 2019 & 2029
Figure 106: APEJ Plant Derived & Synthetic Sugar Market Value Share (%) and BPS Analysis by Sugar Type, 2019 & 2029
Figure 107: APEJ Plant Derived & Synthetic Sugar Market Y-o-Y Growth (%) Projections by Sugar Type, 2019-2029
Figure 108: APEJ Plant Derived & Synthetic Sugar Market Volume (MT) Analysis by Form Type, 2019 & 2029
Figure 109: APEJ Plant Derived & Synthetic Sugar Market Value (US$ Mn) Analysis by Form Type, 2019 & 2029
Figure 110: APEJ Plant Derived & Synthetic Sugar Market Value Share (%) and BPS Analysis by Form Type, 2019 & 2029
Figure 111: APEJ Plant Derived & Synthetic Sugar Market Y-o-Y Growth (%) Projections by Form Type, 2019-2029
Figure 112: APEJ Plant Derived & Synthetic Sugar Market Volume (MT) Analysis by End Use, 2019 & 2029
Figure 113: APEJ Plant Derived & Synthetic Sugar Market Value (US$ Mn) Analysis by End Use, 2019 & 2029
Figure 114: APEJ Plant Derived & Synthetic Sugar Market Value Share (%) and BPS Analysis by End Use, 2019 & 2029
Figure 115: APEJ Plant Derived & Synthetic Sugar Market Y-o-Y Growth (%) Projections by End Use, 2019-2029
Figure 116: APEJ Plant Derived & Synthetic Sugar Market Volume (MT) Analysis by Source, 2019 & 2029
Figure 117: APEJ Plant Derived & Synthetic Sugar Market Value (US$ Mn) Analysis by Source, 2019 & 2029
Figure 118: APEJ Plant Derived & Synthetic Sugar Market Value Share (%) and BPS Analysis by Source, 2019 & 2029
Figure 119: APEJ Plant Derived & Synthetic Sugar Market Y-o-Y Growth (%) Projections by Source, 2019-2029
Figure 120: APEJ Plant Derived & Synthetic Sugar Market Value (MT) Analysis by Country, 2019 & 2029
Figure 121: APEJ Plant Derived & Synthetic Sugar Market Volume (US$ Mn) Analysis by Country, 2019 & 2029
Figure 122: APEJ Plant Derived & Synthetic Sugar Market Value Share (%) and BPS Analysis by Country, 2019 & 2029
Figure 123: APEJ Plant Derived & Synthetic Sugar Market Y-o-Y Growth (%) Projections by Country, 2019-2029
Figure 124: APEJ Plant Derived & Synthetic Sugar Market Attractiveness Analysis, by Sugar Type, 2019 & 2029
Figure 125: APEJ Plant Derived & Synthetic Sugar Market Attractiveness Analysis, by Form Type, 2019 & 2029
Figure 126: APEJ Plant Derived & Synthetic Sugar Market Attractiveness Analysis, by Source, 2019 & 2029
Figure 127: APEJ Plant Derived & Synthetic Sugar Market Attractiveness Analysis, by End Use
Figure 128: APEJ Plant Derived & Synthetic Sugar Market Attractiveness Analysis, by Country
Figure 129 : Oceania Plant Derived & Synthetic Sugar Market Volume (MT) by Sugar Type, 2019 & 2029
Figure 130 : Oceania Plant Derived & Synthetic Sugar Market Value (US$ Mn) by Sugar Type, 2019 & 2029
Figure 131: Oceania Plant Derived & Synthetic Sugar Market Value Share (%) and BPS Analysis by Sugar Type,
2019 & 2029
Figure 132: Oceania Plant Derived & Synthetic Sugar Market Y-o-Y Growth (%) Projections by Sugar Type, 2019-2029
Figure 133: Oceania Plant Derived & Synthetic Sugar Market Volume (MT) Analysis by Form Type, 2019 & 2029
Figure 134: Oceania Plant Derived & Synthetic Sugar Market Value (US$ Mn) Analysis by Form Type, 2019 & 2029
Figure 135: Oceania Plant Derived & Synthetic Sugar Market Value Share (%) and BPS Analysis by Form Type, 2019 & 2029
Figure 136: Oceania Plant Derived & Synthetic Sugar Market Y-o-Y Growth (%) Projections by Form Type, 2019-2029
Figure 137: Oceania Plant Derived & Synthetic Sugar Market Volume (MT) Analysis by End Use, 2019 & 2029
Figure 138: Oceania Plant Derived & Synthetic Sugar Market Value (US$ Mn) Analysis by End Use, 2019 & 2029
Figure 139: Oceania Plant Derived & Synthetic Sugar Market Value Share (%) and BPS Analysis by End Use, 2019 & 2029
Figure 140: Oceania Plant Derived & Synthetic Sugar Market Y-o-Y Growth (%) Projections by End Use, 2019-2029
Figure 141: Oceania Plant Derived & Synthetic Sugar Market Volume (MT) Analysis by Source, 2019 & 2029
Figure 142: Oceania Plant Derived & Synthetic Sugar Market Value (US$ Mn) Analysis by Source, 2019 & 2029
Figure 143: Oceania Plant Derived & Synthetic Sugar Market Value Share (%) and BPS Analysis by Source, 2019 & 2029
Figure 144: Oceania Plant Derived & Synthetic Sugar Market Y-o-Y Growth (%) Projections by Source, 2019-2029
Figure 145: Oceania Plant Derived & Synthetic Sugar Market Value (MT) Analysis by Country, 2019 & 2029
Figure 146: Oceania Plant Derived & Synthetic Sugar Market Volume (US$ Mn) Analysis by Country, 2019 & 2029
Figure 147: Oceania Plant Derived & Synthetic Sugar Market Value Share (%) and BPS Analysis by Country, 2019 & 2029
Figure 148: Oceania Plant Derived & Synthetic Sugar Market Y-o-Y Growth (%) Projections by Country, 2019-2029
Figure 149: Oceania Plant Derived & Synthetic Sugar Market Attractiveness Analysis, by Sugar Type, 2019 & 2029
Figure 150: Oceania Plant Derived & Synthetic Sugar Market Attractiveness Analysis, by Form Type, 2019 & 2029
Figure 151: Oceania Plant Derived & Synthetic Sugar Market Attractiveness Analysis, by Source, 2019 & 2029
Figure 152: Oceania Plant Derived & Synthetic Sugar Market Attractiveness Analysis, by End Use
Figure 153: Oceania Plant Derived & Synthetic Sugar Market Attractiveness Analysis, by Country
Figure 154 : Japan Plant Derived & Synthetic Sugar Market Volume (MT) by Sugar Type, 2019 & 2029
Figure 155 : Japan Plant Derived & Synthetic Sugar Market Value (US$ Mn) by Sugar Type, 2019 & 2029
Figure 156: Japan Plant Derived & Synthetic Sugar Market Value Share (%) and BPS Analysis by Sugar Type, 2019 & 2029
Figure 157: Japan Plant Derived & Synthetic Sugar Market Y-o-Y Growth (%) Projections by Sugar Type, 2019-2029
Figure 158: Japan Plant Derived & Synthetic Sugar Market Volume (MT) Analysis by Form Type, 2019 & 2029
Figure 159: Japan Plant Derived & Synthetic Sugar Market Value (US$ Mn) Analysis by Form Type, 2019 & 2029
Figure 160: Japan Plant Derived & Synthetic Sugar Market Value Share (%) and BPS Analysis by Form Type, 2019 & 2029
Figure 161: Japan Plant Derived & Synthetic Sugar Market Y-o-Y Growth (%) Projections by Form Type, 2019-2029
Figure 162: Japan Plant Derived & Synthetic Sugar Market Volume (MT) Analysis by End Use, 2019 & 2029
Figure 163: Japan Plant Derived & Synthetic Sugar Market Value (US$ Mn) Analysis by End Use, 2019 & 2029
Figure 164: Japan Plant Derived & Synthetic Sugar Market Value Share (%) and BPS Analysis by End Use, 2019 & 2029
Figure 165: Japan Plant Derived & Synthetic Sugar Market Y-o-Y Growth (%) Projections by End Use, 2019-2029
Figure 166: Japan Plant Derived & Synthetic Sugar Market Volume (MT) Analysis by Source, 2019 & 2029
Figure 167: Japan Plant Derived & Synthetic Sugar Market Value (US$ Mn) Analysis by Source, 2019 & 2029
Figure 168: Japan Plant Derived & Synthetic Sugar Market Value Share (%) and BPS Analysis by Source, 2019 & 2029
Figure 169: Japan Plant Derived & Synthetic Sugar Market Y-o-Y Growth (%) Projections by Source, 2019-2029
Figure 170: Japan Plant Derived & Synthetic Sugar Market Value (MT) Analysis by Country, 2019 & 2029
Figure 171: Japan Plant Derived & Synthetic Sugar Market Volume (US$ Mn) Analysis by Country, 2019 & 2029
Figure 172: Japan Plant Derived & Synthetic Sugar Market Value Share (%) and BPS Analysis by Country, 2019 & 2029
Figure 173: Japan Plant Derived & Synthetic Sugar Market Y-o-Y Growth (%) Projections by Country, 2019-2029
Figure 174: Japan Plant Derived & Synthetic Sugar Market Attractiveness Analysis, by Sugar Type, 2019 & 2029
Figure 175: Japan Plant Derived & Synthetic Sugar Market Attractiveness Analysis, by Form Type, 2019 & 2029
Figure 176: Japan Plant Derived & Synthetic Sugar Market Attractiveness Analysis, by Source, 2019 & 2029
Figure 177: Japan Plant Derived & Synthetic Sugar Market Attractiveness Analysis, by End Use
Figure 178: Japan Plant Derived & Synthetic Sugar Market Attractiveness Analysis, by Country
Figure 179 : MEA Plant Derived & Synthetic Sugar Market Volume (MT) by Sugar Type, 2019 & 2029
Figure 180 : MEA Plant Derived & Synthetic Sugar Market Value (US$ Mn) by Sugar Type, 2019 & 2029
Figure 181: MEA Plant Derived & Synthetic Sugar Market Value Share (%) and BPS Analysis by Sugar Type, 2019 & 2029
Figure 182: MEA Plant Derived & Synthetic Sugar Market Y-o-Y Growth (%) Projections by Sugar Type, 2019-2029
Figure 183: MEA Plant Derived & Synthetic Sugar Market Volume (MT) Analysis by Form Type, 2019 & 2029
Figure 184: MEA Plant Derived & Synthetic Sugar Market Value (US$ Mn) Analysis by Form Type, 2019 & 2029
Figure 185: MEA Plant Derived & Synthetic Sugar Market Value Share (%) and BPS Analysis by Form Type, 2019 & 2029
Figure 186: MEA Plant Derived & Synthetic Sugar Market Y-o-Y Growth (%) Projections by Form Type, 2019-2029
Figure 187: MEA Plant Derived & Synthetic Sugar Market Volume (MT) Analysis by End Use, 2019 & 2029
Figure 188: MEA Plant Derived & Synthetic Sugar Market Value (US$ Mn) Analysis by End Use, 2019 & 2029
Figure 189: MEA Plant Derived & Synthetic Sugar Market Value Share (%) and BPS Analysis by End Use, 2019 & 2029
Figure 190: MEA Plant Derived & Synthetic Sugar Market Y-o-Y Growth (%) Projections by End Use, 2019-2029
Figure 191: MEA Plant Derived & Synthetic Sugar Market Volume (MT) Analysis by Source, 2019 & 2029
Figure 192: MEA Plant Derived & Synthetic Sugar Market Value (US$ Mn) Analysis by Source, 2019 & 2029
Figure 193: MEA Plant Derived & Synthetic Sugar Market Value Share (%) and BPS Analysis by Source, 2019 & 2029
Figure 194: MEA Plant Derived & Synthetic Sugar Market Y-o-Y Growth (%) Projections by Source, 2019-2029
Figure 195: MEA Plant Derived & Synthetic Sugar Market Value (MT) Analysis by Country, 2019 & 2029
Figure 196: MEA Plant Derived & Synthetic Sugar Market Volume (US$ Mn) Analysis by Country, 2019 & 2029
Figure 197: MEA Plant Derived & Synthetic Sugar Market Value Share (%) and BPS Analysis by Country, 2019 & 2029
Figure 198: MEA Plant Derived & Synthetic Sugar Market Y-o-Y Growth (%) Projections by Country, 2019-2029
Figure 199: MEA Plant Derived & Synthetic Sugar Market Attractiveness Analysis, by Sugar Type, 2019 & 2029
Figure 200: MEA Plant Derived & Synthetic Sugar Market Attractiveness Analysis, by Form Type, 2019 & 2029
Figure 201: MEA Plant Derived & Synthetic Sugar Market Attractiveness Analysis, by Source, 2019 & 2029
Figure 202: MEA Plant Derived & Synthetic Sugar Market Attractiveness Analysis, by End Use
Figure 203: MEA Plant Derived & Synthetic Sugar Market Attractiveness Analysis, by Country
Copyright © Transparency Market Research, Inc. All Rights reserved
Trust Online

Plant Derived Sugar and Synthetic Sugar Market