
Reports
Reports
The global paints & coatings fillers market is witnessing a steady growth, owing to a significant surge in demand for a range of applications in industrial, automotive, and architectural sectors. Moreover, growing awareness among consumers and end-users is expected to positively influence the demand for sustainable products that contain low toxic profiles and environmental footprint. In various countries across developed regions, such as North America and Europe, the demand for paints and coatings fillers produced using eco-friendly materials is growing. Furthermore, government initiatives to curb environmental degradation and air pollution in these countries is expected to propel the demand for paints and coatings fillers during the forecast period (2019-2027). In terms of volume, the paints & coating fillers market is expected to reach ~25,465-kilo tons by the end of 2027.
Significant rise in the infrastructure development projects, especially in Asia Pacific, growth of the industrial sector worldwide, and ascending demand for automobiles are some of the leading factors that are likely to propel the growth of the paints & coatings fillers market during the forecast period.
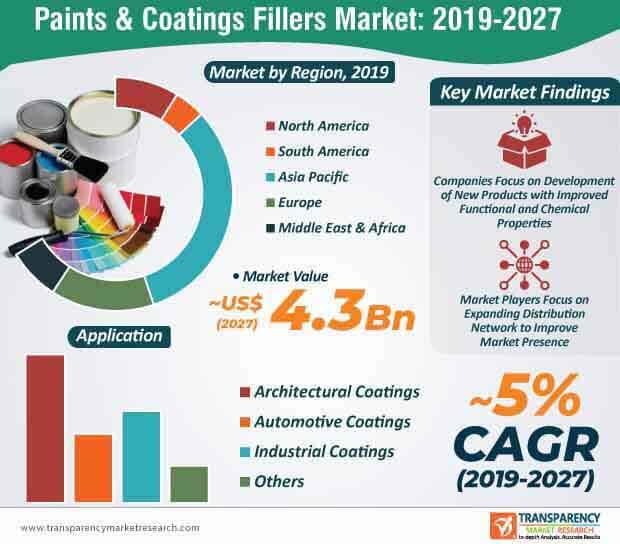
At present, more than 10% of powder coatings make use of metallic pigments and as per current trends, the demand is for architectural coatings is projected to grow at a consistent pace in the coming years. Key participants operating in the current paints & coatings fillers market landscape are continually engaged in the development of new products with improved functional and chemical properties. For several decades, players in the paints & coatings fillers market are focusing on the development of metallic powder coatings that are suitable for architectural applications. For instance, in May 2018, AGC announced that architectural coatings with superior quality can be produced by blending highly-durable polyester resins with FEVE resins.
The architectural coatings application segment is expected to hold the highest share of the paints & coatings fillers market during the forecast period, as a result of growing focus on research and development activities. The segment is expected to reach a value of ~US$ 1.9 Bn by 2027. The demand for architectural coatings is estimated to surpass ~7,658-kilo tons in 2019.
In the current scenario, owing to the mounting concerns over environmental safety, the adoption of raw materials with significantly low toxicity and VOC residual levels is on the rise.
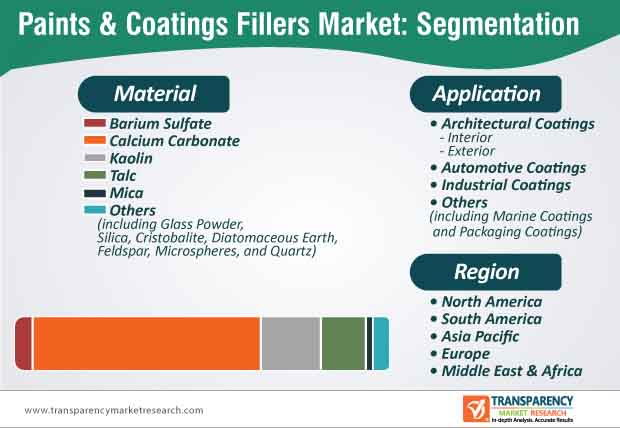
Calcium carbonate is expected to be the most favored material among end users, owing to its range of benefits and applications. It is increasingly being used as paints and coatings filler for high gloss coating products. Moreover, calcium carbonate plays a critical role in increasing the overall volume and thickness of paints, and also improves the durability and wear resistance of coatings. Due to these favorable properties of calcium carbonate, its applications, especially in the architectural sector, is expected to witness a significant growth during the forecast period. Although calcium carbonate is poised to dominate the paints & coatings fillers market, the demand for paints and coating fillers made from other materials such as kaolin, mica, barium sulfate, etc., is expected to grow at a steady pace.
In terms of material, the calcium carbonate segment is leading the paints & coatings fillers market. The calcium carbonate material segment is estimated to reach a value of ~US$ 1.8 Bn in 2019 and accounts for a market share of ~62%.
Stakeholders in the paints & coatings fillers market are entering into strategic partnerships to improve the distribution of their products. For instance, in November 2019, Omya and Kronos entered an agreement to improve the distribution of titanium dioxide pigments in Switzerland. Anticipating the growing demand for calcium carbonate, several participants in the paints & coatings fillers market are focusing on improving the production capacity of calcium carbonate in their manufacturing units. Furthermore, Asia Pacific is likely to attract significant investments in the coming years, owing to the booming industrial and architectural sectors in India, China, Indonesia, and Malaysia, among others.
Analysts’ Viewpoint
The paints & coatings fillers market is expected to expand at a CAGR of ~5% during the forecast period. The growth of the market can be attributed to the increasing demand for sustainable and eco-friendly products derived from raw materials, including calcium carbonate, kaolin, and mica. The ascending demand from the architectural segment is expected to fuel the growth of the market for paints & coatings fillers in the near future. Players operating in the current market landscape should focus on expanding their footprint by entering into strategic partnerships and collaborating with regional companies, particularly in the Asia Pacific region.
Paints & Coatings Fillers Market: Overview
Key Growth Drivers of Paints & Coatings Fillers Market
Major Challenges for Paints & Coatings Fillers Market
Lucrative Opportunities for Paints & Coatings Fillers Market
Asia Pacific to Dominate Paints & Coatings Fillers Market
High Usage of Calcium Carbonate in Applications of Paints and Coatings
Key Strategies Adopted by Market Players The global paints & coatings fillers market is fragmented. The top three players -
constituted 27.4% share of the global paints & coatings fillers market in 2018.
1. Preface
1.1. Market Definition and Scope
1.2. Market Segmentation
1.3. Key Research Objectives
1.4. Research Highlights
2. Assumptions and Research Methodology
3. Executive Summary: Global Paints & Coatings Fillers Market
4. Market Overview
4.1. Introduction
4.2. Key Market Indicators/Definitions
4.3. Market Dynamics
4.3.1. Drivers
4.3.2. Restraints
4.3.3. Opportunities
4.4. Porters Five Forces Analysis
4.5. Value Chain Analysis
4.5.1. List of Potential Customers
4.6. Global Production Output
4.7. Pricing Analysis
4.7.1. Price Trend Analysis, by Material
4.7.2. Price Trend Analysis, by Region
5. Global Paints & Coatings Fillers Market Analysis and Forecast, by Material
5.1. Introduction & Key Findings
5.2. Global Paints & Coatings Fillers Market Volume (Kilo Tons) and Value (US$ Mn) Forecast, by Material, 2018–2027
5.2.1. Barium Sulfate
5.2.2. Calcium Carbonate
5.2.3. Kaolin
5.2.4. Talc
5.2.5. Mica
5.2.6. Others
5.3. Global Paints & Coatings Fillers Market Attractiveness Analysis, by Material
6. Global Paints & Coatings Fillers Market Analysis and Forecast, by Application
6.1. Introduction & Key Findings
6.2. Global Paints & Coatings Fillers Market Volume (Kilo Tons) and Value (US$ Mn) Forecast, by Application, 2018–2027
6.2.1.1. Architectural Coatings
6.2.1.1.1. Interior
6.2.1.1.2. Exterior
6.2.1.2. Automotive Coatings
6.2.1.3. Industrial Coatings
6.2.1.4. Pharmaceutical
6.2.1.5. Others
6.3. Global Paints & Coatings Fillers Market Attractiveness Analysis, by Application
7. Global Paints & Coatings Fillers Market Analysis and Forecast, by Region
7.1. Key Findings
7.2. Global Paints & Coatings Fillers Market Volume (Kilo Tons) and Value (US$ Mn) Forecast, by Region, 2018–2027
7.3. Global Paints & Coatings Fillers Market Attractiveness Analysis, by Region, 2018
8. North America Paints & Coatings Fillers Market Analysis and Forecast
8.1. Key Findings
8.2. North America Paints & Coatings Fillers Market Forecast, by Material, 2018–2027
8.3. North America Paints & Coatings Fillers Market Forecast, by Application, 2018–2027
8.4. North America Paints & Coatings Fillers Market Forecast, by Country, 2018–2027
8.4.1. U.S. Paints & Coatings Fillers Market Volume (Kilo Tons) and Value (US$ Mn) Forecast, by Material, 2018–2027
8.4.2. U.S. Paints & Coatings Fillers Market Volume (Kilo Tons) and Value (US$ Mn) Forecast, by Application, 2018–2027
8.4.3. Canada Paints & Coatings Fillers Market Volume (Kilo Tons) and Value (US$ Mn) Forecast, by Material, 2018–2027
8.4.4. Canada Paints & Coatings Fillers Market Volume (Kilo Tons) and Value (US$ Mn) Forecast, by Application, 2018–2027
8.5. North America Paints & Coatings Fillers Market Attractiveness Analysis
9. Europe Paints & Coatings Fillers Market Analysis and Forecast
9.1. Key Findings
9.2. Europe Paints & Coatings Fillers Market Forecast, by Material, 2018–2027
9.3. Europe Paints & Coatings Fillers Market Forecast, by Application, 2018–2027
9.4. Europe Paints & Coatings Fillers Market Forecast, by Country and Sub-region, 2018–2027
9.4.1. Germany Paints & Coatings Fillers Market Volume (Kilo Tons) and Value (US$ Mn) Forecast, by Material, 2018–2027
9.4.2. Germany Paints & Coatings Fillers Market Volume (Kilo Tons) and Value (US$ Mn) Forecast, by Application, 2018–2027
9.4.3. France Paints & Coatings Fillers Market Volume (Kilo Tons) and Value (US$ Mn) Forecast, by Material, 2018–2027
9.4.4. France Paints & Coatings Fillers Market Volume (Kilo Tons) and Value (US$ Mn) Forecast, by Application, 2018–2027
9.4.5. U.K. Paints & Coatings Fillers Market Volume (Kilo Tons) and Value (US$ Mn) Forecast, by Material, 2018–2027
9.4.6. U.K. Paints & Coatings Fillers Market Volume (Kilo Tons) and Value (US$ Mn) Forecast, by Application, 2018–2027
9.4.7. Italy Paints & Coatings Fillers Market Volume (Kilo Tons) and Value (US$ Mn) Forecast, by Material, 2018–2027
9.4.8. Italy Paints & Coatings Fillers Market Volume (Kilo Tons) and Value (US$ Mn) Forecast, by Application, 2018–2027
9.4.9. Spain Paints & Coatings Fillers Market Volume (Kilo Tons) and Value (US$ Mn) Forecast, by Material, 2018–2027
9.4.10. Spain Paints & Coatings Fillers Market Volume (Kilo Tons) and Value (US$ Mn) Forecast, by Application, 2018–2027
9.4.11. Russia & CIS Paints & Coatings Fillers Market Volume (Kilo Tons) and Value (US$ Mn) Forecast, by Material, 2018–2027
9.4.12. Russia & CIS Paints & Coatings Fillers Market Volume (Kilo Tons) and Value (US$ Mn) Forecast, by Application, 2018–2027
9.4.13. Rest of Europe Paints & Coatings Fillers Market Volume (Kilo Tons) and Value (US$ Mn) Forecast, by Material, 2018–2027
9.4.14. Rest of Europe Paints & Coatings Fillers Market Volume (Kilo Tons) and Value (US$ Mn) Forecast, by Application, 2018–2027
9.5. Europe Paints & Coatings Fillers Market Attractiveness Analysis
10. Asia Pacific Paints & Coatings Fillers Market Analysis and Forecast
10.1. Key Findings
10.2. Asia Pacific Paints & Coatings Fillers Market Forecast, by Material, 2018–2027
10.3. Asia Pacific Paints & Coatings Fillers Market Forecast, by Application, 2018–2027
10.4. Asia Pacific Paints & Coatings Fillers Market Forecast, by Country and Sub-region, 2018–2027
10.4.1. China Paints & Coatings Fillers Market Volume (Kilo Tons) and Value (US$ Mn) Forecast, by Material, 2018–2027
10.4.2. China Paints & Coatings Fillers Market Volume (Kilo Tons) and Value (US$ Mn) Forecast, by Application, 2018–2027
10.4.3. Japan Paints & Coatings Fillers Market Volume (Kilo Tons) and Value (US$ Mn) Forecast, by Material, 2018–2027
10.4.4. Japan Paints & Coatings Fillers Market Volume (Kilo Tons) and Value (US$ Mn) Forecast, by Application, 2018–2027
10.4.5. India Paints & Coatings Fillers Market Volume (Kilo Tons) and Value (US$ Mn) Forecast, by Material, 2018–2027
10.4.6. India Paints & Coatings Fillers Market Volume (Kilo Tons) and Value (US$ Mn) Forecast, by Application, 2018–2027
10.4.7. Singapore Paints & Coatings Fillers Market Volume (Kilo Tons) and Value (US$ Mn) Forecast, by Material, 2018–2027
10.4.8. Singapore Paints & Coatings Fillers Market Volume (Kilo Tons) and Value (US$ Mn) Forecast, by Application, 2018–2027
10.4.9. Malaysia Paints & Coatings Fillers Market Volume (Kilo Tons) and Value (US$ Mn) Forecast, by Material, 2018–2027
10.4.10. Malaysia Paints & Coatings Fillers Market Volume (Kilo Tons) and Value (US$ Mn) Forecast, by Application, 2018–2027
10.4.11. Thailand Paints & Coatings Fillers Market Volume (Kilo Tons) and Value (US$ Mn) Forecast, by Material, 2018–2027
10.4.12. Thailand Paints & Coatings Fillers Market Volume (Kilo Tons) and Value (US$ Mn) Forecast, by Application, 2018–2027
10.4.13. Indonesia Paints & Coatings Fillers Market Volume (Kilo Tons) and Value (US$ Mn) Forecast, by Material, 2018–2027
10.4.14. Indonesia Paints & Coatings Fillers Market Volume (Kilo Tons) and Value (US$ Mn) Forecast, by Application, 2018–2027
10.4.15. Rest of Asia Pacific Paints & Coatings Fillers Market Volume (Kilo Tons) and Value (US$ Mn) Forecast, by Material, 2018–2027
10.4.16. Rest of Asia Pacific Paints & Coatings Fillers Market Volume (Kilo Tons) and Value (US$ Mn) Forecast, by Application, 2018–2027
10.5. Asia Pacific Paints & Coatings Fillers Market Attractiveness Analysis
11. Latin America Paints & Coatings Fillers Market Analysis and Forecast
11.1. Key Findings
11.2. Latin America Paints & Coatings Fillers Market Forecast, by Material, 2018–2027
11.3. Latin America Paints & Coatings Fillers Market Forecast, by Application, 2018–2027
11.4. Latin America Paints & Coatings Fillers Market Forecast, by Country and Sub-region, 2018–2027
11.4.1. Brazil Paints & Coatings Fillers Market Volume (Kilo Tons) and Value (US$ Mn) Forecast, by Material, 2018–2027
11.4.2. Brazil Paints & Coatings Fillers Market Volume (Kilo Tons) and Value (US$ Mn) Forecast, by Application, 2018–2027
11.4.3. Mexico Paints & Coatings Fillers Market Volume (Kilo Tons) and Value (US$ Mn) Forecast, by Material, 2018–2027
11.4.4. Mexico Paints & Coatings Fillers Market Volume (Kilo Tons) and Value (US$ Mn) Forecast, by Application, 2018–2027
11.4.5. Rest of Latin America Paints & Coatings Fillers Market Volume (Kilo Tons) and Value (US$ Mn) Forecast, by Material, 2018–2027
11.4.6. Rest of Latin America Paints & Coatings Fillers Market Volume (Kilo Tons) and Value (US$ Mn) Forecast, by Application, 2018–2027
11.5. Latin America Paints & Coatings Fillers Market Attractiveness Analysis
12. Middle East & Africa Paints & Coatings Fillers Market Analysis and Forecast
12.1. Key Findings
12.2. Middle East & Africa Paints & Coatings Fillers Market Forecast, by Material, 2018–2027
12.3. Middle East & Africa Paints & Coatings Fillers Market Forecast, by Application, 2018–2027
12.4. Middle East & Africa Paints & Coatings Fillers Market Forecast, by Country and Sub-region, 2018–2027
12.4.1. GCC Paints & Coatings Fillers Market Volume (Kilo Tons) and Value (US$ Mn) Forecast, by Material, 2018–2027
12.4.2. GCC Paints & Coatings Fillers Market Volume (Kilo Tons) and Value (US$ Mn) Forecast, by Application, 2018–2027
12.4.3. South Africa Paints & Coatings Fillers Market Volume (Kilo Tons) and Value (US$ Mn) Forecast, by Material, 2018–2027
12.4.4. South Africa Paints & Coatings Fillers Market Volume (Kilo Tons) and Value (US$ Mn) Forecast, by Application, 2018–2027
12.4.5. Rest of Middle East & Africa Paints & Coatings Fillers Market Volume (Kilo Tons) and Value (US$ Mn) Forecast, by Material, 2018–2027
12.4.6. Rest of Middle East & Africa Paints & Coatings Fillers Market Volume (Kilo Tons) and Value (US$ Mn) Forecast, by Application, 2018–2027
12.5. Middle East & Africa Paints & Coatings Fillers Market Attractiveness Analysis
13. Competition Landscape
13.1. Global Paints & Coatings Fillers Market Share Analysis, by Company, 2018
13.2. Company Profiles
13.2.1. Minerals Technologies Inc.
13.2.1.1. Company Description
13.2.1.2. Business Overview
13.2.1.3. Financial Details
13.2.1.4. Key Developments
13.2.2. Omya AG
13.2.2.1. Company Description
13.2.2.2. Business Overview
13.2.3. Imerys
13.2.3.1. Company Description
13.2.3.2. Business Overview
13.2.3.3. Financial Details
13.2.3.4. Key Developments
13.2.4. Sibelco
13.2.4.1. Company Description
13.2.4.2. Business Overview
13.2.4.3. Financial Details
13.2.4.4. Key Developments
13.2.5. Gebrüder Dorfner GmbH & Co
13.2.5.1. Company Description
13.2.5.2. Business Overview
13.2.5.3. Financial Details
13.2.5.4. Key Developments
13.2.6. 3M
13.2.6.1. Company Description
13.2.6.2. Business Overview
13.2.6.3. Financial Details
13.2.6.4. Key Developments
13.2.7. Willamette Valley Company
13.2.7.1. Company Description
13.2.7.2. Business Overview
13.2.8. IMCD N.V.
13.2.8.1. Company Description
13.2.8.2. Business Overview
13.2.8.3. Financial Details
13.2.8.4. Key Developments
13.2.9. Huber Engineered Materials
13.2.9.1. Company Description
13.2.9.2. Business Overview
13.2.10. Mississippi Lime Company
13.2.10.1. Company Description
13.2.10.2. Business Overview
13.2.11. Shaanxi Fuhua Chemical Co., Ltd.
13.2.11.1. Company Description
13.2.11.2. Business Overview
13.2.12. Nippon Electric Glass Co.,Ltd
13.2.12.1. Company Description
13.2.12.2. Business Overview
13.2.12.3. Financial Details
13.2.12.4. Key Developments
13.2.13. U.S. Aggregates Inc.
13.2.13.1. Company Description
13.2.13.2. Business Overview
13.2.14. Excalibar Minerals LLC
13.2.14.1. Company Description
13.2.14.2. Business Overview
13.2.15. Solvay S.A.
13.2.15.1. Company Description
13.2.15.2. Business Overview
13.2.15.3. Financial Details
13.2.15.4. Key Developments
13.2.16. Ashapura Group
13.2.16.1. Company Description
13.2.16.2. Business Overview
13.2.16.3. Financial Details
13.2.16.4. Key Developments
13.2.17. Vanderbilt Minerals, LLC
13.2.17.1. Company Description
13.2.17.2. Business Overview
List of Tables
Table 01: List of Potential Customers
Table 02: List of Potential Customers
Table 03: Global Paints & Coatings Fillers Market Volume (Kilo Tons) Forecast, by Material, 2018–2027
Table 04: Global Paints & Coatings Fillers Market Value (US$ Mn) Forecast, by Material, 2018–2027
Table 05: Global Paints & Coatings Fillers Market Volume (Kilo Tons) Forecast, by Application, 2018–202
Table 06: Global Paints & Coatings Fillers Market Value (US$ Mn) Forecast, by Application, 2018–2027
Table 07: Global Paints & Coatings Fillers Market Volume (Kilo Tons) Forecast, by Region, 2018–2027
Table 08: Global Paints & Coatings Fillers Market Value (US$ Mn) Forecast, by Region, 2018–2027
Table 09: Global Paints & Coatings Fillers Market Volume (Kilo Tons) Forecast, by Material, 2018–2027
Table 10: North America Paints & Coatings Fillers Market Value (US$ Mn) Forecast, by Material, 2018–2027
Table 11: North America Paints & Coatings Fillers Market Volume (Kilo Tons) Forecast, by Application, 2018–2027
Table 12: North America Paints & Coatings Fillers Market Value (US$ Mn) Forecast, by Application, 2018–2027
Table 13: North America Paints & Coatings Fillers Market Volume (Kilo Tons) Forecast, by Country, 2018–2027
Table 14: North America Paints & Coatings Fillers Market Value (US$ Mn) Forecast, by Country, 2018–2027
Table 15: U.S. Paints & Coatings Fillers Market Volume (Kilo Tons) Forecast, by Material, 2018–2027
Table 16: U.S. Paints & Coatings Fillers Market Value (US$ Mn) Forecast, by Material, 2018–2027
Table 17: U.S. Paints & Coatings Fillers Market Volume (Kilo Tons) Forecast, by Application, 2018–2027
Table 18: U.S. Paints & Coatings Fillers Market Value (US$ Mn) Forecast, by Application, 2018–2027
Table 19: Canada Paints & Coatings Fillers Market Volume (Kilo Tons) Forecast, by Material, 2018–2027
Table 20: Canada Paints & Coatings Fillers Market Value (US$ Mn) Forecast, by Material, 2018–2027
Table 21: Canada Paints & Coatings Fillers Market Volume (Kilo Tons) Forecast, by Application, 2018–2027
Table 22: Canada Paints & Coatings Fillers Market Value (US$ Mn) Forecast, by Application, 2018–2027
Table 23: Europe Paints & Coatings Fillers Market Volume (Kilo Tons) Forecast, by Material, 2018–2027
Table 24: Europe Paints & Coatings Fillers Market Value (US$ Mn) Forecast, by Material, 2018–2027
Table 25: Europe Paints & Coatings Fillers Market Volume (Kilo Tons) Forecast, by Application, 2018–202
Table 26: Europe Paints & Coatings Fillers Market Value (US$ Mn) Forecast, by Application, 2018–2027
Table 27: Europe Paints & Coatings Fillers Market Volume (Kilo Tons) Forecast, by Country and Sub-region, 2018–2027
Table 28: Europe Paints & Coatings Fillers Market Value (US$ Mn) Forecast, by Country and Sub-region, 2018–2027
Table 29: Germany Paints & Coatings Fillers Market Volume (Kilo Tons) Forecast, by Material, 2018–2027
Table 30: Germany Paints & Coatings Fillers Market Value (US$ Mn) Forecast, by Material, 2018–2027
Table 31: Germany Paints & Coatings Fillers Market Volume (Kilo Tons) Forecast, by Application, 2018–2027
Table 32: Germany Paints & Coatings Fillers Market Value (US$ Mn) Forecast, by Application, 2018–2027
Table 33: France Paints & Coatings Fillers Market Volume (Kilo Tons) Forecast, by Material, 2018–2027
Table 34: France Paints & Coatings Fillers Market Value (US$ Mn) Forecast, by Material, 2018–2027
Table 35: France Paints & Coatings Fillers Market Volume (Kilo Tons) Forecast, by Application, 2018–202
Table 36: France Paints & Coatings Fillers Market Value (US$ Mn) Forecast, by Application, 2018–2027
Table 37: U.K. Paints & Coatings Fillers Market Volume (Kilo Tons) Forecast, by Material, 2018–2027
Table 38: U.K. Paints & Coatings Fillers Market Value (US$ Mn) Forecast, by Material, 2018–2027
Table 39: U.K. Paints & Coatings Fillers Market Volume (Kilo Tons) Forecast, by Application, 2018–2027
Table 40: U.K. Paints & Coatings Fillers Market Value (US$ Mn) Forecast, by Application, 2018–2027
Table 41: Italy Paints & Coatings Fillers Market Volume (Kilo Tons) Forecast, by Material, 2018–2027
Table 42: Italy Paints & Coatings Fillers Market Value (US$ Mn) Forecast, by Material, 2018–2027
Table 43: Italy Paints & Coatings Fillers Market Volume (Kilo Tons) Forecast, by Application, 2018–2027
Table 44: Italy Paints & Coatings Fillers Market Value (US$ Mn) Forecast, by Application, 2018–2027
Table 45: Spain Paints & Coatings Fillers Market Volume (Kilo Tons) Forecast, by Material, 2018–2027
Table 46: Spain Paints & Coatings Fillers Market Value (US$ Mn) Forecast, by Material, 2018–2027
Table 47: Spain Paints & Coatings Fillers Market Volume (Kilo Tons) Forecast, by Application, 2018–2027
Table 48: Spain Paints & Coatings Fillers Market Value (US$ Mn) Forecast, by Application, 2018–2027
Table 49: Russia & CIS Paints & Coatings Fillers Market Volume (Kilo Tons) Forecast, by Material, 2018–2027
Table 50: Russia & CIS Paints & Coatings Fillers Market Value (US$ Mn) Forecast, by Material, 2018–2027
Table 51: Russia & CIS Paints & Coatings Fillers Market Volume (Kilo Tons) Forecast, by Application, 2018–2027
Table 52: Russia & CIS Paints & Coatings Fillers Market Value (US$ Mn) Forecast, by Application, 2018–2027
Table 53: Rest of Europe Paints & Coatings Fillers Market Volume (Kilo Tons) Forecast, by Material, 2018–2027
Table 54: Rest of Europe Paints & Coatings Fillers Market Value (US$ Mn) Forecast, by Material, 2018–2027
Table 55: Rest of Europe Paints & Coatings Fillers Market Volume (Kilo Tons) Forecast, by Application, 2018–2027
Table 56: Rest of Europe Paints & Coatings Fillers Market Value (US$ Mn) Forecast, by Application, 2018–2027
Table 57: Asia Pacific Paints & Coatings Fillers Market Volume (Kilo Tons) Forecast, by Material, 2018–2027
Table 58: Asia Pacific Paints & Coatings Fillers Market Value (US$ Mn) Forecast, by Material, 2018–2027
Table 59: Asia Pacific Paints & Coatings Fillers Market Volume (Kilo Tons) Forecast, by Application, 2018–2027
Table 60: Asia Pacific Paints & Coatings Fillers Market Value (US$ Mn) Forecast, by Application, 2018–2027
Table 61: Asia Pacific Paints & Coatings Fillers Market Volume (Kilo Tons) Forecast, by Country and Sub-region, 2018–2027
Table 62: Asia Pacific Paints & Coatings Fillers Market Value (US$ Mn) Forecast, by Country and Sub-region, 2018–2027
Table 63: China Paints & Coatings Fillers Market Volume (Kilo Tons) Forecast, by Material, 2018–2027
Table 64: China Paints & Coatings Fillers Market Value (US$ Mn) Forecast, by Material, 2018–2027
Table 65: China Paints & Coatings Fillers Market Volume (Kilo Tons) Forecast, by Application, 2018–2027
Table 66: China Paints & Coatings Fillers Market Value (US$ Mn) Forecast, by Application, 2018–2027
Table 67: Japan Paints & Coatings Fillers Market Volume (Kilo Tons) Forecast, by Material, 2018–2027
Table 68: Japan Paints & Coatings Fillers Market Value (US$ Mn) Forecast, by Material, 2018–2027
Table 69: Japan Paints & Coatings Fillers Market Volume (Kilo Tons) Forecast, by Application, 2018–2027
Table 70: Japan Paints & Coatings Fillers Market Value (US$ Mn) Forecast, by Application, 2018–2027
Table 71: India Paints & Coatings Fillers Market Volume (Kilo Tons) Forecast, by Material, 2018–2027
Table 72: India Paints & Coatings Fillers Market Value (US$ Mn) Forecast, by Material, 2018–2027
Table 73: India Paints & Coatings Fillers Market Volume (Kilo Tons) Forecast, by Application, 2018–2027
Table 74: India Paints & Coatings Fillers Market Value (US$ Mn) Forecast, by Application, 2018–2027
Table 75: Singapore Paints & Coatings Fillers Market Volume (Kilo Tons) Forecast, by Material, 2018–2027
Table 76: Singapore Paints & Coatings Fillers Market Value (US$ Mn) Forecast, by Material, 2018–2027
Table 77: Singapore Paints & Coatings Fillers Market Volume (Kilo Tons) Forecast, by Application, 2018–2027
Table 78: Singapore Paints & Coatings Fillers Market Value (US$ Mn) Forecast, by Application, 2018–2027
Table 79: Malaysia Paints & Coatings Fillers Market Volume (Kilo Tons) Forecast, by Material, 2018–2027
Table 80: Malaysia Paints & Coatings Fillers Market Value (US$ Mn) Forecast, by Material, 2018–2027
Table 81: Malaysia Paints & Coatings Fillers Market Volume (Kilo Tons) Forecast, by Application, 2018–2027
Table 82: Malaysia Paints & Coatings Fillers Market Value (US$ Mn) Forecast, by Application, 2018–2027
Table 83: Thailand Paints & Coatings Fillers Market Volume (Kilo Tons) Forecast, by Material, 2018–2027
Table 84: Thailand Paints & Coatings Fillers Market Value (US$ Mn) Forecast, by Material, 2018–2027
Table 85: Thailand Paints & Coatings Fillers Market Volume (Kilo Tons) Forecast, by Application, 2018–2027
Table 86: Thailand Paints & Coatings Fillers Market Value (US$ Mn) Forecast, by Application, 2018–2027
Table 87: Indonesia Paints & Coatings Fillers Market Volume (Kilo Tons) Forecast, by Material, 2018–2027
Table 88: Indonesia Paints & Coatings Fillers Market Value (US$ Mn) Forecast, by Material, 2018–2027
Table 89: Indonesia Paints & Coatings Fillers Market Volume (Kilo Tons) Forecast, by Application, 2018–2027
Table 90: Indonesia Paints & Coatings Fillers Market Value (US$ Mn) Forecast, by Application, 2018–2027
Table 91: Rest of Asia Pacific Paints & Coatings Fillers Market Volume (Kilo Tons) Forecast, by Material, 2018–2027
Table 92: Rest of Asia Pacific Paints & Coatings Fillers Market Value (US$ Mn) Forecast, by Material, 2018–2027
Table 93: Rest of Asia Pacific Paints & Coatings Fillers Market Volume (Kilo Tons) Forecast, by Application, 2018–2027
Table 94: Rest of Asia Pacific Paints & Coatings Fillers Market Value (US$ Mn) Forecast, by Application, 2018–2027
Table 95: Latin America Paints & Coatings Fillers Market Volume (Kilo Tons) Forecast, by Material, 2018–2027
Table 96: Latin America Paints & Coatings Fillers Market Value (US$ Mn) Forecast, by Material, 2018–2027
Table 97: Latin America Paints & Coatings Fillers Market Volume (Kilo Tons) Forecast, by Application, 2018–2027
Table 98: Latin America Paints & Coatings Fillers Market Value (US$ Mn) Forecast, by Application, 2018–2027
Table 99: Latin America Paints & Coatings Fillers Market Volume (Kilo Tons) Forecast, by Country and Sub-region, 2018–2027
Table 100: Latin America Paints & Coatings Fillers Market Value (US$ Mn) Forecast, by Country and Sub-region, 2018–2027
Table 101: Brazil Paints & Coatings Fillers Market Volume (Kilo Tons) Forecast, by Material, 2018–2027
Table 102: Brazil Paints & Coatings Fillers Market Value (US$ Mn) Forecast, by Material, 2018–2027
Table 103: Brazil Paints & Coatings Fillers Market Volume (Kilo Tons) Forecast, by Application, 2018–2027
Table 104: Brazil Paints & Coatings Fillers Market Value (US$ Mn) Forecast, by Application, 2018–2027
Table 105: Mexico Paints & Coatings Fillers Market Volume (Kilo Tons) Forecast, by Material, 2018–2027
Table 106: Mexico Paints & Coatings Fillers Market Value (US$ Mn) Forecast, by Material, 2018–2027
Table 107: Mexico Paints & Coatings Fillers Market Volume (Kilo Tons) Forecast, by Application, 2018–2027
Table 108: Mexico Paints & Coatings Fillers Market Value (US$ Mn) Forecast, by Application, 2018–2027
Table 109: Rest of Latin America Paints & Coatings Fillers Market Volume (Kilo Tons) Forecast, by Material, 2018–2027
Table 110: Rest of Latin America Paints & Coatings Fillers Market Value (US$ Mn) Forecast, by Material, 2018–2027
Table 111: Rest of Latin America Paints & Coatings Fillers Market Volume (Kilo Tons) Forecast, by Application, 2018–2027
Table 112: Rest of Latin America Paints & Coatings Fillers Market Value (US$ Mn) Forecast, by Application, 2018–2027
Table 113: Middle East & Africa Paints & Coatings Fillers Market Volume (Kilo Tons) Forecast, by Material, 2018–2027
Table 114: Middle East & Africa Paints & Coatings Fillers Market Value (US$ Mn) Forecast, by Material, 2018–2027
Table 115: Middle East & Africa Paints & Coatings Fillers Market Volume (Kilo Tons) Forecast, by Application, 2018–2027
Table 116: Middle East & Africa Paints & Coatings Fillers Market Value (US$ Mn) Forecast, by Application, 2018–2027
Table 117: Middle East & Africa Paints & Coatings Fillers Market Volume (Kilo Tons) Forecast, by Country and Sub-region, 2018–2027
Table 118: Middle East & Africa Paints & Coatings Fillers Market Value (US$ Mn) Forecast, by Country and Sub-region, 2018–2027
Table 119: GCC Paints & Coatings Fillers Market Volume (Kilo Tons) Forecast, by Material, 2018–2027
Table 120: GCC Paints & Coatings Fillers Market Value (US$ Mn) Forecast, by Material, 2018–2027
Table 121: GCC Paints & Coatings Fillers Market Volume (Kilo Tons) Forecast, by Application, 2018–2027
Table 122: GCC Paints & Coatings Fillers Market Value (US$ Mn) Forecast, by Application, 2018–2027
Table 123: South Africa Paints & Coatings Fillers Market Volume (Kilo Tons) Forecast, by Material, 2018–2027
Table 124: South Africa Paints & Coatings Fillers Market Value (US$ Mn) Forecast, by Material, 2018–2027
Table 125: South Africa Paints & Coatings Fillers Market Volume (Kilo Tons) Forecast, by Application, 2018–2027
Table 126: South Africa Paints & Coatings Fillers Market Value (US$ Mn) Forecast, by Application, 2018–2027
Table 127: Rest of Middle East & Africa Paints & Coatings Fillers Market Volume (Kilo Tons) Forecast, by Material, 2018–2027
Table 128: Rest of Middle East & Africa Paints & Coatings Fillers Market Value (US$ Mn) Forecast, by Material, 2018–2027
Table 129: Rest of Middle East & Africa Paints & Coatings Fillers Market Volume (Kilo Tons) Forecast, by Application, 2018–2027
Table 130: Rest of Middle East & Africa Paints & Coatings Fillers Market Value (US$ Mn) Forecast, by Application, 2018–2027
List of Figures
Figure 01: Global Paints & Coatings Fillers Market Volume Share, by Application, 2018
Figure 02: Global Paints & Coatings Fillers Market Volume Share, by Material, 2018
Figure 03: Global Paints & Coatings Fillers Market Volume Share, by Region, 2018
Figure 04: Production Output of Paints & Coatings Fillers, by Region, 2018
Figure 05: Global Paints & Coatings Fillers Price Trend, by Material (US$/Ton), 2018–2027
Figure 06: Global Paints & Coatings Fillers Price Trend, by Region (US$/Ton), 2018–2027
Figure 07: Global Paints & Coatings Fillers Market Volume, by Material, 2018 and 2027
Figure 08: Global Paints & Coatings Fillers Market Volume, by Application, 2018 and 2027
Figure 09: Global Paints & Coatings Fillers Market Volume Share, by Region, 2018 and 2027
Figure 10: Global Paints & Coatings Fillers Market Attractiveness Analysis, by Material
Figure 11: Global Paints & Coatings Fillers Market Attractiveness Analysis, by Application
Figure 12: Global Paints & Coatings Fillers Market Attractiveness Analysis, by Region
Figure 13: North America Paints & Coatings Fillers Market Volume, by Material, 2018 and 2027
Figure 14: North America Paints & Coatings Fillers Market Attractiveness Analysis, by Material
Figure 15: North America Paints & Coatings Fillers Market Volume, by Application, 2018 and 2027
Figure 16: North America Paints & Coatings Fillers Market Attractiveness Analysis, by Application
Figure 17: North America Paints & Coatings Fillers Market Volume Share, by Country, 2018 and 2027
Figure 18: North America Paints & Coatings Fillers Market Attractiveness Analysis, by Country
Figure 19: Europe Paints & Coatings Fillers Market Volume, by Material, 2018 and 2027
Figure 20: Europe Paints & Coatings Fillers Market Attractiveness Analysis, by Material
Figure 21: Europe Paints & Coatings Fillers Market Volume, by Application, 2018 and 2027
Figure 22: Europe Paints & Coatings Fillers Market Attractiveness Analysis, by Application
Figure 23: Europe Paints & Coatings Fillers Market Volume Share, by Country, 2018 and 2027
Figure 24: Europe Paints & Coatings Fillers Market Attractiveness Analysis, by Country and Sub-region
Figure 25: Asia Pacific Paints & Coatings Fillers Market Volume, by Material, 2018 and 2027
Figure 26: Asia Pacific Paints & Coatings Fillers Market Attractiveness Analysis, by Material
Figure 27: Asia Pacific Paints & Coatings Fillers Market Volume, by Application, 2018 and 2027
Figure 28: Asia Pacific Paints & Coatings Fillers Market Attractiveness Analysis, by Application
Figure 29: Asia Pacific Paints & Coatings Fillers Market Volume Share, by Country and Sub-region, 2018 and 2027
Figure 30: Asia Pacific Paints & Coatings Fillers Market Attractiveness Analysis, by Country and Sub-region
Figure 31: Latin America Paints & Coatings Fillers Market Volume, by Material, 2018 and 2027
Figure 32: Latin America Paints & Coatings Fillers Market Attractiveness Analysis, by Material
Figure 33: Latin America Paints & Coatings Fillers Market Volume, by Application, 2018 and 2027
Figure 34: Latin America Paints & Coatings Fillers Market Attractiveness Analysis, by Application
Figure 35: Latin America Paints & Coatings Fillers Market Volume Share, by Country and Sub-region, 2018 and 2027
Figure 36: Latin America Paints & Coatings Fillers Market Attractiveness Analysis, by Country and Sub-region
Figure 37: Middle East & Africa Paints & Coatings Fillers Market Volume, by Material, 2018 and 2027
Figure 38: Middle East & Africa Paints & Coatings Fillers Market Attractiveness Analysis, by Material
Figure 39: Middle East & Africa Paints & Coatings Fillers Market Volume, by Application, 2018 and 2027
Figure 40: Middle East & Africa Paints & Coatings Fillers Market Attractiveness Analysis, by Application
Figure 41: Middle East & Africa Paints & Coatings Fillers Market Volume Share, by Country and Sub-region, 2018 and 2027
Figure 42: Middle East & Africa Paints & Coatings Fillers Market Attractiveness Analysis, by Country and Sub-region
Figure 43: Global Paints & Coatings Fillers Market Share, by Company, 2018
Copyright © Transparency Market Research, Inc. All Rights reserved
Trust Online

Paints & Coatings Fillers Market