
Reports
Reports
Global Non-opioid Pain Patch Market: Need for Non-addictive Chronic Pain Treatment to Foster Growth
Researchers have prioritized the search for non-opioid drugs with escalating rates of opioid addiction. For years, physicians had been providing an aggressive treatment for chronic treatment resulting in narcotic-addiction among patients. However, the healthcare industry is no longer marrying the concept of pain relief with narcotic analgesics. Medical pain-management as a whole is drifting away from addictive procedures or treatments towards evidence-based treatments using non-opioid analgesics.
The sharp rise in the number of overdose deaths only echoes the magnitude of the crisis caused by the opioid epidemic. According to the World Health Organization, 27 Mn people suffered from opioid disorders in 2016. Overdose deaths accounted for around a third and a half of all the drug-related deaths.
The rising popularity of non-opioids as the “analgesics of the future” and efforts focused on tackling the crisis of “opioid epidemic” calls for a need to conduct an in-depth analysis of the non-opioid pain patch market. In its latest offering, Transparency Market Research talks about how the changes in healthcare trends and consumer demographics have impacted the market’s evolution.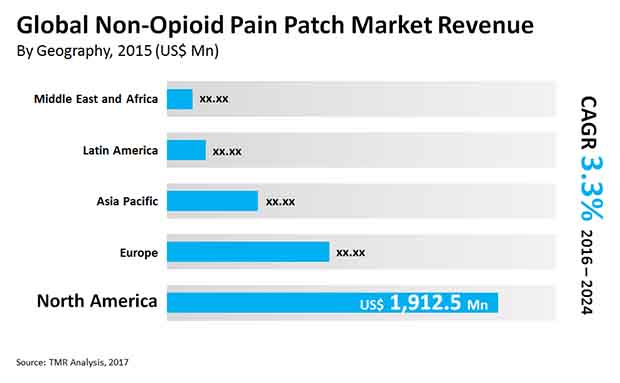
A Walk through the Evolutionary Timeline
As the consumers realized the ill-effects of opioid treatment, companies manufacturing and marketing these drugs faced public backlash. This acted as a stepping stone for the development of new non-opioid treatments which have redefined the non-opioid treatment market’s growth. In a bid to promote the use of non-opioid analgesics, the U.S. Food and Drug Administration (FDA) launched a campaign called the “innovation challenge”. It was aimed at the development of medical devices that could combat opioid use disorder.
The non-opioid pain match treatment market has come a long way from the development of the first patch product for PHN treatment in 2013 to the launch of OTC water-free lidocaine patch in March 2016. Furthermore, in February 2018, Tremeau Pharmaceuticals, Inc., closed the equity raise of $5.2 Mn to fund non-opioid treatments for rare diseases.
With the escalating new developments, the global non-opioid pain patch market is poised to rise from its initial valuation of US$ 3,750 Mn in 2015 to reach US$ 4,983.3 Mn in 2024. However, the high popularity of oral pain relief drugs due to their ability to mitigate pain in a short duration may act a stumbling block in the non-opioid pain patch market.
Trends Causing a Stir in the Non-opioid Pain Patch Market
Rising Popularity of Transdermal Drug Delivery
Transdermal delivery despite being an unexplored aspect of drug delivery is gradually entering the league of blockbuster drugs. Capitalizing on this riveting trend, non-opioid drug manufacturers are developing transdermal non-opioid painkiller patches. Moreover, the Food and Drug Administration is keen on approving transdermal drugs because of their efficacy in reducing postoperative pain. For instance, in March 2018, the FDA approved the non-opioid painkiller patch developed by Sorrento. Market players are not only launching new non-opioids but relaunching high-selling NSAIDs as into transdermal drug delivery systems.
Replacement of Existing Pain Patches with Next Gen Patches
In a bid to enhance the efficiency of the pain patch treatment, leading players are concentrating their efforts on upgrading the existing pain patches or replacing them with next-generation pain patches. This trend of introducing the existing drug with a better design has helped manufacturers garner considerable attention from the physicians and the patients. One such example of upgradation of pain patches is the study conducted by SCILEX Pharmaceuticals Inc., for the development of ZTlido, an anhydrous patch created using the patented technology. The development of such trailblazing products has amplified the adoption of non-opioid pain patches for the treatment of chronic pain.
Key Winning Imperatives
Development of Personalized Non-opioid Pain Patches
Personalized medicines have taken the medical industry by a storm with soaring number of drug manufacturers tailoring the medicines as per the patient’s needs. Banking on the rising demand for “tailored medicine”, manufacturers are relying on patient genotyping to develop personalized pain patches for the patients. Following the same trends, Assurex Health, Inc. is working on introducing a genomics test to check the suitability of pain patches. This move is also aimed at developing solution for chronic pain with considerably low side effects. This incorporation of pharmacogenomics in the non-opioid pain patch unlocks a major growth opportunity for the market players.
Building Alliances with Leading Hospitals
According to TMR’s study, consumers are most likely to buy non-opioid drugs from hospital pharmacies, making it the most preferred distribution channel for the manufacturers. Hospital pharmacies accounted for 48.3% of the non-opioid pain patch market’s share in 2016. As a result, manufacturers are building strong alliances with the leading hospitals to gain access to their customer base.
Players are also gradually moving towards online sales channels due to the improvements in the electronic payment technology. Consumer interest is gradually shifting towards online pharmacies due to the extensive range of medications available online and transparency offered in terms of prices.
A Walk through the Competition Landscape
Market players in the non-opioid pain patch market share a moderate rivalry as the market is still in its nascent stage. Although the number of market players is less, they have remarkably high global reach due to strong brand identities. The top three players in the market including Hisamitsu
Pharmaceutical Co., Inc., Acorda Therapeutics, Inc., and Endo International plc account for nearly 40% of the global market share.
These companies are relying on mergers and acquisitions, co-promotion agreements, and developing novel treatments to sustain their position in the market. Below are a few recent strategies deployed by the leading market players:
Mushrooming companies in regional markets are focusing on expanding their geographical reach through collaborations with leading pharmaceutical companies. Leading market players are supporting this move as it helps them gain access to local markets. However, it is hard to ignore the fact that this substantially increases the threat of new entrants and gives them a significant platform to proliferate the global market.
Asia Pacific hosts the highest number of regional players due to high prevalence of chronic pain and the history of opioid addiction. Some of the regional players in Asia Pacific include TEH SENG PharmaceuticalMfg. Co., Ltd., Teikoku Seiyaku Co., Ltd., and Hisamitsu Pharmaceutical Co., Inc.
Analysts’ Viewpoint
Authors of the report have a positive outlook on the non-opioid pain patch market’s growth during the forecast period. According to TMR analysts, manufacturers should engage in research and development to develop advanced next generation paint patches to expand their precincts in the market. Moreover, as there is a high demand for personalized medicines, it will be worthwhile for the market players to develop personalized non-opioid pain patches. Moreover, in order to keep up with the recent trend, companies are increasingly developing transdermal non-opioid pain patches.
The market is expected to have a high threat of new entrants during the forecast period. The easy manufacturing process of non-opioid pain patches and less investments provide a vital entry point for the new comers. They are also collaborating with the established companies in the non-opioid pain patch market, in order to expand their footprints across the globe.
1. Preface
1.1. Market Definition and Scope
1.2. Market Segmentation
1.3. Key Research Objectives
1.4. Research Highlights
2. Assumptions and Research Methodology
3. Executive Summary: Global Non-opioid Pain Patch Market
4. Market Overview
4.1. Introduction
4.1.1. Non-opioid Pain Patch Type Definition
4.1.2. Industry Evolution / Developments
4.2. Overview
4.3. Key Market Indicators
4.4. Market Dynamics
4.4.1. Drivers
4.4.2. Restraints
4.4.3. Opportunity
4.5. Global Non-opioid Pain Patch Market Analysis and Forecasts, 2014–2024
4.5.1. Market Revenue Projections (US$ Mn)
4.6. Porter’s Five Force Analysis
4.7. Market Outlook
4.8. WHO Pain Ladder
4.9. Low Back Pain Prevalence (By Region & Countries
4.10. Patch Design Technologies: Snapshot
5. Global Non-opioid Pain Patch Market Analysis and Forecasts, By Non-opioid Pain Patch Type
5.1. Introduction & Definition
5.2. Key Findings / Developments
5.3. Key Trends
5.4. Market Value Forecast By Non-opioid Pain Patch Type, 2014–2024
5.4.1. Lidocaine Patches
5.4.2. Diclofenac Patches
5.4.3. Methyl Salicylate Patches
5.4.4. Capsaicin Patches
5.4.5. Ketoprofen Patches
5.4.6. Others
5.5. Market Attractiveness By Non-opioid Pain Patch Type
6. Global Non-opioid Pain Patch Market Analysis and Forecasts, By Distribution Channels
6.1. Introduction & Definition
6.2. Key Findings / Developments
6.3. Key Trends
6.4. Market Value Forecast By Distribution Channels, 2014–2024
6.4.1. Hospital Pharmacies
6.4.2. Online Pharmacies
6.4.3. Independent Pharmacies & Drug Stores
6.5. Market Attractiveness By Distribution Channels
7. Global Non-opioid Pain Patch Market Analysis and Forecasts, By Region
7.1. Key Findings
7.2. Policies and Regulations
7.3. Market Value Forecast By Region
7.3.1. North America
7.3.2. Europe
7.3.3. Asia Pacific
7.3.4. Latin America
7.3.5. Middle East and Africa
7.4. Market Attractiveness By Country/Region
8. North America Non-opioid Pain Patch Market Analysis and Forecast
8.1. Introduction
8.1.1. Key Findings
8.1.2. Policies and Regulations
8.1.3. Key Trends
8.2. Market Value Forecast By Non-opioid Pain Patch Type, 2014–2024
8.2.1. Lidocaine Patches
8.2.2. Diclofenac Patches
8.2.3. Methyl Salicylate Patches
8.2.4. Capsaicin Patches
8.2.5. Ketoprofen Patches
8.2.6. Others
8.3. Market Value Forecast By Distribution Channels, 2014–2024
8.3.1. Hospital Pharmacies
8.3.2. Online Pharmacies
8.3.3. Independent Pharmacies & Drug Stores
8.4. Market Value Forecast By Country, 2014–2024
8.4.1. U.S.
8.4.2. Canada
8.5. Market Attractiveness Analysis
8.5.1. By Non-opioid Pain Patch Type
8.5.2. By Distribution Channels
8.5.3. By Country
9. Europe Non-opioid Pain Patch Market Analysis and Forecast
9.1. Introduction
9.1.1. Key Findings
9.1.2. Policies and Regulations
9.1.3. Key Trends
9.2. Market Value Forecast By Non-opioid Pain Patch Type, 2014–2024
9.2.1. Lidocaine Patches
9.2.2. Diclofenac Patches
9.2.3. Methyl Salicylate Patches
9.2.4. Capsaicin Patches
9.2.5. Ketoprofen Patches
9.2.6. Others
9.3. Market Value Forecast By Distribution Channels, 2014–2024
9.3.1. Hospital Pharmacies
9.3.2. Online Pharmacies
9.3.3. Independent Pharmacies & Drug Stores
9.4. Market Value Forecast By Country, 2014–2024
9.4.1. U.K.
9.4.2. Germany
9.4.3. France
9.4.4. Italy
9.4.5. Spain
9.4.6. Russia
9.4.7. Rest of Europe
9.5. Market Attractiveness Analysis
9.5.1. By Non-opioid Pain Patch Type
9.5.2. By Distribution Channels
9.5.3. By Country
10. Asia Pacific Non-opioid Pain Patch Market Analysis and Forecast
10.1. Introduction
10.1.1. Key Findings
10.1.2. Policies and Regulations
10.1.3. Key Trends
10.2. Market Value Forecast By Non-opioid Pain Patch Type, 2014–2024
10.2.1. Lidocaine Patches
10.2.2. Diclofenac Patches
10.2.3. Methyl Salicylate Patches
10.2.4. Capsaicin Patches
10.2.5. Ketoprofen Patches
10.2.6. Others
10.3. Market Value Forecast By Distribution Channels, 2014–2024
10.3.1. Hospital Pharmacies
10.3.2. Online Pharmacies
10.3.3. Independent Pharmacies & Drug Stores
10.4. Market Value Forecast By Country, 2014–2024
10.4.1. India
10.4.2. China
10.4.3. Japan
10.4.4. Australia & New Zealand
10.4.5. Rest of Asia Pacific
10.5. Market Attractiveness Analysis
10.5.1. By Non-opioid Pain Patch Type
10.5.2. By Distribution Channels
10.5.3. By Country
11. Latin America Non-opioid Pain Patch Market Analysis and Forecast
11.1. Introduction
11.1.1. Key Findings
11.1.2. Policies and Regulations
11.1.3.. Key Trends
11.2. Market Value Forecast By Non-opioid Pain Patch Type, 2014–2024
11.2.1. Lidocaine Patches
11.2.2. Diclofenac Patches
11.2.3. Methyl Salicylate Patches
11.2.4. Capsaicin Patches
11.2.5. Ketoprofen Patches
11.2.6. Others
11.3. Market Value Forecast By Distribution Channels, 2014–2024
11.3.1. Hospital Pharmacies
11.3.2. Online Pharmacies
11.3.3. Independent Pharmacies & Drug Stores
11.4. Market Value Forecast By Country, 2014–2024
11.4.1. Brazil
11.4.2. Mexico
11.4.3. Rest of Latin America
11.5. Market Attractiveness Analysis
11.5.1. By Non-opioid Pain Patch Type
11.5.2. By Distribution Channels
11.5.3. By Country
12. Middle East and Africa Non-opioid Pain Patch Market Analysis and Forecast
12.1. Introduction
12.1.1. Key Findings
12.1.2. Policies and Regulations
12.1.3. Key Trends
12.2. Market Value Forecast By Non-opioid Pain Patch Type, 2014–2024
12.2.1. Lidocaine Patches
12.2.2. Diclofenac Patches
12.2.3. Methyl Salicylate Patches
12.2.4. Capsaicin Patches
12.2.5. Ketoprofen Patches
12.2.6. Others
12.3. Market Value Forecast By Distribution Channels, 2014–2024
12.3.1. Hospital Pharmacies
12.3.2. Online Pharmacies
12.3.3. Independent Pharmacies & Drug Stores
12.4. Market Value Forecast By Country, 2014–2024
12.4.1. South Africa
12.4.2. GCC Countries
12.4.3. Rest of Middle East and Africa
12.5. Market Attractiveness Analysis
12.5.1. By Non-opioid Pain Patch Type
12.5.2. By Distribution Channels
12.5.3. By Country
13. Competition Landscape
13.1. Market Player – Competition Matrix (By Tier and Size of companies)
13.2. Market Share Analysis By Company - 2016 (Expected)
13.3. Company Profiles (Details – Overview, Financials, Recent Developments, Strategy)
13.3.1. Acorda Therapeutics, Inc.
13.3.1.1 Company Overview (HQ, Business Segments, Employee Strengths)
13.3.1.2 Financial Overview
13.3.1.3 Product Portfolio
13.3.1.4 SWOT Analysis
13.3.1.5 Strategic Overview
13.3.2. ALLERGAN
13.3.1.1 Company Overview (HQ, Business Segments, Employee Strengths)
13.3.1.2 Financial Overview
13.3.1.3 Product Portfolio
13.3.1.4 SWOT Analysis
13.3.1.5 Strategic Overview
13.3.3. Endo International plc
13.3.1.1 Company Overview (HQ, Business Segments, Employee Strengths)
13.3.1.2 Financial Overview
13.3.1.3 Product Portfolio
13.3.1.4 SWOT Analysis
13.3.1.5 Strategic Overview
13.3.4. GlaxoSmithKline plc
13.3.1.1 Company Overview (HQ, Business Segments, Employee Strengths)
13.3.1.2 Financial Overview
13.3.1.3 Product Portfolio
13.3.1.4 SWOT Analysis
13.3.1.5 Strategic Overview
13.3.5. Hisamitsu Pharmaceutical Co.,Inc.
13.3.1.1 Company Overview (HQ, Business Segments, Employee Strengths)
13.3.1.2 Financial Overview
13.3.1.3 Product Portfolio
13.3.1.4 SWOT Analysis
13.3.1.5 Strategic Overview
13.3.6. IBSA Institut Biochimque SA
13.3.1.1 Company Overview (HQ, Business Segments, Employee Strengths)
13.3.1.2 Financial Overview
13.3.1.3 Product Portfolio
13.3.1.4 SWOT Analysis
13.3.1.5 Strategic Overview
13.3.7. Mylan N.V.
13.3.1.1 Company Overview (HQ, Business Segments, Employee Strengths)
13.3.1.2 Financial Overview
13.3.1.3 Product Portfolio
13.3.1.4 SWOT Analysis
13.3.1.5 Strategic Overview
13.3.8. Pfizer, Inc.
13.3.1.1 Company Overview (HQ, Business Segments, Employee Strengths)
13.3.1.2 Financial Overview
13.3.1.3 Product Portfolio
13.3.1.4 SWOT Analysis
13.3.1.5 Strategic Overview
13.3.9. TEH SENG Pharmaceutical Mfg. Co., Ltd.
13.3.1.1 Company Overview (HQ, Business Segments, Employee Strengths)
13.3.1.2 Financial Overview
13.3.1.3 Product Portfolio
13.3.1.4 SWOT Analysis
13.3.1.5 Strategic Overview
13.3.10. Teikoku Seiyaku Co., Ltd.
13.3.1.1 Company Overview (HQ, Business Segments, Employee Strengths)
13.3.1.2 Financial Overview
13.3.1.3 Product Portfolio
13.3.1.4 SWOT Analysis
13.3.1.5 Strategic Overview
13.3.11. Others
List of Tables
Table 01: Global Non-opioid Pain Patch Market Size (US$ Mn) Forecast, by Non-opioid Pain Patch Type, 2014–2024
Table 02: Global Non-opioid Pain Patch Market Size (US$ Mn) Forecast, by Distribution Channel, 2014–2024
Table 03: Global Non-opioid Pain Patch Market Size (US$ Mn) Forecast, by Region, 2014–2024
Table 04: North America Non-opioid Pain Patch Market Size (US$ Mn) Forecast, by Country, 2014–2024
Table 05: North America Non-opioid Pain Patch Market Size (US$ Mn) Forecast, by Non-opioid Pain Patch Type, 2014–2024
Table 06: North America Non-opioid Pain Patch Market Size (US$ Mn) Forecast, by Distribution Channel, 2014–2024
Table 07: Europe Non-opioid Pain Patch Market Size (US$ Mn) Forecast, by Country/Sub-region, 2014–2024
Table 08: Europe Non-opioid Pain Patch Market Size (US$ Mn) Forecast, by Non-opioid Pain Patch Type, 2014–2024
Table 09: Europe Non-opioid Pain Patch Market Size (US$ Mn) Forecast, by Distribution Channel, 2014–2024
Table 10: Asia Pacific Non-opioid Pain Patch Market Size (US$ Mn) Forecast, by Country/Sub-Region, 2014–2024
Table 11: Asia Pacific Non-opioid Pain Patch Market Size (US$ Mn) Forecast, by Non-opioid Pain Patch Type, 2014–2024
Table 12: Asia Pacific Non-opioid Pain Patch Market Size (US$ Mn) Forecast, by Distribution Channel, 2014–2024
Table 13: Latin America Non-opioid Pain Patch Market Size (US$ Mn) Forecast, by Country/Sub-Region, 2014–2024
Table 14: Latin America Non-opioid Pain Patch Market Size (US$ Mn) Forecast, by Non-opioid Pain Patch Type, 2014–2024
Table 15: Latin America Non-opioid Pain Patch Market Size (US$ Mn) Forecast, by Distribution Channel, 2014–2024
Table 16: Middle East & Africa Non-opioid Pain Patch Market Size (US$ Mn) Forecast, by Country/Sub-Region, 2014–2024
Table 17: Middle East & Africa Non-opioid Pain Patch Market Size (US$ Mn) Forecast, by Non-opioid Pain Patch Type, 2014–2024
Table 18: Middle East & Africa Non-opioid Pain Patch Market Size (US$ Mn) Forecast, by Distribution Channel, 2014–2024
List of Figures
Figure 01: Global Non-opioid Pain Patch Market Size (US$ Mn) Forecast, 2014–2024
Figure 02: Global Non-opioid Pain Patch Market Value Share, by Non-opioid Pain Patch Type, 2016 and 2024
Figure 03: Global Lidocaine Patches Market Revenue (US$ Mn) and Y-o-Y Growth (%) Forecast, 2014–2024
Figure 04: Global Diclofenac Patches Market Revenue (US$ Mn) and Y-o-Y Growth (%) Forecast, 2014–2024
Figure 05: Global Methyl Salicylate Patches Market Revenue (US$ Mn) and Y-o-Y Growth (%) Forecast, 2014–2024
Figure 06: Global Capsaicin Patches Market Revenue (US$ Mn) and Y-o-Y Growth (%) Forecast, 2014–2024
Figure 07: Global Ketoprofen Patches Market Revenue (US$ Mn) and Y-o-Y Growth (%) Forecast, 2014–2024
Figure 08: Global Others Market Revenue (US$ Mn) and
Figure 09: Global Non-opioid Pain Patch Market Attractiveness, by Non-opioid Pain Patch Type, 2016-2024
Figure 10: Global Non-opioid Pain Patch Market Value Share, by Distribution Channel, 2016 and 2024
Figure 11: Global Non-opioid Pain Patch Market Revenue (US$ Mn) and Y-o-Y Growth (%) Forecast, by Hospital Pharmacies, 2014–2024
Figure 12: Global Non-opioid Pain Patch Market Revenue (US$ Mn) and Y-o-Y Growth (%) Forecast, by Online Pharmacies, 2014–2024
Figure 13: Global Non-opioid Pain Patch Market Revenue (US$ Mn) and Y-o-Y Growth (%) Forecast, by Independent Pharmacies & Drug Stores, 2014–2024
Figure 14: Global Non-opioid Pain Patch Market Attractiveness, by Distribution Channel, 2016–2024
Figure 15: Global Non-opioid Pain Patch Market Value Share, by Region, 2016 and 2024
Figure 16: Global Non-opioid Pain Patch Market Attractiveness, by Region, 2016–2024
Figure 17: North America Non-opioid Pain Patch Market Size (US$ Mn) Forecast, 2014–2024
Figure 18: North America Non-opioid Pain Patch Market Attractiveness, by Country, 2016–2024
Figure 19: North America Non-opioid Pain Patch Market Value Share, by Country, 2016 and 2024
Figure 20: North America Non-opioid Pain Patch Market Value Share, by Non-opioid Pain Patch Type, 2016 and 2024
Figure 21: North America Non-opioid Pain Patch Market Value Share, by Distribution Channel, 2016 and 2024
Figure 22: North America Non-opioid Pain Patch Market Attractiveness, by Non-opioid Pain Patch Type, 2016–2024
Figure 23: North America Non-opioid Pain Patch Market Attractiveness, by Distribution Channel, 2016–2024
Figure 24: Europe Non-opioid Pain Patch Market Size (US$ Mn) Forecast, 2014–2024
Figure 25: Europe Non-opioid Pain Patch Market Attractiveness, by Country, 2016–2024
Figure 26: Europe Non-opioid Pain Patch Market Value Share, by Country/Sub-region, 2016 and 2024
Figure 27: Europe Non-opioid Pain Patch Market Value Share, by Non-opioid Pain Patch Type, 2016 and 2024
Figure 28: Europe Non-opioid Pain Patch Market Value Share, by Distribution Channel, 2016 and 2024
Figure 29: Europe Non-opioid Pain Patch Market Attractiveness, by Non-opioid Pain Patch Type, 2016-2024
Figure 30: Europe Non-opioid Pain Patch Market Attractiveness, by Distribution Channel, 2016-2024
Figure 31: Asia Pacific Non-opioid Pain Patch Market Size (US$ Mn) Forecast, 2014–2024
Figure 32: Asia Pacific Non-opioid Pain Patch Market Attractiveness, by Country, 2016–2024
Figure 33: Asia Pacific Non-opioid Pain Patch Market Value Share, by Country/Sub-Region, 2016 and 2024
Figure 34: Asia Pacific Non-opioid Pain Patch Market Value Share, by Non-opioid Pain Patch Type, 2016 and 2024
Figure 35: Asia Pacific Non-opioid Pain Patch Market Value Share, by Distribution Channel, 2016 and 2024
Figure 36: Asia Pacific Non-opioid Pain Patch Market Attractiveness, by Non-opioid Pain Patch Type, 2016–2024
Figure 37: Asia Pacific Non-opioid Pain Patch Market Attractiveness, by Distribution Channel, 2016–2024
Figure 38: Latin America Non-opioid Pain Patch Market Size (US$ Mn) Forecast, 2014–2024
Figure 39: Latin America Non-opioid Pain Patch Market Attractiveness, by Country, 2016–2024
Figure 40: Latin America Non-opioid Pain Patch Market Value Share, by Country/Sub-Region, 2016 and 2024
Figure 41: Latin America Non-opioid Pain Patch Market Value Share, by Non-opioid Pain Patch Type, 2016 and 2024
Figure 42: Latin America Non-opioid Pain Patch Market Value Share, by Distribution Channel, 2016 and 2024
Figure 43: Latin America Non-opioid Pain Patch Market Attractiveness, by Non-opioid Pain Patch Type, 2016-2024
Figure 44: Latin America Non-opioid Pain Patch Market Attractiveness, by Distribution Channel, 2016-2024
Figure 45: Middle East & Africa Non-opioid Pain Patch Market Size (US$ Mn) Forecast, 2014–2024
Figure 46: Middle East & Africa Non-opioid Pain Patch Market Attractiveness, by Country, 2016–2024
Figure 47: Middle East & Africa Non-opioid Pain Patch Market Value Share, by Country/Sub-Region, 2016 and 2024
Figure 48: Middle East & Africa Non-opioid Pain Patch Market Value Share, by Non-opioid Pain Patch Type, 2016 and 2024
Figure 49: Middle East & Africa Non-opioid Pain Patch Market Value Share, by Distribution Channel, 2016 and 2024
Figure 50: Middle East & Africa Non-opioid Pain Patch Market Attractiveness, by Non-opioid Pain Patch Type, 2016-2024
Figure 51: Middle East & Africa Non-opioid Pain Patch Market Attractiveness, by Distribution Channel, 2016-2024
Figure 52: Global Non-opioid Pain Patch Market Share, by Company, 2016 (Expected)
Copyright © Transparency Market Research, Inc. All Rights reserved
Trust Online

Non-opioid Pain Patch Market