
Reports
Reports
Mobile Accelerators Market - Snapshot
Mobile accelerators are used to increase the speed of application development as well as to enable access to applications more efficiently on a mobile phone. Furthermore, this technology is intended to speed up web content, network and mobile applications, and for streamlining the web performance. Applications of mobile accelerators include WAN optimization, device acceleration, content acceleration, and others. The technology also offers enhanced user experience, reduces complex features, and increases revenues.
In terms of component of the market, source optimization is expected to dominate throughout the forecast period. Growth of source optimization is mainly supported by the growing demand for the optimization of web, content, and network with an aim to enhance the user quality of experience (QOE) and infrastructure performance. Majority of app developers are using mobile accelerators in order to modularize the application development effort. Furthermore, mobile accelerator technology assists network providers to overcome major glitches such as round trip time (RTT) and latency, and improves performance, availability, and scalability, thereby reducing complication for mobile users. In addition, rising consumption of data across the world, along with the growing requirement for mobility has propelled the demand for mobile accelerators.
The global mobile accelerator market is witnessing strong growth due to factors such as growing usage of smartphones and tablets and increasing usage of social media applications. Mobile video usage continues to rise with the widespread use of tablets and smartphones globally. Hence, the need for mobile accelerators is growing continuously to improve the application performance in terms of speed, auto upgrade, etc. Furthermore, people are spending more time on social media and related platforms; therefore, they are in continuous search of new applications related to games, online shopping, and content, which is further accelerating the demand for mobile accelerators for enhanced performance of the applications. Increasing preference of customers for high speed and minimal downloading time is driving the demand for mobile accelerators globally. Additionally, the mobile accelerator market is further fueled by the growing accessibility of Internet services in developing nations such as China, India, Brazil, and Russia. These countries are getting government support for the development of electronic infrastructure, which includes Internet connectivity.
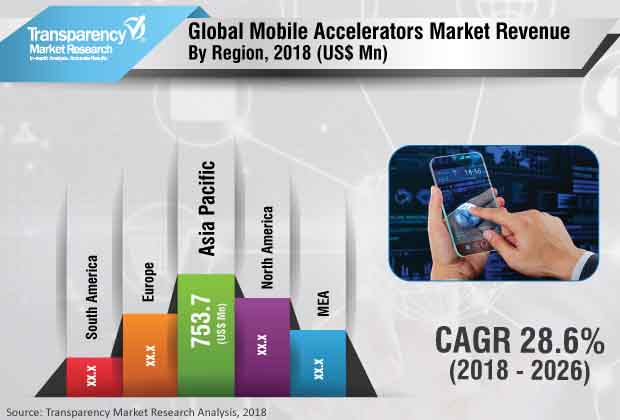
The global mobile accelerator market is anticipated to expand at a CAGR of 28.6% during the forecast period 2018 to 2026 and was valued at US$ 1,672.4 Mn in 2017. In 2017, in terms of app type, gaming accounted for the largest share, in terms of revenue of the global mobile accelerators market. Furthermore, ecommerce app type segment is anticipated to gain major share during the forecast period.
The global market for mobile accelerators has been segmented on the basis of component, app type, end-user, and geographic regions. On the basis of component, the market has been segmented into source optimization, network optimization, and client/device optimization. On the basis of app type, the market is segmented into gaming, business, education, travel, entertainment, banking, health & fitness, e-commerce, social networking, and location based service app. Furthermore, based on end-user, the market is categorized into content providers, service providers, and network infrastructure providers.
In terms of geography, the global mobile accelerators market is bifurcated into North America, Asia Pacific, Europe, South America, and Middle East & Africa. Among these regions, the market for mobile accelerators in Asia Pacific is expected to hold dominant position throughout the forecast period. Asia Pacific region contributes major market share due to the heavy adoption of mobile applications as well as continuous growth in the usage of smartphones among the millennial.
The global mobile accelerator market includes different players such as RapidValue IT Services Private Limited, Flash Networks Ltd., Instart Logic Inc., Cloudflare Inc., ITway Solutions LTD., Equinix, Inc., Limelight Networks Inc., IBM Corporation, Salesforce.com, Inc. and Akamai Technologies, Inc.
1. Preface
1.1. Market Scope
1.2. Market Segmentation
1.3. Key Research Objectives
2. Assumptions and Research Methodology
2.1. Market Taxonomy - Segment Definitions
2.2. Research Methodology
2.2.1. List of Primary and Secondary Sources
2.3. Key Assumptions for Data Modeling
3. Executive Summary: Global Mobile Accelerator Market
4. Market Overview
4.1. Introduction
4.2. Technology/Product Roadmap
4.3. Market Factor Analysis
4.3.1. Porter’s Five Forces Analysis
4.3.2. PESTEL Analysis
4.3.3. Ecosystem Analysis
4.3.4. Market Dynamics (Growth Influencers)
4.3.4.1. Drivers
4.3.4.2. Restraints
4.3.4.3. Opportunities
4.3.4.4. Impact Analysis of Drivers & Restraints
4.4. Adoption Analysis of Mobile Accelerator, By Content Type
4.4.1. Video Content
4.4.2. Gaming Content
4.4.3. Audio Content
4.4.4. Others (Image content, etc.)
4.5. Global Mobile App Spend Analysis
4.5.1. Android Apps
4.5.2. iOS Apps
4.5.3. Windows
4.6. Worldwide Consumer Spending on Mobile Apps, By Region
4.6.1. North America
4.6.2. Europe
4.6.3. Asia Pacific
4.6.4. Middle East & Africa
4.6.5. South America
4.7. Worldwide App Download Analysis
4.7.1. Google Play
4.7.2. iOS App Store
4.8. Global Mobile Accelerator Market Analysis and Forecast, 2016 - 2026
4.8.1. Market Revenue Analysis (US$ Mn)
4.8.1.1. Historic growth trends, 2012-2017
4.8.1.2. Forecast trends, 2017-2026
4.9. Market Attractiveness Analysis – By Region (Global/North America/Europe/Asia Pacific/Middle East & Africa/South America)
4.9.1. By Region/Country
4.9.2. By Component
4.9.3. By App Type
4.9.4. By End-user
4.10. Competitive Scenario and Trends
4.10.1.1. List of New Entrants
4.10.2. Mergers & Acquisitions, Expansions
4.11. Market Outlook
5. Global Mobile Accelerator Market Analysis and Forecast, By Component
5.1. Overview and Definition
5.2. Mobile Accelerator Market Size (US$ Mn) Forecast, By Component, 2016 - 2026
5.2.1. Source Optimization
5.2.2. Network Optimization
5.2.3. Client/Device Optimization
6. Global Mobile Accelerator Market Analysis and Forecast, By App Type
6.1. Overview and Definition
6.2. Mobile Accelerator Market Size (US$ Mn) Forecast, By App Type, 2016 - 2026
6.2.1. Gaming
6.2.2. Business
6.2.3. Education
6.2.4. Travel
6.2.5. Entertainment
6.2.6. Banking
6.2.7. Health & Fitness
6.2.8. E-commerce
6.2.9. Social Networking
6.2.10. Location Based Service Apps
7. Global Mobile Accelerator Market Analysis and Forecast, By End-user
7.1. Overview and Definition
7.2. Mobile Accelerator Market Size (US$ Mn) Forecast, By End-user, 2016 - 2026
7.2.1. Content Providers
7.2.2. Service Providers
7.2.3. Network Infrastructure Providers
8. Global Mobile Accelerator Market Analysis and Forecast, by Region
8.1. Overview
8.2. Emerging Markets/Countries
8.3. Mobile Accelerator Market Size (US$ Mn) Forecast, by Region, 2016 - 2026
8.3.1. North America
8.3.2. Europe
8.3.3. Asia Pacific
8.3.4. Middle East & Africa
8.3.5. South America
8.4. Market Attractiveness by Region
9. North America Mobile Accelerator Market Analysis and Forecast
9.1. Key Findings
9.2. Mobile Accelerator Market Size (US$ Mn) Forecast, By Component, 2016 - 2026
9.2.1. Source Optimization
9.2.2. Network Optimization
9.2.3. Client/Device Optimization
9.3. Mobile Accelerator Market Size (US$ Mn) Forecast, By App Type, 2016 - 2026
9.3.1. Gaming
9.3.2. Business
9.3.3. Education
9.3.4. Travel
9.3.5. Entertainment
9.3.6. Banking
9.3.7. Health & Fitness
9.3.8. E-commerce
9.3.9. Social Networking
9.3.10. Location Based Service Apps
9.4. Mobile Accelerator Market Size (US$ Mn) Forecast, By End-user, 2016 - 2026
9.4.1. Content Providers
9.4.2. Service Providers
9.4.3. Network Infrastructure Providers
9.5. Mobile Accelerator Market Size (US$ Mn) Forecast, By Country and Sub-region, 2016 - 2026
9.5.1. The U.S.
9.5.2. Canada
9.5.3. Rest of North America
10. Europe Mobile Accelerator Market Analysis and Forecast
10.1. Key Findings
10.2. Mobile Accelerator Market Size (US$ Mn) Forecast, By Component, 2016 - 2026
10.2.1. Source Optimization
10.2.2. Network Optimization
10.2.3. Client/Device Optimization
10.3. Mobile Accelerator Market Size (US$ Mn) Forecast, By App Type, 2016 - 2026
10.3.1. Gaming
10.3.2. Business
10.3.3. Education
10.3.4. Travel
10.3.5. Entertainment
10.3.6. Banking
10.3.7. Health & Fitness
10.3.8. E-commerce
10.3.9. Social Networking
10.3.10. Location Based Service Apps
10.4. Mobile Accelerator Market Size (US$ Mn) Forecast, By End-user, 2016 - 2026
10.4.1. Content Providers
10.4.2. Service Providers
10.4.3. Network Infrastructure Providers
10.5. Mobile Accelerator Market Size (US$ Mn) Forecast, By Country and Sub-region, 2016 - 2026
10.5.1. Germany
10.5.2. France
10.5.3. UK
10.5.4. Rest of Europe
11. Asia Pacific Mobile Accelerator Market Analysis and Forecast
11.1. Key Findings
11.2. Mobile Accelerator Market Size (US$ Mn) Forecast, By Component, 2016 - 2026
11.2.1. Source Optimization
11.2.2. Network Optimization
11.2.3. Client/Device Optimization
11.3. Mobile Accelerator Market Size (US$ Mn) Forecast, By App Type, 2016 - 2026
11.3.1. Gaming
11.3.2. Business
11.3.3. Education
11.3.4. Travel
11.3.5. Entertainment
11.3.6. Banking
11.3.7. Health & Fitness
11.3.8. E-commerce
11.3.9. Social Networking
11.3.10. Location Based Service Apps
11.4. Mobile Accelerator Market Size (US$ Mn) Forecast, By End-user, 2016 - 2026
11.4.1. Content Providers
11.4.2. Service Providers
11.4.3. Network Infrastructure Providers
11.5. Mobile Accelerator Market Size (US$ Mn) Forecast, By Country and Sub-region, 2016 - 2026
11.5.1. China
11.5.2. India
11.5.3. Japan
11.5.4. Australia
11.5.5. Rest of Asia Pacific
12. Middle East & Africa (MEA) Mobile Accelerator Market Analysis and Forecast
12.1. Key Findings
12.2. Mobile Accelerator Market Size (US$ Mn) Forecast, By Component, 2016 - 2026
12.2.1. Source Optimization
12.2.2. Network Optimization
12.2.3. Client/Device Optimization
12.3. Mobile Accelerator Market Size (US$ Mn) Forecast, By App Type, 2016 - 2026
12.3.1. Gaming
12.3.2. Business
12.3.3. Education
12.3.4. Travel
12.3.5. Entertainment
12.3.6. Banking
12.3.7. Health & Fitness
12.3.8. E-commerce
12.3.9. Social Networking
12.3.10. Location Based Service Apps
12.4. Mobile Accelerator Market Size (US$ Mn) Forecast, By End-user, 2016 - 2026
12.4.1. Content Providers
12.4.2. Service Providers
12.4.3. Network Infrastructure Providers
12.5. Mobile Accelerator Market Size (US$ Mn) Forecast, By Country and Sub-region, 2016 - 2026
12.5.1. GCC
12.5.2. South Africa
12.5.3. Rest of MEA
13. South America Mobile Accelerator Market Analysis and Forecast
13.1. Key Findings
13.2. Mobile Accelerator Market Size (US$ Mn) Forecast, By Component, 2016 - 2026
13.2.1. Source Optimization
13.2.2. Network Optimization
13.2.3. Client/Device Optimization
13.3. Mobile Accelerator Market Size (US$ Mn) Forecast, By App Type, 2016 - 2026
13.3.1. Gaming
13.3.2. Business
13.3.3. Education
13.3.4. Travel
13.3.5. Entertainment
13.3.6. Banking
13.3.7. Health & Fitness
13.3.8. E-commerce
13.3.9. Social Networking
13.3.10. Location Based Service Apps
13.4. Mobile Accelerator Market Size (US$ Mn) Forecast, By End-user, 2016 - 2026
13.4.1. Content Providers
13.4.2. Service Providers
13.4.3. Network Infrastructure Providers
13.5. Mobile Accelerator Market Size (US$ Mn) Forecast, By Country and Sub-region, 2016 - 2026
13.5.1. Brazil
13.5.2. Rest of South America
14. Competition Landscape
14.1. Market Player – Competition Matrix
14.2. Market Revenue Share Analysis (%), By Company (2017)
15. Company Profiles (Details – Business Overview, Sales Area/Geographical Presence, Revenue, Strategy)
15.1. Akamai Technologies
15.1.1. Business Overview
15.1.2. Geographical Presence
15.1.3. Revenue
15.1.4. Strategy
15.2. SOSV LLC - MOX™
15.2.1. Business Overview
15.2.2. Geographical Presence
15.2.3. Revenue
15.2.4. Strategy
15.3. Salesforce.com Inc.
15.3.1. Business Overview
15.3.2. Geographical Presence
15.3.3. Revenue
15.3.4. Strategy
15.4. Rockstart
15.4.1. Business Overview
15.4.2. Geographical Presence
15.4.3. Revenue
15.4.4. Strategy
15.5. Riverbed Technology
15.5.1. Business Overview
15.5.2. Geographical Presence
15.5.3. Revenue
15.5.4. Strategy
15.6. Cloudfare
15.6.1. Business Overview
15.6.2. Geographical Presence
15.6.3. Revenue
15.6.4. Strategy
15.7. Telefonaktiebolaget LM Ericsson
15.7.1. Business Overview
15.7.2. Geographical Presence
15.7.3. Revenue
15.7.4. Strategy
15.8. InstaReM PTE Limited
15.8.1. Business Overview
15.8.2. Geographical Presence
15.8.3. Revenue
15.8.4. Strategy
15.9. Theapplab
15.9.1. Business Overview
15.9.2. Geographical Presence
15.9.3. Revenue
15.9.4. Strategy
15.10. AT&T, Inc.
15.10.1. Business Overview
15.10.2. Geographical Presence
15.10.3. Revenue
15.10.4. Strategy
16. Key Takeaways
List of Tables
Table 1: List of New Companies & Year of Establishment
Table 2: Major Alliances
Table 3: Global Mobile Accelerator Market Size (US$ Mn) Forecast, by Component, 2016 – 2026
Table 4: Global Mobile Accelerator Market Size (US$ Mn) Forecast, by End-user, 2016 – 2026
Table 5: Global Mobile Accelerator Market Size (US$ Mn) Forecast, by App Type, 2016 – 2026
Table 6: Global Mobile Accelerator Market Size (US$ Mn) Forecast, by Region, 2016 – 2026
Table 7: North America Mobile Accelerator Market Size (US$ Mn) Forecast, by Component, 2016 – 2026
Table 8: North America Mobile Accelerator Market Size (US$ Mn) Forecast, by End-user, 2016 – 2026
Table 9: North America Mobile Accelerator Market Size (US$ Mn) Forecast, by App Type, 2016 – 2026
Table 10: North America Mobile Accelerator Market Size (US$ Mn) Forecast, by Country, 2016 – 2026
Table 11: Europe Mobile Accelerator Market Size (US$ Mn) Forecast, by Component, 2016 – 2026
Table 12: Europe Mobile Accelerator Market Size (US$ Mn) Forecast, by End-user, 2016 – 2026
Table 13: Europe Mobile Accelerator Market Size (US$ Mn) Forecast, by App Type, 2016 – 2026
Table 14: Europe Mobile Accelerator Market Size (US$ Mn) Forecast, by Country, 2016 – 2026
Table 15: Asia Pacific Mobile Accelerator Market Size (US$ Mn) Forecast, by Component, 2016 – 2026
Table 16: Asia Pacific Mobile Accelerator Market Size (US$ Mn) Forecast, by End-user, 2016 – 2026
Table 17: Asia Pacific Mobile Accelerator Market Size (US$ Mn) Forecast, by App Type, 2016 – 2026
Table 18: Asia Pacific Mobile Accelerator Market Size (US$ Mn) Forecast, by Country, 2016 – 2026
Table 19: MEA Mobile Accelerator Market Size (US$ Mn) Forecast, by Component, 2016 – 2026
Table 20: MEA Mobile Accelerator Market Size (US$ Mn) Forecast, by End-user, 2016 – 2026
Table 21: MEA Mobile Accelerator Market Size (US$ Mn) Forecast, by App Type, 2016 – 2026
Table 22: MEA Mobile Accelerator Market Size (US$ Mn) Forecast, by Country, 2016 – 2026
Table 23: South America Mobile Accelerator Market Size (US$ Mn) Forecast, by Component, 2016 – 2026
Table 24: South America Mobile Accelerator Market Size (US$ Mn) Forecast, by End-user, 2016 – 2026
Table 25: South America Mobile Accelerator Market Size (US$ Mn) Forecast, by App Type, 2016 – 2026
Table 26: South America Mobile Accelerator Market Size (US$ Mn) Forecast, by Country, 2016 – 2026
Table 27: Competition Matrix
List of Figures
Figure 1: Global Market Value (US$ Mn)
Figure 2: Global Mobile Accelerator Market, Fastest Growing Region, CAGR (%)
Figure 3: Global Mobile Accelerator Market Size (US$ Mn) Forecast, 2016–2026
Figure 4: Global CAGR Breakdown
Figure 5: Regional Outline
Figure 6: Rebuffering Online Content
Figure 7: Mobile Accelerator, by Content Type
Figure 8: Global Mobile App Spend Analysis, in US$ Billion
Figure 9: Consumer Spending on Mobile Apps (in US$ Billion), by Region
Figure 10: Analysis – Total apps download, by Google Play & iOS App Store
Figure 11: Historic growth trends, 2012-2017 (US$ Mn)
Figure 12: Forecast trends, 2018-2026 (US$ Mn)
Figure 13: Global Mobile Accelerator Market Attractiveness Analysis, by Region
Figure 14: Global Mobile Accelerator Market Attractiveness Analysis, by Component
Figure 15: Global Mobile Accelerator Market Attractiveness Analysis, by End-user
Figure 16: Global Mobile Accelerator Market Attractiveness Analysis, by App Type
Figure 17: Global Mobile Accelerator Market Revenue (US$ Mn) and Y-o-Y Forecast, 2016 – 2026
Figure 18: Global Mobile Accelerator Market Opportunity Growth Analysis (US$ Mn) Forecast, 2016 – 2026
Figure 19: Global Mobile Accelerator Market Share Analysis, by Component (2018)
Figure 20: Global Mobile Accelerator Market Share Analysis, by Component (2026)
Figure 21: Global Mobile Accelerator Market Share Analysis, by End-user (2018)
Figure 22: Global Mobile Accelerator Market Share Analysis, by End-user (2026)
Figure 23: Global Mobile Accelerator Market Share Analysis, by App Type (2018)
Figure 24: Global Mobile Accelerator Market Share Analysis, by App Type (2026)
Figure 25: Global Mobile Accelerator Market Share Analysis, by Region (2018)
Figure 26: Global Mobile Accelerator Market Share Analysis, by Region (2026)
Figure 27: North America Mobile Accelerator Market Share Analysis, by Component (2018)
Figure 28: North America Mobile Accelerator Market Share Analysis, by Component (2026)
Figure 29: North America Mobile Accelerator Market Share Analysis, by End-user (2018)
Figure 30: North America Mobile Accelerator Market Share Analysis, by End-user (2026)
Figure 31: North America Mobile Accelerator Market Share Analysis, by App Type (2018)
Figure 32: North America Mobile Accelerator Market Share Analysis, by App Type (2026)
Figure 33: North America Mobile Accelerator Market Share Analysis, by Country (2018)
Figure 34: North America Mobile Accelerator Market Share Analysis, by Country (2026)
Figure 35: Europe Mobile Accelerator Market Share Analysis, by Component (2018)
Figure 36: Europe Mobile Accelerator Market Share Analysis, by Component (2026)
Figure 37: Europe Mobile Accelerator Market Share Analysis, by End-user (2018)
Figure 38: Europe Mobile Accelerator Market Share Analysis, by End-user (2026)
Figure 39: Europe Mobile Accelerator Market Share Analysis, by App Type (2018)
Figure 40: Europe Mobile Accelerator Market Share Analysis, by App Type (2026)
Figure 41: Europe Mobile Accelerator Market Share Analysis, by Country (2018)
Figure 42: Europe Mobile Accelerator Market Share Analysis, by Country (2026)
Figure 43: Asia Pacific Mobile Accelerator Market Share Analysis, by Component (2018)
Figure 44: Asia Pacific Mobile Accelerator Market Share Analysis, by Component (2026)
Figure 45: Asia Pacific Mobile Accelerator Market Share Analysis, by End-user (2018)
Figure 46: Asia Pacific Mobile Accelerator Market Share Analysis, by End-user (2026)
Figure 47: Asia Pacific Mobile Accelerator Market Share Analysis, by App Type (2018)
Figure 48: Asia Pacific Mobile Accelerator Market Share Analysis, by App Type (2026)
Figure 49: Asia Pacific Mobile Accelerator Market Share Analysis, by Country (2018)
Figure 50: Asia Pacific Mobile Accelerator Market Share Analysis, by Country (2026)
Figure 51: MEA Mobile Accelerator Market Share Analysis, by Component (2018)
Figure 52: MEA Mobile Accelerator Market Share Analysis, by Component (2026)
Figure 53: MEA Mobile Accelerator Market Share Analysis, by End-user (2018)
Figure 54: MEA Mobile Accelerator Market Share Analysis, by End-user (2026)
Figure 55: MEA Mobile Accelerator Market Share Analysis, by App Type (2018)
Figure 56: MEA Mobile Accelerator Market Share Analysis, by App Type (2026)
Figure 57: MEA Mobile Accelerator Market Share Analysis, by Country (2018)
Figure 58: MEA Mobile Accelerator Market Share Analysis, by Country (2026)
Figure 59: South America Mobile Accelerator Market Share Analysis, by Component (2018)
Figure 60: South America Mobile Accelerator Market Share Analysis, by Component (2026)
Figure 61: South America Mobile Accelerator Market Share Analysis, by End-user (2018)
Figure 62: South America Mobile Accelerator Market Share Analysis, by End-user (2026)
Figure 63: South America Mobile Accelerator Market Share Analysis, by App Type (2018)
Figure 64: South America Mobile Accelerator Market Share Analysis, by App Type (2026)
Figure 65: South America Mobile Accelerator Market Share Analysis, by Country (2018)
Figure 66: South America Mobile Accelerator Market Share Analysis, by Country (2026)
Figure 67: Market Revenue Share Analysis (%), by Company
Figure 68: Akamai Technologies Revenue (US$ Mn) & Y-o-Y Growth (%)
Figure 69: Akamai Technologies Breakdown of Net Sales, by Geography, 2017 (%)
Figure 70: Salesforce.com, Inc. Revenue (US$ Mn) & Y-o-Y Growth (%)
Figure 71: Salesforce.com, Inc. Breakdown of Net Sales, by Geography, 2017 (%)
Figure 72: IBM Corporation Revenue (US$ Mn) & Y-o-Y Growth (%)
Figure 73: IBM Corporation Breakdown of Net Sales, by Geography, 2017 (%)
Figure 74: Limelight Networks Inc. Revenue (US$ Mn) & Y-o-Y Growth (%)
Figure 75: Limelight Networks Inc. Breakdown of Net Sales, by Geography, 2017 (%)
Figure 76: Equinix, Inc. Revenue (US$ Mn) & Y-o-Y Growth (%)
Figure 77: Equinix, Inc. Breakdown of Net Sales, by Geography, 2017 (%)
Copyright © Transparency Market Research, Inc. All Rights reserved
Trust Online

Mobile Accelerator Market