
Reports
Reports
Major businesses around the globe are striving to achieve visibility, productivity, and operational efficiency. Moreover, there has been increase in the incorporation of different technological advancements such as cloud-based solutions by companies from different end-use industries such as manufacturing, BFSI, IT and telecom, retail, healthcare, education, retail, and manufacturing industries. As a result, enterprises operating in the global Microsoft Dynamics services market are estimated to gain substantial sales opportunities in the years to come.
Cloud-based solutions are gaining traction among varied businesses owing to their several advantages such as ability to offer business agility, mobility enforcement, and decrease in the operational costs. Such advantages are encouraging for the adoption of these solutions, thereby generating expansion prospects in the Microsoft Dynamics services market. Moreover, companies are supporting their digital projects by increasing the use of Microsoft Dynamics cloud-based solutions in order to back their ongoing cloud technology developments and in order to incorporate them with latest systems.
Automating different manual tasks can help organizations in many aspects such as making precise use of customer data in order to decide their offerings, developing efficient sales strategy, and minimizing manual errors. As there is notable growth in awareness on these advantages, considerable number of enterprises are upgrading their systems and advancing their operational efficiency by incorporation of automation in many tasks.
Expanding adoption of Microsoft Dynamics by organizations in order to simplify varied business operations as well as assist employees to work efficiently is working as a key driver of the global Microsoft Dynamics services market. Moreover, the ability of Microsoft Dynamics to offer advanced communication and collaboration tools in order to assist employees coordinate better within and across departments is boding well with the market expansion.
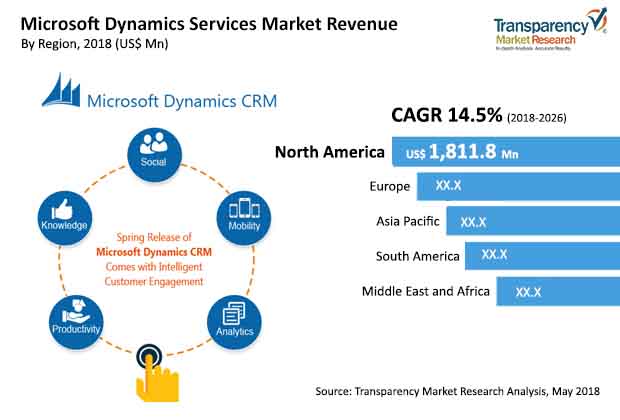
The Microsoft Dynamics market is expected to experience lucrative avenues in North America on the back of many factors such as increasing use of AI and analytics, rising the demand for advanced technologies to minimize operation costs within enterprises, and expanding digital transformation within organizations.
According to a new market report published by Transparency Market Research titled “Microsoft Dynamics Services Market– Global Industry Analysis, Size, Share, Growth, Trends, and Forecast, 2018–2026”,The global Microsoft Dynamics Services market is expected to reach US$ 11,239.5Mn by 2026, expanding at a CAGR of 14.5% from 2018 to 2026. North America held a prominentshare of the Microsoft Dynamics Services market in 2016. Asia Pacific is projected to be at the forefront of global demand, and the market in the region is expected to expand at a significant CAGR among all regions.
Rising adoption of cloud-based solutions and need for increasing operational efficiency, visibility, and productivity are acting as major drivers for the Microsoft Dynamics services market. Increasing demand among enterprises for reduction in operational costs, increase in business agility, and enforcement of mobility is playing an important role in the expansion of the cloud-based solutions globally.Enterprises are looking for Microsoft Dynamics cloud-based solutions to support ongoing cloud technology developments and integrate them with new systems to support digital projects.Furthermore, businesses across the globe are experiencing the benefits of automating manual tasks in order to reduce manual errors, utilize customer data for deciding what to offer, and driving efficient sales strategy.Businesses need to upgrade their systems and boost the operational efficiency in order to remain competitive.Organizations are implementing Microsoft Dynamics to streamline business operations and help employees work more efficiently. Microsoft Dynamics provides efficient communication and collaboration tools to help employees coordinate better within and across departments.
The Microsoft Dynamics services market can be segmented based ondeployment type, product type, service type, end-user, and geography. Based ondeployment type,the Microsoft Dynamics services market has been further segmented into on-premiseand cloud-based. The on-premise segment held a prominent shareof the market in 2016. However,various organizations are looking for cloud based solutions especially from small and medium businessesowing to the rise in the number of mobile devices, cloud-based and IoT applications. Furthermore, a shift in preference of enterprise application buyers from traditional systems toward the cloud-first approach is expected to further boost the Microsoft Dynamics services market. Less maintenance and low costs associated with cloud-based Microsoft Dynamics services solutions aredriving the segment globally.
Based onproduct type,the Microsoft Dynamics services market has been divided into ERP and CRM. The CRM segment is expected to expand at asignificant CAGR during the forecast period.Based on service type,the Microsoft Dynamics Services market has been divided into advisory/consulting services, implementation, upgradation and migration and maintenance and support services. In terms of end-user, the Microsoft Dynamics Servicesmarket has been divided into BFSI, manufacturing, retail, telecom & IT, government, utilities, healthcare, and others.
Based on geography,the Microsoft Dynamics Servicesmarket has been divided into North America, South America, Europe, Asia Pacific, and Middle East & Africa. North America is expected to hold a prominent share, and account formore than 40%of the global market in 2026, followed by Europe. Expansion of the Microsoft Dynamics services market in North America is owing to the increasing digital transformation within enterprises, rising adoption of AI and analytics and the high demand for latest technologies to reduce operation costs within enterprises. Furthermore,the market in Asia Pacific is expected to expand at a high CAGR ofmore than 14%during the forecast period, followed by South America. India, China, and Japan are among the major countriesthat held a dominant sharein the Microsoft Dynamics services market inAsia Pacific. Moreover, as a part of the strategy, severalservice providers are investing intools development specific to a particular industry and are focused on mergers and acquisitions in order to increase geographical reach in the global Microsoft Dynamics services market.
Major players operating in the global Microsoft Dynamics services market include Tata Consultancy Services Limited, IBM Corporation, Capgemini SE, DXC Technology Company, Cognizant Technology Solutions Corporation, HCL Technologies Limited, Hitachi Solutions, Ltd., Infosys Limited, Wipro Limited, and Avanade Inc.
Rising selection of cloud-based arrangements and need for expanding operational proficiency, perceivability, and efficiency are going about as significant drivers for the Microsoft Dynamics services market. Expanding request among ventures for decrease in operational expenses, expansion in business nimbleness, and authorization of versatility is assuming a significant part in the extension of the cloud-based arrangements globally. Enterprises are searching for Microsoft Dynamics cloud-based answers for help progressing cloud innovation improvements and incorporate them with new frameworks to help computerized projects. Besides this, organizations across the globe are encountering the advantages of robotizing manual undertakings to diminish manual mistakes, use client information for choosing what to offer, and driving productive deals strategy.
Businesses need to redesign their frameworks and lift the operational effectiveness to stay cutthroat. Associations are executing Microsoft Dynamics to smooth out business tasks and help representatives work all the more effectively. Microsoft Dynamics gives proficient correspondence and cooperation apparatuses to help workers organize better inside and across offices. Nowadays various ventures attempt to digitize significant work across their worth chain. This specific factor has ended up being the shelter for the market development, as these days, client request more control on their collaborations with organizations and business. Also, tough guidelines, rising pressing factor from clients, and consistence among organizations is decidedly affecting the computerized change.
Old advances are being taken over by the new innovations, or the new ones are more redesigned, as the IT keeps on developing additional time. Advanced change is helping associations all over the world to check on manual mistakes. This assists an association with using the information of the clients, blunder free. Different associations are utilizing Microsoft Dynamics arrangements to collaborate with the clients in regards to past exchanges, items. Microsoft Dynamics additionally helps in business tasks by utilizing continuous information, along these lines helping in deciding.
Microsoft Dynamics Services Market is expected to rise to US$ 11,239.5Mn by 2026
Microsoft Dynamics Services Market to expand at a CAGR of 14.5% during the forecast period 2026
Expanding adoption of Microsoft Dynamics by organizations in order to simplify varied business operations as well as assist employees to work efficiently is working as a key driver of the global Microsoft Dynamics services market.
North America is estimated to show prominent growth in the Microsoft Dynamics Services Market
Major players operating in the global Microsoft Dynamics services market include Tata Consultancy Services Limited, IBM Corporation, Capgemini SE, DXC Technology Company, Cognizant Technology Solutions Corporation, HCL Technologies Limited, Hitachi Solutions, Ltd., Infosys Limited, Wipro Limited, and Avanade Inc.
1.Preface
1.1.Report Scope and Segmentation
1.2.Key Research Objectives and Highlights
2.Assumptions and Research Methodology
3.Executive Summary : Microsoft Dynamics Services Market
4.Overview
4.1.Introduction
4.1.1. Definition
4.1.2. Evolution of Microsoft Dynamics
4.2.Market Dynamics
4.2.1. Drivers
4.2.2. Restraints
4.2.3. Opportunity
4.3.Key Trends
4.4.Global Microsoft Dynamics Services Market Analysis and Forecasts, 2016 – 2026
4.4.1. Market Revenue Projections (US$ Mn)
4.5.Market Outlook
5.Global Microsoft Dynamics Services Market Analysis and Forecast by Deployment Type
5.1.Introduction & Definition
5.2.Key Findings / Developments
5.3.Microsoft Dynamics Services Market Size (US$ Mn) and Forecast by Deployment Type, 2016 – 2026
5.3.1. On-premise
5.3.2. Cloud based
5.4.Deployment Type Comparison Matrix
5.5.Market Attractiveness by Deployment Type
6.Global Microsoft Dynamics Services Market Analysis and Forecast by Product Type
6.1.Introduction & Definition
6.2.Key Findings / Developments
6.3.Microsoft Dynamics Services Market Size (US$ Mn) and Forecast by Product Type, 2016 – 2026
6.3.1. ERP
6.3.2. CRM
6.4.Product Type Comparison Matrix
6.5.Market Attractiveness by Product Type
7.Global Microsoft Dynamics Services Market Analysis and Forecast by Service Type
7.1.Introduction & Definition
7.2.Key Findings / Developments
7.3.Microsoft Dynamics Services Market Size (US$ Mn) and Forecast by Service Type, 2016 – 2026
7.3.1. Advisory/Consulting Services
7.3.2. Implementation
7.3.3. Upgradation and Migration Services
7.3.4. Maintenance and Support Services
7.4.Service Type Comparison Matrix
7.5.Market Attractiveness by Service Type
8.Global Microsoft Dynamics Services Market Analysis and Forecast by End-Use Industry
8.1.Introduction
8.2.Key Findings / Developments
8.3.Microsoft Dynamics Services Market Size (US$ Mn) and Forecast by End-Use Industry, 2016 – 2026
8.3.1. BFSI
8.3.2. Manufacturing
8.3.3. Retail
8.3.4. Telecom and IT
8.3.5. Government
8.3.6. Utilities
8.3.7. Healthcare
8.3.8. Others
8.4.End-Use Industry Comparison Matrix
8.5.Market Attractiveness by End-Use Industry
9.Global Microsoft Dynamics Services Market Analysis and Forecasts, by Region
9.1.Key Findings
9.2.Microsoft Dynamics Services Market Size (US$ Mn) Forecast by Region, 2016 – 2026
9.2.1. North America
9.2.2. Europe
9.2.3. Asia Pacific
9.2.4. Middle East and Africa
9.2.5. South America
9.3.Market Attractiveness by Region
10.North America Microsoft Dynamics Services Market Size and Forecast
10.1.Key Findings
10.2.Microsoft Dynamics Services Market Size (US$ Mn) and Forecast by Deployment Type, 2016 – 2026
10.2.1. On-premise
10.2.2. Cloud based
10.3.Microsoft Dynamics Services Market Size (US$ Mn) and Forecast by Product Type, 2016 – 2026
10.3.1. ERP
10.3.2. CRM
10.4.Microsoft Dynamics Services Market Size (US$ Mn) and Forecast by Service Type, 2016 – 2026
10.4.1. Advisory/Consulting Services
10.4.2. Implementation
10.4.3. Upgradation and Migration Services
10.4.4. Maintenance and Support Services
10.5.Microsoft Dynamics Services Market Size (US$ Mn) and Forecast by End-Use Industry, 2016 – 2026
10.5.1. BFSI
10.5.2. Manufacturing
10.5.3. Retail
10.5.4. Telecom and IT
10.5.5. Government
10.5.6. Utilities
10.5.7. Healthcare
10.5.8. Others
10.6.Microsoft Dynamics Services Market Size (US$ Mn) and Forecast by Country, 2016 – 2026
10.6.1. The U.S.
10.6.1.1.Microsoft Dynamics Services Market Size (US$ Mn) and Forecast by Deployment Type, 2016 – 2026
10.6.1.1.1.On-premise
10.6.1.1.2.Cloud based
10.6.1.2.Microsoft Dynamics Services Market Size (US$ Mn) and Forecast by Product Type, 2016 – 2026
10.6.1.2.1.ERP
10.6.1.2.2.CRM
10.6.1.3.Microsoft Dynamics Services Market Size (US$ Mn) and Forecast by Service Type, 2016 – 2026
10.6.1.3.1.Advisory/Consulting Services
10.6.1.3.2.Implementation
10.6.1.3.3.Upgradation and Migration Services
10.6.1.3.4.Maintenance and Support Services
10.6.1.4.Microsoft Dynamics Services Market Size (US$ Mn) and Forecast by End-Use Industry, 2016 – 2026
10.6.1.4.1.BFSI
10.6.1.4.2.Manufacturing
10.6.1.4.3.Retail
10.6.1.4.4.Telecom and IT
10.6.1.4.5.Government
10.6.1.4.6.Utilities
10.6.1.4.7.Healthcare
10.6.1.4.8.Others
10.6.2. Canada
10.6.2.1.Microsoft Dynamics Services Market Size (US$ Mn) and Forecast by Deployment Type, 2016 – 2026
10.6.2.1.1.On-premise
10.6.2.1.2.Cloud based
10.6.2.2.Microsoft Dynamics Services Market Size (US$ Mn) and Forecast by Product Type, 2016 – 2026
10.6.2.2.1.ERP
10.6.2.2.2.CRM
10.6.2.3.Microsoft Dynamics Services Market Size (US$ Mn) and Forecast by Service Type, 2016 – 2026
10.6.2.3.1.Advisory/Consulting Services
10.6.2.3.2.Implementation
10.6.2.3.3.Upgradation and Migration Services
10.6.2.3.4.Maintenance and Support Services
10.6.2.4.Microsoft Dynamics Services Market Size (US$ Mn) and Forecast by End-Use Industry, 2016 – 2026
10.6.2.4.1.BFSI
10.6.2.4.2.Manufacturing
10.6.2.4.3.Retail
10.6.2.4.4.Telecom and IT
10.6.2.4.5.Government
10.6.2.4.6.Utilities
10.6.2.4.7.Healthcare
10.6.2.4.8.Others
10.6.3. Rest of North America
10.7.Microsoft Dynamics Services Market Attractiveness Analysis
10.7.1. By Deployment Type
10.7.2. By Product Type
10.7.3. By Service Type
10.7.4. By End-Use Industry
10.7.5. By Country
11.Europe Microsoft Dynamics Services Market Size and Forecast
11.1.Key Findings
11.2.Microsoft Dynamics Services Market Size (US$ Mn) and Forecast by Deployment Type, 2016 – 2026
11.2.1. On-premise
11.2.2. Cloud based
11.3.Microsoft Dynamics Services Market Size (US$ Mn) and Forecast by Product Type, 2016 – 2026
11.3.1. ERP
11.3.2. CRM
11.4.Microsoft Dynamics Services Market Size (US$ Mn) and Forecast by Service Type, 2016 – 2026
11.4.1. Advisory/Consulting Services
11.4.2. Implementation
11.4.3. Upgradation and Migration Services
11.4.4. Maintenance and Support Services
11.5.Microsoft Dynamics Services Market Size (US$ Mn) and Forecast by End-Use Industry, 2016 – 2026
11.5.1. BFSI
11.5.2. Manufacturing
11.5.3. Retail
11.5.4. Telecom and IT
11.5.5. Government
11.5.6. Utilities
11.5.7. Healthcare
11.5.8. Others
11.6.Microsoft Dynamics Services Market Size (US$ Mn ) and Forecast by Country, 2016 – 2026
11.6.1.The U.K.
11.6.1.1.Microsoft Dynamics Services Market Size (US$ Mn) and Forecast by Deployment Type, 2016 – 2026
11.6.1.1.1.On-premise
11.6.1.1.2.Cloud based
11.6.1.2.Microsoft Dynamics Services Market Size (US$ Mn) and Forecast by Product Type, 2016 – 2026
11.6.1.2.1.ERP
11.6.1.2.2.CRM
11.6.1.3.Microsoft Dynamics Services Market Size (US$ Mn) and Forecast by Service Type, 2016 – 2026
11.6.1.3.1.Advisory/Consulting Services
11.6.1.3.2.Implementation
11.6.1.3.3.Upgradation and Migration Services
11.6.1.3.4.Maintenance and Support Services
11.6.1.4.Microsoft Dynamics Services Market Size (US$ Mn) and Forecast by End-Use Industry, 2016 – 2026
11.6.1.4.1.BFSI
11.6.1.4.2.Manufacturing
11.6.1.4.3.Retail
11.6.1.4.4.Telecom and IT
11.6.1.4.5.Government
11.6.1.4.6.Utilities
11.6.1.4.7.Healthcare
11.6.1.4.8.Others
11.6.2.Germany
11.6.2.1.Microsoft Dynamics Services Market Size (US$ Mn) and Forecast by Deployment Type, 2016 – 2026
11.6.2.1.1.On-premise
11.6.2.1.2.Cloud based
11.6.2.2.Microsoft Dynamics Services Market Size (US$ Mn) and Forecast by Product Type, 2016 – 2026
11.6.2.2.1.ERP
11.6.2.2.2.CRM
11.6.2.3.Microsoft Dynamics Services Market Size (US$ Mn) and Forecast by Service Type, 2016 – 2026
11.6.2.3.1.Advisory/Consulting Services
11.6.2.3.2.Implementation
11.6.2.3.3.Upgradation and Migration Services
11.6.2.3.4.Maintenance and Support Services
11.6.2.4.Microsoft Dynamics Services Market Size (US$ Mn) and Forecast by End-Use Industry, 2016 – 2026
11.6.2.4.1.BFSI
11.6.2.4.2.Manufacturing
11.6.2.4.3.Retail
11.6.2.4.4.Telecom and IT
11.6.2.4.5.Government
11.6.2.4.6.Utilities
11.6.2.4.7.Healthcare
11.6.2.4.8.Others
11.6.3.France
11.6.3.1.Microsoft Dynamics Services Market Size (US$ Mn) and Forecast by Deployment Type, 2016 – 2026
11.6.3.1.1.On-premise
11.6.3.1.2.Cloud based
11.6.3.2.Microsoft Dynamics Services Market Size (US$ Mn) and Forecast by Product Type, 2016 – 2026
11.6.3.2.1.ERP
11.6.3.2.2.CRM
11.6.3.3.Microsoft Dynamics Services Market Size (US$ Mn) and Forecast by Service Type, 2016 – 2026
11.6.3.3.1.Advisory/Consulting Services
11.6.3.3.2.Implementation
11.6.3.3.3.Upgradation and Migration Services
11.6.3.3.4.Maintenance and Support Services
11.6.3.4.Microsoft Dynamics Services Market Size (US$ Mn) and Forecast by End-Use Industry, 2016 – 2026
11.6.3.4.1.BFSI
11.6.3.4.2.Manufacturing
11.6.3.4.3.Retail
11.6.3.4.4.Telecom and IT
11.6.3.4.5.Government
11.6.3.4.6.Utilities
11.6.3.4.7.Healthcare
11.6.3.4.8.Others
11.6.4.Rest of Europe`
11.7.Microsoft Dynamics Services Market Attractiveness Analysis
11.7.1. By Deployment Type
11.7.2. By Product Type
11.7.3. By Service Type
11.7.4. By End-Use Industry
11.7.5. By Country
12.Asia Pacific Microsoft Dynamics Services Market Size and Forecast
12.1.Key Findings
12.2.Microsoft Dynamics Services Market Size (US$ Mn) and Forecast by Deployment Type, 2016 – 2026
12.2.1. On-premise
12.2.2. Cloud based
12.3.Microsoft Dynamics Services Market Size (US$ Mn) and Forecast by Product Type, 2016 – 2026
12.3.1. ERP
12.3.2. CRM
12.4.Microsoft Dynamics Services Market Size (US$ Mn) and Forecast by Service Type, 2016 – 2026
12.4.1. Advisory/Consulting Services
12.4.2. Implementation
12.4.3. Upgradation and Migration Services
12.4.4. Maintenance and Support Services
12.5.Microsoft Dynamics Services Market Size (US$ Mn) and Forecast by End-Use Industry, 2016 – 2026
12.5.1. BFSI
12.5.2. Manufacturing
12.5.3. Retail
12.5.4. Telecom and IT
12.5.5. Government
12.5.6. Utilities
12.5.7. Healthcare
12.5.8. Others
12.6.Microsoft Dynamics Services Market Size (US$ Mn ) and Forecast by Country, 2016 – 2026
12.6.1. India
12.6.1.1.Microsoft Dynamics Services Market Size (US$ Mn) and Forecast by Deployment Type, 2016 – 2026
12.6.1.1.1.On-premise
12.6.1.1.2.Cloud based
12.6.1.2.Microsoft Dynamics Services Market Size (US$ Mn) and Forecast by Product Type, 2016 – 2026
12.6.1.2.1.ERP
12.6.1.2.2.CRM
12.6.1.3.Microsoft Dynamics Services Market Size (US$ Mn) and Forecast by Service Type, 2016 – 2026
12.6.1.3.1.Advisory/Consulting Services
12.6.1.3.2.Implementation
12.6.1.3.3.Upgradation and Migration Services
12.6.1.3.4.Maintenance and Support Services
12.6.1.4.Microsoft Dynamics Services Market Size (US$ Mn) and Forecast by End-Use Industry, 2016 – 2026
12.6.1.4.1.BFSI
12.6.1.4.2.Manufacturing
12.6.1.4.3.Retail
12.6.1.4.4.Telecom and IT
12.6.1.4.5.Government
12.6.1.4.6.Utilities
12.6.1.4.7.Healthcare
12.6.1.4.8.Others
12.6.2. China
12.6.2.1.Microsoft Dynamics Services Market Size (US$ Mn) and Forecast by Deployment Type, 2016 – 2026
12.6.2.1.1.On-premise
12.6.2.1.2.Cloud based
12.6.2.2.Microsoft Dynamics Services Market Size (US$ Mn) and Forecast by Product Type, 2016 – 2026
12.6.2.2.1.ERP
12.6.2.2.2.CRM
12.6.2.3.Microsoft Dynamics Services Market Size (US$ Mn) and Forecast by Service Type, 2016 – 2026
12.6.2.3.1.Advisory/Consulting Services
12.6.2.3.2.Implementation
12.6.2.3.3.Upgradation and Migration Services
12.6.2.3.4.Maintenance and Support Services
12.6.2.4.Microsoft Dynamics Services Market Size (US$ Mn) and Forecast by End-Use Industry, 2016 – 2026
12.6.2.4.1.BFSI
12.6.2.4.2.Manufacturing
12.6.2.4.3.Retail
12.6.2.4.4.Telecom and IT
12.6.2.4.5.Government
12.6.2.4.6.Utilities
12.6.2.4.7.Healthcare
12.6.2.4.8.Others
12.6.3. Japan
12.6.3.1.Microsoft Dynamics Services Market Size (US$ Mn) and Forecast by Deployment Type, 2016 – 2026
12.6.3.1.1.On-premise
12.6.3.1.2.Cloud based
12.6.3.2.Microsoft Dynamics Services Market Size (US$ Mn) and Forecast by Product Type, 2016 – 2026
12.6.3.2.1.ERP
12.6.3.2.2.CRM
12.6.3.3.Microsoft Dynamics Services Market Size (US$ Mn) and Forecast by Service Type, 2016 – 2026
12.6.3.3.1.Advisory/Consulting Services
12.6.3.3.2.Implementation
12.6.3.3.3.Upgradation and Migration Services
12.6.3.3.4.Maintenance and Support Services
12.6.3.4.Microsoft Dynamics Services Market Size (US$ Mn) and Forecast by End-Use Industry, 2016 – 2026
12.6.3.4.1.BFSI
12.6.3.4.2.Manufacturing
12.6.3.4.3.Retail
12.6.3.4.4.Telecom and IT
12.6.3.4.5.Government
12.6.3.4.6.Utilities
12.6.3.4.7.Healthcare
12.6.3.4.8.Others
12.6.4. Rest of Asia Pacific
12.7.Microsoft Dynamics Services Market Attractiveness Analysis
12.7.1. By Deployment Type
12.7.2. By Product Type
12.7.3. By Service Type
12.7.4. By End-Use Industry
12.7.5. By Country
13.Middle East and Africa (MEA) Microsoft Dynamics Services Market Size and Forecast
13.1.Key Findings
13.2.Microsoft Dynamics Services Market Size (US$ Mn) and Forecast by Deployment Type, 2016 – 2026
13.2.1. On-premise
13.2.2. Cloud based
13.3.Microsoft Dynamics Services Market Size (US$ Mn) and Forecast by Product Type, 2016 – 2026
13.3.1. ERP
13.3.2. CRM
13.4.Microsoft Dynamics Services Market Size (US$ Mn) and Forecast by Service Type, 2016 – 2026
13.4.1. Advisory/Consulting Services
13.4.2. Implementation
13.4.3. Upgradation and Migration Services
13.4.4. Maintenance and Support Services
13.5.Microsoft Dynamics Services Market Size (US$ Mn) and Forecast by End-Use Industry, 2016 – 2026
13.5.1. BFSI
13.5.2. Manufacturing
13.5.3. Retail
13.5.4. Telecom and IT
13.5.5. Government
13.5.6. Utilities
13.5.7. Healthcare
13.5.8. Others
13.6.Microsoft Dynamics Services Market Size (US$ Mn ) and Forecast by Country, 2016 – 2026
13.6.1. GCC Countries
13.6.1.1.Microsoft Dynamics Services Market Size (US$ Mn) and Forecast by Deployment Type, 2016 – 2026
13.6.1.1.1.On-premise
13.6.1.1.2.Cloud based
13.6.1.2.Microsoft Dynamics Services Market Size (US$ Mn) and Forecast by Product Type, 2016 – 2026
13.6.1.2.1.ERP
13.6.1.2.2.CRM
13.6.1.3.Microsoft Dynamics Services Market Size (US$ Mn) and Forecast by Service Type, 2016 – 2026
13.6.1.3.1.Advisory/Consulting Services
13.6.1.3.2.Implementation
13.6.1.3.3.Upgradation and Migration Services
13.6.1.3.4.Maintenance and Support Services
13.6.1.4.Microsoft Dynamics Services Market Size (US$ Mn) and Forecast by End-Use Industry, 2016 – 2026
13.6.1.4.1.BFSI
13.6.1.4.2.Manufacturing
13.6.1.4.3.Retail
13.6.1.4.4.Telecom and IT
13.6.1.4.5.Government
13.6.1.4.6.Utilities
13.6.1.4.7.Healthcare
13.6.1.4.8.Others
13.6.2. South Africa
13.6.2.1.Microsoft Dynamics Services Market Size (US$ Mn) and Forecast by Deployment Type, 2016 – 2026
13.6.2.1.1.On-premise
13.6.2.1.2.Cloud based
13.6.2.2.Microsoft Dynamics Services Market Size (US$ Mn) and Forecast by Product Type, 2016 – 2026
13.6.2.2.1.ERP
13.6.2.2.2.CRM
13.6.2.3.Microsoft Dynamics Services Market Size (US$ Mn) and Forecast by Service Type, 2016 – 2026
13.6.2.3.1.Advisory/Consulting Services
13.6.2.3.2.Implementation
13.6.2.3.3.Upgradation and Migration Services
13.6.2.3.4.Maintenance and Support Services
13.6.2.4.Microsoft Dynamics Services Market Size (US$ Mn) and Forecast by End-Use Industry, 2016 – 2026
13.6.2.4.1.BFSI
13.6.2.4.2.Manufacturing
13.6.2.4.3.Retail
13.6.2.4.4.Telecom and IT
13.6.2.4.5.Government
13.6.2.4.6.Utilities
13.6.2.4.7.Healthcare
13.6.2.4.8.Others
13.6.3. Rest of Middle East & Africa
13.7.Microsoft Dynamics Services Market Attractiveness Analysis
13.7.1. By Deployment Type
13.7.2. By Product Type
13.7.3. By Service Type
13.7.4. By End-Use Industry
13.7.5. By Country
14.South America Microsoft Dynamics Services Market Size and Forecast
14.1.Key Findings
14.2.Microsoft Dynamics Services Market Size (US$ Mn) and Forecast by Deployment Type, 2016 – 2026
14.2.1. On-premise
14.2.2. Cloud based
14.3.Microsoft Dynamics Services Market Size (US$ Mn) and Forecast by Product Type, 2016 – 2026
14.3.1. ERP
14.3.2. CRM
14.4.Microsoft Dynamics Services Market Size (US$ Mn) and Forecast by Service Type, 2016 – 2026
14.4.1. Advisory/Consulting Services
14.4.2. Implementation
14.4.3. Upgradation and Migration Services
14.4.4. Maintenance and Support Services
14.5.Microsoft Dynamics Services Market Size (US$ Mn) and Forecast by End-Use Industry, 2016 – 2026
14.5.1. BFSI
14.5.2. Manufacturing
14.5.3. Retail
14.5.4. Telecom and IT
14.5.5. Government
14.5.6. Utilities
14.5.7. Healthcare
14.5.8. Others
14.6.Microsoft Dynamics Services Market Size (US$ Mn ) and Forecast by Country, 2016 – 2026
14.6.1. Brazil
14.6.1.1.Microsoft Dynamics Services Market Size (US$ Mn) and Forecast by Deployment Type, 2016 – 2026
14.6.1.1.1.On-premise
14.6.1.1.2.Cloud based
14.6.1.2.Microsoft Dynamics Services Market Size (US$ Mn) and Forecast by Product Type, 2016 – 2026
14.6.1.2.1.ERP
14.6.1.2.2.CRM
14.6.1.3.Microsoft Dynamics Services Market Size (US$ Mn) and Forecast by Service Type, 2016 – 2026
14.6.1.3.1.Advisory/Consulting Services
14.6.1.3.2.Implementation
14.6.1.3.3.Upgradation and Migration Services
14.6.1.3.4.Maintenance and Support Services
14.6.1.4.Microsoft Dynamics Services Market Size (US$ Mn) and Forecast by End-Use Industry, 2016 – 2026
14.6.1.4.1.BFSI
14.6.1.4.2.Manufacturing
14.6.1.4.3.Retail
14.6.1.4.4.Telecom and IT
14.6.1.4.5.Government
14.6.1.4.6.Utilities
14.6.1.4.7.Healthcare
14.6.1.4.8.Others
14.6.2. Rest of South America
14.7.Microsoft Dynamics Services Market Attractiveness Analysis
14.7.1. By Deployment Type
14.7.2. By Product Type
14.7.3. By Service Type
14.7.4. By End-Use Industry
14.7.5. By Country
15.Competition Landscape
15.1.Market Player – Competition Matrix
15.2.Global Microsoft Dynamics Services Market Share Analysis, By Company
15.3.Company Profiles (Details – Overview, Financials, Strategy, SWOT analysis)
15.3.1. Tata Consultancy Services Limited
15.3.1.1.Company details
15.3.1.2.Company description
15.3.1.3.Business Overview
15.3.1.4.SWOT analysis
15.3.1.5.Financials
15.3.1.6.Strategic overview
15.3.2. IBM Corporation
15.3.2.1.Company details
15.3.2.2.Company description
15.3.2.3.Business Overview
15.3.2.4.SWOT analysis
15.3.2.5.Financials
15.3.2.6.Strategic overview
15.3.3. Capgemini SE
15.3.3.1.Company details
15.3.3.2.Company description
15.3.3.3.Business Overview
15.3.3.4.SWOT analysis
15.3.3.5.Financials
15.3.3.6.Strategic overview
15.3.4. DXC Technology Company
15.3.4.1.Company details
15.3.4.2.Company description
15.3.4.3.Business Overview
15.3.4.4.SWOT analysis
15.3.4.5.Financials
15.3.4.6.Strategic overview
15.3.5. Cognizant Technology Solutions Corporation
15.3.5.1.Company details
15.3.5.2.Company description
15.3.5.3.Business Overview
15.3.5.4.SWOT analysis
15.3.5.5.Financials
15.3.5.6.Strategic overview
15.3.6. HCL Technologies Limited
15.3.6.1.Company details
15.3.6.2.Company description
15.3.6.3.Business Overview
15.3.6.4.SWOT analysis
15.3.6.5.Financials
15.3.6.6.Strategic overview
15.3.7. Hitachi Solutions, Ltd.
15.3.7.1.Company details
15.3.7.2.Company description
15.3.7.3.Business Overview
15.3.7.4.SWOT analysis
15.3.7.5.Financials
15.3.7.6.Strategic overview
15.3.8. Infosys Limited
15.3.8.1.Company details
15.3.8.2.Company description
15.3.8.3.Business Overview
15.3.8.4.SWOT analysis
15.3.8.5.Financials
15.3.8.6.Strategic overview
15.3.9. Wipro Limited
15.3.9.1.Company details
15.3.9.2.Company description
15.3.9.3.Business Overview
15.3.9.4.SWOT analysis
15.3.9.5.Financials
15.3.9.6.Strategic overview
15.3.10. Avanade Inc.
15.3.10.1.Company details
15.3.10.2.Company description
15.3.10.3.Business Overview
15.3.10.4.SWOT analysis
15.3.10.5.Strategic overview
16. Key Takeaways
List of Figures
Figure 1: Microsoft Dynamics Services, Share Analysis
Figure 2: Global Microsoft Dynamics Services Market, Revenue 2016 – 2026 (US$)
Figure 3: Microsoft Dynamics Services Market Value Share (US$ Mn) By Deployment Type (2018)
Figure 4: Microsoft Dynamics Services Market Revenue Share By (US$ Mn) Product Type (2018)
Figure 5: Microsoft Dynamics Services Market Value Share (US$ Mn) By Service Type (2018)
Figure 6: Microsoft Dynamics Services Market Revenue Share (US$ Mn) By End Use Industry (2018)
Figure 7: Microsoft Dynamics Services Market Revenue Share (US$ Mn) By Country (2018)
Figure 8: Global Microsoft Dynamics Services Market Value Share Analysis, By Deployment Type, 2018 and 2026
Figure 9: Global Microsoft Dynamics Services Market, Deployment Type Comparison Matrix
Figure 10: Global Microsoft Dynamics Services Market, Attractiveness Analysis, By Deployment Type (2018)
Figure 11: Global Microsoft Dynamics Services Market Value Share Analysis, By Product Type, 2018 and 2026
Figure 12: Global Microsoft Dynamics Services Market Comparison Matrix, By Product Type
Figure 13: Global Microsoft Dynamics Services Market, Attractiveness Analysis, By Product Type
Figure 14: Global Microsoft Dynamics Services Market Value Share Analysis, By Service Type, 2018 and 2026
Figure 15: Global Microsoft Dynamics Services Market Comparison Matrix, By Service Type
Figure 16: Global Microsoft Dynamics Services Market, Attractiveness Analysis, By Service Type
Figure 17: Global Microsoft Dynamics Services Market Value Share Analysis, By End Use Industry, 2018 and 2026
Figure 18: Global Microsoft Dynamics Services Market Comparison Matrix, By End-Use Industry
Figure 19: Global Microsoft Dynamics Services Market, Attractiveness Analysis, By End-Use Industry
Figure 20: Global Microsoft Dynamics Services Market Value Share Analysis, By Region, 2018 and 2026
Figure 21: Global Microsoft Dynamics Services Market, Attractiveness Analysis, By Region
Figure 22: North America Microsoft Dynamics Services Market Revenue Share Analysis, by Deployment Type, 2018 and 2026
Figure 23: North America Microsoft Dynamics Services Market Revenue Share Analysis, by Product Type, 2018 and 2026
Figure 24: North America Microsoft Dynamics Services Market Value Share Analysis, By Service Type, 2018 and 2026
Figure 25: North America Microsoft Dynamics Services Market Value Share Analysis, By End Use Industry, 2018 and 2026
Figure 26: North America Microsoft Dynamics Services Revenue Share Analysis, By Country, 2018 and 2026
Figure 27: The U.S. Microsoft Dynamics Services Market Revenue Share Analysis, By Deployment Type, 2018 and 2026
Figure 28: The U.S. Microsoft Dynamics Services Market Revenue Share Analysis, By Product Type, 2018 and 2026
Figure 29: The U.S. Microsoft Dynamics Services Market Value Share Analysis, By Service Type, 2018 and 2026
Figure 30: The U.S. Microsoft Dynamics Services Market Value Share Analysis, By End Use Industry, 2018 and 2026
Figure 31: Canada Microsoft Dynamics Services Market Revenue Share Analysis, By Deployment Type, 2018 and 2026
Figure 32: Canada Microsoft Dynamics Services Market Revenue Share Analysis, By Product Type, 2018 and 2026
Figure 33: Canada Microsoft Dynamics Services Market Value Share Analysis, By Service Type, 2018 and 2026
Figure 34: Canada Microsoft Dynamics Services Market Value Share Analysis, By End Use Industry, 2018 and 2026
Figure 35: Microsoft Dynamics Services Market, Attractiveness Analysis, By Deployment
Figure 36: Microsoft Dynamics Services Market, Attractiveness Analysis, By Product Type
Figure 37: Microsoft Dynamics Services Market, Attractiveness Analysis, By Service Type
Figure 38: Microsoft Dynamics Services Market, Attractiveness Analysis, By End Use Industry
Figure 39: Microsoft Dynamics Services Market, Attractiveness Analysis, By Country
Figure 40: Europe Microsoft Dynamics Services Market Revenue Share Analysis, by Deployment Type, 2018 and 2026
Figure 41: Europe Microsoft Dynamics Services Market Revenue Share Analysis, by Product Type, 2018 and 2026
Figure 42: Europe Microsoft Dynamics Services Market Value Share Analysis, By Service Type, 2018 and 2026
Figure 43: Europe Microsoft Dynamics Services Market Value Share Analysis, By End Use Industry, 2018 and 2026
Figure 44: Europe Microsoft Dynamics Services Revenue Share Analysis, By Country, 2018 and 2026
Figure 45: The UK Microsoft Dynamics Services Market Revenue Share Analysis, By Deployment Type, 2018 and 2026
Figure 46: The UK Microsoft Dynamics Services Market Revenue Share Analysis, By Product Type, 2018 and 2026
Figure 47: The UK Microsoft Dynamics Services Market Value Share Analysis, By Service Type, 2018 and 2026
Figure 48: The UK Microsoft Dynamics Services Market Value Share Analysis, By End Use Industry, 2018 and 2026
Figure 49: Germany Microsoft Dynamics Services Market Revenue Share Analysis, By Deployment Type, 2018 and 2026
Figure 50: Germany Microsoft Dynamics Services Market Revenue Share Analysis, By Product Type, 2018 and 2026
Figure 51: Germany Microsoft Dynamics Services Market Value Share Analysis, By Service Type, 2018 and 2026
Figure 52: Germany Microsoft Dynamics Services Market Value Share Analysis, By End Use Industry, 2018 and 2026
Figure 53: France Microsoft Dynamics Services Market Revenue Share Analysis, By Deployment Type, 2018 and 2026
Figure 54: France Microsoft Dynamics Services Market Revenue Share Analysis, By Product Type, 2018 and 2026
Figure 55: France Microsoft Dynamics Services Market Value Share Analysis, By Service Type, 2018 and 2026
Figure 56: France Microsoft Dynamics Services Market Value Share Analysis, By End Use Industry, 2018 and 2026
Figure 57: Microsoft Dynamics Services Market, Attractiveness Analysis, By Deployment
Figure 58: Microsoft Dynamics Services Market, Attractiveness Analysis, By Component
Figure 59: Microsoft Dynamics Services Market, Attractiveness Analysis, By End Use Industry
Figure 60: Microsoft Dynamics Services Market, Attractiveness Analysis, By Country
Figure 61: Microsoft Dynamics Services Market, Attractiveness Analysis, By Country
Figure 62: Asia Pacific Microsoft Dynamics Services Market Revenue Share Analysis, by Deployment Type, 2018 and 2026
Figure 63: Asia Pacific Microsoft Dynamics Services Market Revenue Share Analysis, by Product Type, 2018 and 2026
Figure 64: Asia Pacific Microsoft Dynamics Services Market Value Share Analysis, By Service Type, 2018 and 2026
Figure 65: Asia Pacific Microsoft Dynamics Services Market Value Share Analysis, By End Use Industry, 2018 and 2026
Figure 66: Asia Pacific Microsoft Dynamics Services Revenue Share Analysis, By Country, 2018 and 2026
Figure 67: India Microsoft Dynamics Services Market Revenue Share Analysis, By Deployment Type, 2018 and 2026
Figure 68: India Microsoft Dynamics Services Market Revenue Share Analysis, By Product Type, 2018 and 2026
Figure 69: India Microsoft Dynamics Services Market Value Share Analysis, By Service Type, 2018 and 2026
Figure 70: India Microsoft Dynamics Services Market Value Share Analysis, By End Use Industry, 2018 and 2026
Figure 71: China Microsoft Dynamics Services Market Revenue Share Analysis, By Deployment Type, 2018 and 2026
Figure 72: China Microsoft Dynamics Services Market Revenue Share Analysis, By Product Type, 2018 and 2026
Figure 73: China Microsoft Dynamics Services Market Value Share Analysis, By Service Type, 2018 and 2026
Figure 74: China Microsoft Dynamics Services Market Value Share Analysis, By End Use Industry, 2018 and 2026
Figure 75: Japan Microsoft Dynamics Services Market Revenue Share Analysis, By Deployment Type, 2018 and 2026
Figure 76: Japan Microsoft Dynamics Services Market Revenue Share Analysis, By Product Type, 2018 and 2026
Figure 77: Japan Microsoft Dynamics Services Market Value Share Analysis, By Service Type, 2018 and 2026
Figure 78: Japan Microsoft Dynamics Services Market Value Share Analysis, By End Use Industry, 2018 and 2026
Figure 79: Microsoft Dynamics Services Market, Attractiveness Analysis, By Deployment
Figure 80: Microsoft Dynamics Services Market, Attractiveness Analysis, By Product Type
Figure 81: Microsoft Dynamics Services Market, Attractiveness Analysis, By Service Type
Figure 82: Microsoft Dynamics Services Market, Attractiveness Analysis, By Country
Figure 83: Microsoft Dynamics Services Market, Attractiveness Analysis, By Country
Figure 84: Middle East & Africa (MEA) Microsoft Dynamics Services Market Revenue Share Analysis, by Deployment Type, 2018 and 2026
Figure 85: Middle East & Africa (MEA) Microsoft Dynamics Services Market Revenue Share Analysis, by Product Type, 2018 and 2026
Figure 86: Middle East & Africa (MEA) Microsoft Dynamics Services Market Value Share Analysis, By Service Type, 2018 and 2026
Figure 87: Middle East & Africa (MEA) Microsoft Dynamics Services Market Value Share Analysis, By End Use Industry, 2018 and 2026
Figure 88: Middle East & Africa (MEA) Microsoft Dynamics Services Market Revenue Share Analysis, By Country, 2018 and 2026
Figure 89: GCC Countries Microsoft Dynamics Services Market Revenue Share Analysis, By Deployment Type, 2018 and 2026
Figure 90: GCC Countries Microsoft Dynamics Services Market Revenue Share Analysis, By Product Type, 2018 and 2026
Figure 91: GCC Countries Microsoft Dynamics Services Market Value Share Analysis, By Service Type, 2018 and 2026
Figure 92: GCC Countries Microsoft Dynamics Services Market Value Share Analysis, By End Use Industry, 2018 and 2026
Figure 93: South Africa Microsoft Dynamics Services Market Revenue Share Analysis, By Deployment Type, 2018 and 2026
Figure 94: South Africa Microsoft Dynamics Services Market Revenue Share Analysis, By Product Type, 2018 and 2026
Figure 95: South Africa Microsoft Dynamics Services Market Value Share Analysis, By Service Type, 2018 and 2026
Figure 96: South Africa Microsoft Dynamics Services Market Value Share Analysis, By End Use Industry, 2018 and 2026
Figure 97: Microsoft Dynamics Services Market, Attractiveness Analysis, By Deployment
Figure 98: Microsoft Dynamics Services Market, Attractiveness Analysis, By Component
Figure 99: Microsoft Dynamics Services Market, Attractiveness Analysis, By Service Type
Figure 100: Microsoft Dynamics Services Market, Attractiveness Analysis, By End Use Industry
Figure 101: Microsoft Dynamics Services Market, Attractiveness Analysis, By Country
Figure 102: South America Microsoft Dynamics Services Market Revenue Share Analysis, by Deployment Type, 2018 and 2026
Figure 103: South America Microsoft Dynamics Services Market Revenue Share Analysis, by Product Type, 2018 and 2026
Figure 104: South America Microsoft Dynamics Services Market Value Share Analysis, By Service Type, 2018 and 2026
Figure 105: South America Microsoft Dynamics Services Market Value Share Analysis, By End Use Industry, 2018 and 2026
Figure 106: South America Microsoft Dynamics Services Revenue Share Analysis, By Country, 2018 and 2026
Figure 107: Brazil Microsoft Dynamics Services Market Revenue Share Analysis, By Deployment Type, 2018 and 2026
Figure 108: Brazil Microsoft Dynamics Services Market Revenue Share Analysis, By Product Type, 2018 and 2026
Figure 109: Brazil Microsoft Dynamics Services Market Value Share Analysis, By End Use Industry, 2018 and 2026
Figure 110: Microsoft Dynamics Services Market, Attractiveness Analysis, By Deployment
Figure 111: Microsoft Dynamics Services Market, Attractiveness Analysis, By Product Type
Figure 112: Microsoft Dynamics Services Market, Attractiveness Analysis, By Service Type
Figure 113: Microsoft Dynamics Services Market, Attractiveness Analysis, By End Use Industry
Figure 114: Microsoft Dynamics Services Market, Attractiveness Analysis, By Country
Figure 115: Microsoft Dynamics Services Market Share Analysis by Company (2018)
Copyright © Transparency Market Research, Inc. All Rights reserved
Trust Online

Microsoft Dynamics Services Market Forecast Report, 2018 - 2026