
Reports
Reports
Global Marine Cables and Connectors Market: Snapshot
Ever since the first underwater cable was implemented in 1850 to deliver telegraphy traffic, marine cables and connectors have been playing a vital role in the integration of various sub-systems and systems across a number of industry verticals. In the recent years, the vast rise in the demand for reliable high performance, connectivity, and efficiency has been enhancing the growth of the marine cables and connectors market. Fiber-optic cables are being widely adopted in the telecommunication industry due to their advantages such as efficient data transfer and high-speed data transfer capabilities.
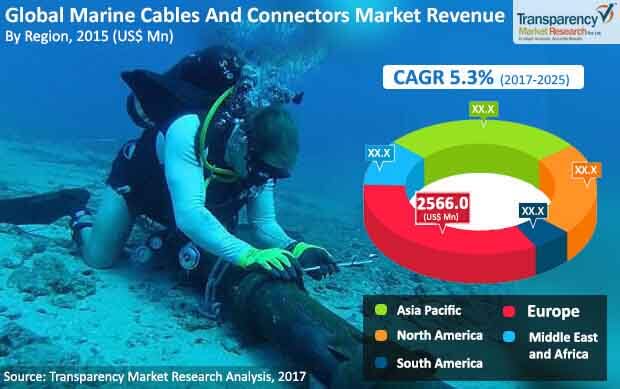
The global marine cables and connectors market was estimated at US$ 8869.8 Mn in the year of 2016 and is anticipated to expand at a CAGR of 5.3% throughout the forecast year from 2017 to 2025.
Cables to Continue to Account for Higher Share in Revenue
The global marine cables and connectors market has been segmented on the basis of type, underwater depth, end-use industry, and geography. On the basis of type, the market is broadly analyzed for cables and connectors. In 2016, the segment of cables accounted for the maximum market share in terms of revenue. The segment is also estimated to witness the most promising growth opportunity over the report’s forecast period. The connector segment is also expected to show substantial growth during the forecast period due to rise in applications with advancement in power transmission and telecommunication industry.
In terms of underwater depth, the marine cable and connector market is segmented into beach joint 1, beach joint 2, burial, and freelay. In 2016, the beach joint 2 segment held the dominant share in the global market and is also expected to expand at a high CAGR during the forecast period. This is mainly due to the vast increase in installation of power and telecommunication network lines in this under-water depth. Based on end-use industry verticals, the market is segmented into oil and gas, military and defense, telecommunication, and power transmission. In 2016, telecommunication industry accounted for the dominant market share, and is also predicted to expand at a healthy CAGR during the forecast period.
Asia Pacific Market to Present Promising Growth Opportunities
Geographically, the global marine cables and connectors market has been segmented into North America, Europe, Asia Pacific, Middle East & Africa and South America. Europe held the dominant share in the market, chiefly owing to the early adoption of marine cables and connectors, followed by Asia Pacific, in 2016. The market in Asia Pacific is likely to outpace other regional markets over the forecast period owing to extensive investment in telecommunication application and a massive rise in infrastructure upgrade activities across data centers.
North America, is projected to witness strong growth owing to the presence of several technology giants in the U.S. The vast rise in infrastructure upgrade activities owing to the global expansion of companies such as Facebook, Google, and Microsoft will lead to promising growth opportunities. The market in South America is expected to showcase slower growth in the marine cables and connectors market compared to other regions.
Some of the leading companies operating in the global marine cables and connectors market are Sea and Land Technologies Pte. Ltd., TE Connectivity, Inc., Eaton Corporation Plc., Fujitsu Limited, SAMCO Inc., Molex, Scorpion Oceanics, Hengtong Optic-Electric Co., Ltd., Teledyne Marine, Huawei Marine, SEACON, HESFIBEL, Axon Cable, OCC Corporation, General Cable Company, ZTT Corporation, and Nexans.
Growing Utilization in Internet of Things will Augment Growth of Marine Cables and Connectors Market
The marine cables and connectors give a serious advantage regarding superior and better transmission abilities in connection to satellite correspondence. Additionally, factors, for example, expanding utilization of marine cables and connectors in developing pervasion of different innovations, for example, cloud and Internet of Equipment across safeguard and military are projected to drive the market. In addition, the rising entrance of inventive advances, for example, Internet of Things and cloud across various businesses and immense development openings inferable from the expanded spotlight on improving media communications framework across a few arising economies could likewise end up being useful for the worldwide market.
A tremendous ascent in the demand for dependable elite, availability, and proficiency has been observed that is expected to improve the development of the marine cables and connectors market. Fiber-optic cables are in effect generally received in the media transmission industry because of their benefits, for example, proficient information move and fast information move capacities.
Various components are probably going to help the general extension of the worldwide marine cables and connectors market, remembering the enormous rush of ventures for the field of marine availability from telecom organizations and governments with the perspective on improving and expanding between and intra-country telecom organizations. The rising worldwide demand for higher and more solid bandwidth for powerful and quicker transmission of information and tremendous ventures from the safeguard and military areas are likewise expected to drive the market sooner rather than later. The immense ascent in server farms across the globe is likewise expected to support the general take-up of an assortment of marine cables and connectors.
Europe held the dominant position, attributable to the early appropriation of marine cables and connectors, trailed by Asia Pacific. North America, on the other hand, is projected to observe solid development inferable from the presence of a few innovation monsters in the U.S. The immense ascent in foundation redesign exercises inferable from the worldwide extension of organizations, for example, Facebook, Google, and Microsoft will prompt promising development openings.
Section 01 Preface
1.1. Market Definition and Scope
1.2. Market Segmentation
1.3. Key Research Objectives
1.4. Research Highlights
Section 02Assumptions and Research Methodology
Section 03 Executive Summary : Marine Cables And Connectors Market
Section 04 Market Dynamics
4.1 Introduction
4.2 Key Industry Developments
4.3. Drivers and Restraints Snapshot Analysis
4.3.1. Drivers
4.3.2. Restraints
4.4. Market Opportunity
4.5. Market Challenges
4.6. Key Market Trends
4.7. Value Chain Analysis
4.8. Market Opportunity Map
4.9. Key Market Indicator
4.10. Global Marine Cable and Connector Market Analysis and Forecasts, 2015 – 2025
4.11. Price Trend Analysis, By Connector
4.12. Porter’s Five Forces Analysis
4.13. Global Marine Cable And Connector Market Rules & Regulation, Market Outlook
Section 05 Global Marine Cables and Connectors Market Analysis By Type
5.1. Key Findings
5.2. Introduction – Definition
5.3. Global Thermal Flow Meter Size (US$ Mn & Thousand Units) Forecast, By Type, 2015 - 2025
5.3.1. Cable(USD Million)
5.3.1.1. Electric Cable
5.3.1.2. Fiber-optic
5.3.2. Connector(USD Million and Thousand Units)
5.4. Marine Cables And Connector Comparison Matrix, By Type
5.5. Marine Cables And Connectors Market Attractiveness Analysis, By Type
5.6. Marine Cables And Connectors Market Attractiveness Analysis, By Cable Type
5.7.MarineCable Impacts
Section 06 Global Marine Cables and Connectors Market Analysis By Underwater depth
6.1. Key Findings
6.2. Introduction – Definition
6.3.Global Marine Cables And Connectors Market Value Share Analysis, By Underwater Depth
6.3.1. Beach Joint 1
6.3.2. Beach Joint 2
6.3.4. Burial
6.3.5. Freelay
6.4. Marine Cables And Connectors Market Size (Revenue), By Underwater Depth
6.5. Marine Cables And Connectors Market Comparison Matrix, By Underwater Depth
6.6. Marine Cables And Connectors Market Attractiveness Analysis, By Underwater Depth
Section 07 Global Marine Cable and Connector Market Analysis By End Use Industry
7.1. Key Findings
7.2. Introduction - Definition
7.3. Global Marine Cables And Connectors Market Value Share Analysis, By End-Use Industry
7.3.1. Oil and Gas
7.3.2. Military and Defense
7.3.3. Telecommunication
7.3.4. Power Transmission
7.3.5. Others
7.4. Marine Cables And Connectors Market Analysis, By End-use Industry
7.5. Marine Cables And Connectors Market Comparison Matrix, By End-use Industry
Section 08 Global Marine Cables And Connectors Market Analysis, By Region
8.1. Key Findings
8.2. Global Marine Cables And Connectors Market CAGR (2017 – 2025) Analysis, By Country
8.3. Global Marine Cables And Connectors Market CAGR (2017 – 2025) Analysis, By Region
8.3.1. North America
8.3.2. Europe
8.3.3. Asia Pacific
8.3.4. Middle-East and Africa
8.3.5. South Africa
8.4. Global Marine Cables And Connectors Market Forecast, By Region
8.5. Global Marine Cables And Connectors Market Comparison Matrix, By Region
8.6. Global Marine Cables And Connectors Market Attractiveness Analysis, By Region
Section 09 North America Marine Cables And Connectors, Market Analysis
9.1. Key Findings
9.2. North America Market Trends
9.3. North America Marine Cables And Connectors Market Overview
9.4. Market Size (US$ Mn) Forecast By Type, 2015-2025
9.4.1. Cable
9.4.1.1. Electric Cable
9.4.2.1. Fiber-optic Cable
9.4.2. Connector
9.5. Market Size (US$ Mn) Forecast By Underwater Depth, 2015-2025
9.5.1. Beach Joint 1
9.5.2. Beach Joint 2
9.5.3. Burial
9.5.4. Freelay
9.6. Market Size (US$ Mn) Forecast By End Use Application, 2015-2025
9.6.1. Oil & Gas
9.6.2. Military and Defense
9.6.3. Telecommunication
9.6.4. Power Transmission
9.6.5. Others
9.7. Market Size (US$ Mn) Forecast By Country, 2015-2025
9.7.1. The U.S
9.7.2. Canada
9.7.3. Mexico
9.8. North America Marine Cables And Connectors Market Attractiveness
9.8.1. Type
9.8.2. Underwater Depth
9.8.3. End-use Industry
9.8.4. Country
Section 10 EuropeMarine Cables And Connectors, Market Analysis
10.1. Key Findings
10.2. Europe Market Trends
10.3. Europe Marine Cables And Connectors Market Overview
10.4. Market Size (US$ Mn) Forecast By Type, 2015-2025
10.4.1. Cable
10.4.1.1. Electric Cable
10.4.2.1. Fiber-optic Cable
10.4.2. Connector
10.5. Market Size (US$ Mn) Forecast By Underwater Depth, 2015-2025
10.5.1. Beach Joint 1
10.5.2. Beach Joint 2
10.5.3. Burial
10.5.4. Freelay
10.6. Market Size (US$ Mn) Forecast By End Use Application, 2015-2025
10.6.1. Oil & Gas
10.6.2. Military and Defense
10.6.3. Telecommunication
10.6.4. Power Transmission
10.6.5. Others
10.7. Market Size (US$ Mn) Forecast By Country, 2015-2025
10.7.1. U.K
10.7.2. France
10.7.3. Germany
10.7.4. Netherlands
10.7.5. Rest of Europe
10.8. Europe Marine Cables And Connectors Market Attractiveness
10.8.1. Type
10.8.2. Underwater Depth
10.8.3. End-use Industry
10.8.4. Country
Section 11 Asia Pacific Marine Cables And Connectors, Market Analysis
11.1. Key Findings
11.2. Asia Pacific Market Trends
11.3. Asia Pacific Marine Cables And Connectors Market Overview
11.4. Market Size (US$ Mn) Forecast By Type, 2015-2025
11.4.1. Cable
11.4.1.1. Electric Cable
11.4.2.1. Fiber-optic Cable
11.4.2. Connector
11.5. Market Size (US$ Mn) Forecast By Underwater Depth, 2015-2025
11.5.1. Beach Joint 1
11.5.2. Beach Joint 2
11.5.3. Burial
11.5.4. Freelay
11.6. Market Size (US$ Mn) Forecast By End Use Application, 2015-2025
11.6.1. Oil & Gas
11.6.2. Military and Defense
11.6.3. Telecommunication
11.6.4. Power Transmission
11.6.5. Others
11.7. Market Size (US$ Mn) Forecast By Country, 2015-2025
11.7.1. China
11.7.2. Japan
11.7.3. India
11.7.5. Rest of Asia Pacific
11.8. Asia Pacific Marine Cables And Connectors Market Attractiveness
11.8.1. Type
11.8.2. Underwater Depth
11.8.3. End-use Industry
11.8.4. Country
Section 12 Middle-East and Africa Marine Cables And Connectors, Market Analysis
12.1. Key Findings
12.2. Middle-East and Africa Market Trends
12.3. Middle-East and Africa Marine Cables And Connectors Market Overview
12.4. Market Size (US$ Mn) Forecast By Type, 2015-2025
12.4.1. Cable
12.4.1.1. Electric Cable
12.4.2.1. Fiber-optic Cable
12.4.2. Connector
12.5. Market Size (US$ Mn) Forecast By Underwater Depth, 2015-2025
12.5.1. Beach Joint 1
12.5.2. Beach Joint 2
12.5.3. Burial
12.5.4. Freelay
12.6. Market Size (US$ Mn) Forecast By End Use Application, 2015-2025
12.6.1. Oil & Gas
12.6.2. Military and Defense
12.6.3. Telecommunication
12.6.4. Power Transmission
12.6.5. Others
12.7. Market Size (US$ Mn) Forecast By Country, 2015-2025
12.7.1. GCC
12.7.2. South Africa
12.7.3. Rest of Middle-East and Africa
12.8. Middle-East and Africa Marine Cables And Connectors Market Attractiveness
12.8.1. Type
12.8.2. Underwater Depth
12.8.3. End-use Industry
12.8.4. Country
Section 13 South America Marine Cables And Connectors, Market Analysis
13.1. Key Findings
13.2. South America Market Trends
13.3. South America Marine Cables And Connectors Market Overview
13.4. Market Size (US$ Mn) Forecast By Type, 2015-2025
13.4.1. Cable
13.4.1.1. Electric Cable
13.4.2.1. Fiber-optic Cable
13.4.2. Connector
13.5. Market Size (US$ Mn) Forecast By Underwater Depth, 2015-2025
13.5.1. Beach Joint 1
13.5.2. Beach Joint 2
13.5.3. Burial
13.5.4. Freelay
13.6. Market Size (US$ Mn) Forecast By End Use Application, 2015-2025
13.6.1. Oil & Gas
13.6.2. Military and Defense
13.6.3. Telecommunication
13.6.4. Power Transmission
13.6.5. Others
13.7. Market Size (US$ Mn) Forecast By Country, 2015-2025
13.7.1. Brazil
13.7.2. Rest of South America
13.8. South America Cables And Connectors Market Attractiveness
13.8.1. Type
13.8.2. Underwater Depth
13.8.3. End-use Industry
13.8.4. Country
Section 14 Competitive Landscape
14.1. Market Player – Competition Matrix
14.2. Market Share Analysis By Company (2016)
14.3. Key Market Players
14.3.1. Sea and Land Technologies Pte. Ltd.
14.3.2. TE connectivity
14.3.3. Eaton Corporation Plc.
14.3.4. Fujitsu Ltd.
14.3.5. Molex
14.3.6. Scorpion Oceanics
14.3.7. Hengtong Optic-Electric Co., Ltd.
14.3.8. ABB Ltd.
14.3.9. Teledyne Marine
14.3.10. Huawei Marine
14.3.11. Seacon
14.3.12. Hesfibel
14.3.13. Axon Cable
14.3.14. OCC Corporation
14.3.15. General Cable Company
14.3.16. ZTT Cable
14.3.17. Nexans
List of Tables
Table 1 Global Marine Cables And Connector Market Size (Revenue) Forecast, By Types, 2015–2025 (US$ Mn)
Table 2 Global Marine Cables And Connectors Market Size (Volume) Forecast, By Cables Type, 2015–2025 (US$ Mn )
Table 3 Global Marine Cables And Connectors Market Size (Volume) Forecast, By Connector, 2015–2025 (USD Mn &Thousand Units )
Table 4 Global Marine Cables And Connector Market Size (Revenue) Forecast, By Underwater Depth, 2015–2025 (US$ Mn)
Table 5 Global Marine Cables And Connectors Market Size (US$ Mn) Forecast, By End-use Industry, 2015 – 2025
Table 6 Global Marine Cables And Connectors Market Size (US$ Mn) Forecast, By Region, 2015 – 2025
Table 7 North America Marine Cables And Connectors Market Size (US$ Mn) Forecast, By Type, 2015 – 2025
Table 8 North America Marine Cables And Connectors Market Size (US$ Mn) Forecast, By Cable Type, 2015 – 2025
Table 9 North America Marine Cables And Connectors Market Size (Volume) Forecast, By Connector, 2015–2025 (USD Mn &Thousand Units )
Table 10 North America Marine Cable And Connector Market Size (US$ Mn) Forecast , By Underwater Depth, 2015 – 2025
Table 11 North America Marine Cables And Connectors Market Size (US$ Mn) Forecast, By End-use Industry2015 – 2025
Table 12 North America Marine Cables And Connectors Market Size (US$ Mn) Forecast, By Country, 2015 – 2025
Table 13 Europe Marine Cables And Connectors Market Size (US$ Mn) Forecast, By Type, 2015 – 2025
Table 14 Europe Marine Cables And Connectors Market Size (US$ Mn) Forecast, By Cable Type, 2015 – 2025
Table 15 Europe Marine Cables And Connectors Market Size (Volume) Forecast, By Connector, 2015–2025 (USD Mn &Thousand Units )
Table 16 Europe Marine Cable And Connector Market Size (US$ Mn) Forecast , By Underwater Depth, 2015 – 2025
Table 17 Europe Marine Cables And Connectors Market Size (US$ Mn) Forecast, By End-use Industry2015 – 2025
Table 18 Europe Marine Cables And Connectors Market Size (US$ Mn) Forecast, By Country, 2015 – 2025
Table 19 Asia Pacific Marine Cables And Connectors Market Size (US$ Mn) Forecast, By Type, 2015 – 2025
Table 20 Asia Pacific Marine Cables And Connectors Market Size (US$ Mn) Forecast, By Cable Type, 2015 – 2025
Table 21 Asia Pacific Marine Cables And Connectors Market Size (Volume) Forecast, By Connector, 2015–2025 (USD Mn &Thousand Units )
Table 22 Asia Pacific Marine Cable And Connector Market Size (US$ Mn) Forecast , By Underwater Depth, 2015 – 2025
Table 23 Asia Pacific Marine Cables And Connectors Market Size (US$ Mn) Forecast, By End-use Industry, 2015 – 2025
Table 24 Asia Pacific Marine Cables And Connectors Market Size (US$ Mn) Forecast, By Country, 2015 – 2025
Table 25 Middle-East & Africa Marine Cables And Connectors Market Size (US$ Mn) Forecast, By Type, 2015 – 2025
Table 26 Middle-East & Africa Marine Cables And Connectors Market Size (US$ Mn) Forecast, By Cable Type, 2015 – 2025
Table 27 Middle-East & Africa Marine Cables And Connectors Market Size (Volume) Forecast, By Connector, 2015–2025 (USD Mn &Thousand Units )
Table 28 Middle-East & Africa Marine Cable And Connector Market Size (US$ Mn) Forecast , By Underwater Depth, 2015 – 2025
Table 29 Middle-East & Africa Marine Cables And Connectors Market Size (US$ Mn) Forecast, By End-use Industry2015 – 2025
Table 30 Middle-East & Africa Marine Cables And Connectors Market Size (US$ Mn) Forecast, By Country, 2015 – 2025
Table 31 South America Marine Cables And Connectors Market Size (US$ Mn) Forecast, By Type, 2015 – 2025
Table 32 South America Marine Cables And Connectors Market Size (US$ Mn) Forecast, By Cable Type, 2015 – 2025
Table 33 South Africa Marine Cables And Connectors Market Size (Volume) Forecast, By Connector, 2015–2025 (USD Mn &Thousand Units )
Table 34 South America Marine Cable And Connector Market Size (US$ Mn) Forecast , By Underwater Depth, 2015 – 2025
Table 35 South America Marine Cables And Connectors Market Size (US$ Mn) Forecast, By End-use Industry2015 – 2025
Table 36 South America Marine Cables And Connectors Market Size (US$ Mn) Forecast, By Country, 2015 – 2025
List of Figures
Figure 1 Global Marine Cables And Connectors Market Analysis
Figure 2 Global Marine Cable and Connector Market Value Share, by Region, 2025
Figure 3 Global Marine Cable and Connector Market Value Share, by Region, 2025
Figure 4 Market Opportunity Map(Type, Underwater depth)
Figure 5 Market Opportunity Map(End-use Industry)
Figure 6 Global Marine Cable and Connector Market (In US$ Mn) 2015- 2025
Figure 7 Global Marine Cable And Connector Market (US$ Mn) Forecast, 2015–2025
Figure 8 Price Trend Analysis, By Connector(Average Price, US$)
Figure 9 Market Revenue Share, By Type (2017)
Figure 10 Market Revenue Share, By Cable Type (2017)
Figure 11 Market Revenue Share, By Geography (2017)
Figure 12 Global Marine Cables and Connector Market Share Analysis, By Type, 2017 and 2025
Figure 13 Global Marine Cables and Connector Market Share Analysis, By Cable Type, 2017 and 2025
Figure 14 Cables Market Size (US$ Mn) and Y-o-Y Growth (%), 2015–2025
Figure 15 Connectors Market Size (US$ Mn) and Y-o-Y Growth (%), 2015–2025
Figure 16 Electric Cable Market Size (US$ Mn) and Y-o-Y Growth (%), 2015–2025
Figure 17 Fiber- Optics Cable Market Size (US$ Mn) and Y-o-Y Growth (%), 2015–2025
Figure 18 Marine Cable And Connector Market Comparison Matrix, By Type
Figure 19 Global Marine Cables And Connectors Market Attractiveness Analysis, by Type
Figure 20 Global Marine Cables And Connectors Market Attractiveness Analysis, by Type
Figure 21 Global Marine Cable And Connector Market Value Share Analysis By Underwater Depth, 2017 and 2025
Figure 22 Beach Joint 1 Market Size (US$ Mn) and Y-o-Y Growth (%), 2015–2025
Figure 23 Beach Joint 2 Market Size (US$ Mn) and Y-o-Y Growth (%), 2015–2025
Figure 24 Burial Market Size (US$ Mn) and Y-o-Y Growth (%), 2015–2025
Figure 25 Freelay Market Size (US$ Mn) and Y-o-Y Growth (%), 2015–2025
Figure 26 Marine Cable And Connector Market Comparison Matrix, By Underwater Depth
Figure 27 Global Marine Cables And Connectors Market Attractiveness Analysis, by Underwater Depth
Figure 28 Global Marine Cable And Connectors Market Revenue Share Analysis, By End-use Industry, 2017 and 2025
Figure 29 Oil and Gas Market Size (US$ Mn) and Y-o-Y Growth (%), 2015–2025
Figure 30 Military and Defense Market Size (US$ Mn) and Y-o-Y Growth (%), 2015–2025
Figure 31 Telecommunication Market Size (US$ Mn) and Y-o-Y Growth (%), 2015–2025
Figure 32 Power Transmission Market Size (US$ Mn) and Y-o-Y Growth (%), 2015–2025
Figure 33 Others Market Size (US$ Mn) and Y-o-Y Growth (%), 2015–2025
Figure 34 Global Marine Cables And Connectors Market Comparison Matrix, By End–use Industry
Figure 35 Global Marine Cable And Connectors Market Attractiveness Analysis, by End Use Industry
Figure 36 Marine Cables And Connectors Market CAGR (2017 – 2025) Analysis, By Country
Figure 37 Marine Cables And Connectors Market CAGR (2017 – 2025) Analysis, By Region
Figure 38 Marine Cables And Connectors Market Comparison Matrix, By Region
Figure 39 Global Marine Cables And Connectors Market Attractiveness Analysis, By Region
Figure 40 North America Marine Cables And Connectors Market Size (US$ Mn) Forecast, 2015 – 2025
Figure 41 North America Marine Cables And Connectors Market Size Y-o-Y Growth Projection, 2015 – 2025
Figure 42 North America Cables And Connectors Market Value Share Analysis, By Type, 2017 and 2025
Figure 43 North America Marine Cables And Connectors Market Size (US$ Mn) Forecast, By Cable Type, 2015 – 2025
Figure 44 North America Marine Cable And Connector Market Value Share Analysis, By Underwater Depth, 2017 and 2025
Figure 45 North America Marine Cables And Connectors Market Value Share Analysis, By End-use Industry, 2017 and 2025
Figure 46 North America Marine Cables And Connectors Market Revenue Share Analysis, By Country, 2017 and 2025
Figure 47 North America Marine Cables And Connectors Market Value Share Analysis, by the U.S.
Figure 48 North America Marine Cables And Connectors Market Value Share Analysis, by Canada
Figure 49 North America Marine Cables And Connectors Market Value Share Analysis, by Rest of North America
Figure 50 North America Marine Cables And Connectors Market Attractiveness Analysis, By Type
Figure 51 North America Marine Cables And Connectors Market Attractiveness Analysis, By Underwater Depth
Figure 52 North America Marine Cables And Connectors Market Attractiveness Analysis, By End-use Industry
Figure 53 North America Marine Cables And Connectors Market Attractiveness Analysis, By Country
Figure 54 Europe Marine Cables And Connectors Market Size (US$ Mn) Forecast, 2015 – 2025
Figure 55 Europe Marine Cables And Connectors Market Size Y-o-Y Growth Projection, 2015 – 2025
Figure 56 Europe Marine Cables And Connectors Market Value Share Analysis, By Type, 2017 and 2025
Figure 57 Europe Cables And Connectors Market Value Share Analysis, By Cable Type, 2017 and 2025
Figure 58 Europe Marine Cable And Connector Market Value Share Analysis, By Underwater Depth, 2017 and 2025
Figure 59 Europe Marine Cables And Connectors Market Value Share Analysis, By End-use Industry, 2017 and 2025
Figure 60 Europe Marine Cables And Connectors Market Revenue Share Analysis, By Country, 2017 and 2025
Figure 61 Europe Marine Cables And Connectors Market Value Share Analysis, by the U.K.
Figure 62 Europe Marine Cables And Connectors Market Value Share Analysis, by France
Figure 63 Europe Marine Cables And Connectors Market Value Share Analysis, by the Netherlands
Figure 64 Europe Marine Cables And Connectors Market Value Share Analysis, by Germany
Figure 65 Europe Marine Cables And Connectors Market Value Share Analysis, by Rest of Europe
Figure 66 Europe Marine Cables And Connectors Market Attractiveness Analysis, By Type
Figure 67 Europe Marine Cables And Connectors Market Attractiveness Analysis, By End-use Industry
Figure 68 Europe Marine Cables And Connectors Market Attractiveness Analysis, By Underwater Depth
Figure 69 Asia Pacific Marine Cables And Connectors Market Size (US$ Mn) Forecast, 2015 – 2025
Figure 70 Asia Pacific Marine Cables And Connectors Market Size Y-o-Y Growth Projection, 2015 – 2025
Figure 71 Asia Pacific Cables And Connectors Market Value Share Analysis, By Type, 2017 and 2025
Figure 72 Asia Pacific Cables And Connectors Market Value Share Analysis, By Cable Type, 2017 and 2025
Figure 73 Asia Pacific Marine Cable And Connector Market Value Share Analysis, By Underwater Depth, 2017 and 2025
Figure 74 Asia Pacific Marine Cables And Connectors Market Value Share Analysis, By End-use Industry, 2017 and 2025
Figure 75 Asia Pacific Marine Cables And Connectors Market Revenue Share Analysis, By Country, 2017 and 2025
Figure 76 Asia Pacific Marine Cables And Connectors Market Value Share Analysis, by China
Figure 77 Asia Pacific Marine Cables And Connectors Market Value Share Analysis, by India
Figure 78 Asia Pacific Marine Cables And Connectors Market Value Share Analysis, by the Japan
Figure 79 Asia Pacific Marine Cables And Connectors Market Value Share Analysis, by Rest of Asia Pacific
Figure 80 Asia Pacific Marine Cables And Connectors Market Attractiveness Analysis, By Type
Figure 81 Asia Pacific Marine Cables And Connectors Market Attractiveness Analysis, By End-use Industry
Figure 82 Asia Pacific Marine Cables And Connectors Market Attractiveness Analysis, By Underwater Depth
Figure 83 Asia Pacific Marine Cables And Connectors Market Attractiveness Analysis, By Country
Figure 84 Middle-East & Africa Marine Cables And Connectors Market Size (US$ Mn) Forecast, 2015 – 2025
Figure 85 Middle-East & Africa Marine Cables And Connectors Market Size Y-o-Y Growth Projection, 2015 – 2025
Figure 86 Middle-East & Africa Cables And Connectors Market Value Share Analysis, By Type, 2017 and 2025
Figure 87 Middle-East & Africa Cables And Connectors Market Value Share Analysis, By Cable Type, 2017 and 2025
Figure 88 Middle-East & Africa Marine Cable And Connector Market Value Share Analysis, By Underwater Depth, 2017 and 2025
Figure 89 Middle-East & Africa Marine Cables And Connectors Market Value Share Analysis, By End-use Industry, 2017 and 2025
Figure 90 Middle-East & Africa Marine Cables And Connectors Market Revenue Share Analysis, By Country, 2017 and 2025
Figure 91 Middle-East and Africa Marine Cables And Connectors Market Value Share Analysis, by the GCC
Figure 92 Middle-East and Africa Marine Cables And Connectors Market Value Share Analysis, by South Africa
Figure 93 Middle-East and Africa Europe Marine Cables And Connectors Market Value Share Analysis, by Rest of Middle-East and Africa
Figure 94 Middle-East & Africa Marine Cables And Connectors Market Attractiveness Analysis, By Type
Figure 95 Middle-East & Africa Marine Cables And Connectors Market Attractiveness Analysis, By End-use Industry
Figure 96 Middle-East & Africa Marine Cables And Connectors Market Attractiveness Analysis, By Underwater Depth
Figure 97 Middle-East & Africa Marine Cables And Connectors Market Attractiveness Analysis, By Country
Figure 98 South America Marine Cables And Connectors Market Size (US$ Mn) Forecast, 2015 – 2025
Figure 99 South America Marine Cables And Connectors Market Size Y-o-Y Growth Projection, 2015 – 2025
Figure 100 South America Cables And Connectors Market Value Share Analysis, By Type, 2017 and 2025
Figure 101 South America Cables And Connectors Market Value Share Analysis, By Cable Type, 2017 and 2025
Figure 102 South America Marine Cable And Connector Market Value Share Analysis, By Underwater Depth, 2017 and 2025
Figure 103 South America Marine Cables And Connectors Market Value Share Analysis, By End-use Industry, 2017 and 2025
Figure 104 South America Marine Cables And Connectors Market Revenue Share Analysis, By Country, 2017 and 2025
Figure 105 South America Marine Cables And Connectors Market Value Share Analysis, by the Brazil
Figure 106 South America Marine Cables And Connectors Market Value Share Analysis, by Rest of South America
Figure 107 South America Marine Cables And Connectors Market Attractiveness Analysis, By Type
Figure 108 South America Marine Cables And Connectors Market Attractiveness Analysis, By End-use Industry
Figure 109 South America Marine Cables And Connectors Market Attractiveness Analysis, By Underwater Depth
Figure 110 South America Marine Cables And Connectors Market Attractiveness Analysis, By Country
Figure 111 Marine Cables and Connectors Market Share Analysis (2016)
Copyright © Transparency Market Research, Inc. All Rights reserved
Trust Online

Marine Cables and Connectors Market