
Reports
Reports
With a wealth of technological innovation on the horizon, orthopedic surgery is heading on the path of minimal invasive and more precise operations, with a greater proportion of outpatient and overnight procedures. While significant advances have occurred inside operating rooms, several changes have also been taking place beyond the clinic room, outside of the hospital, and in the time before and after the surgery. As new tools and techniques continue to enter the orthopedic practice, analysts at Transparency Market Research (TMR) turn the spotlight on the lower extremity post-operative orthotics market, in their new research study.
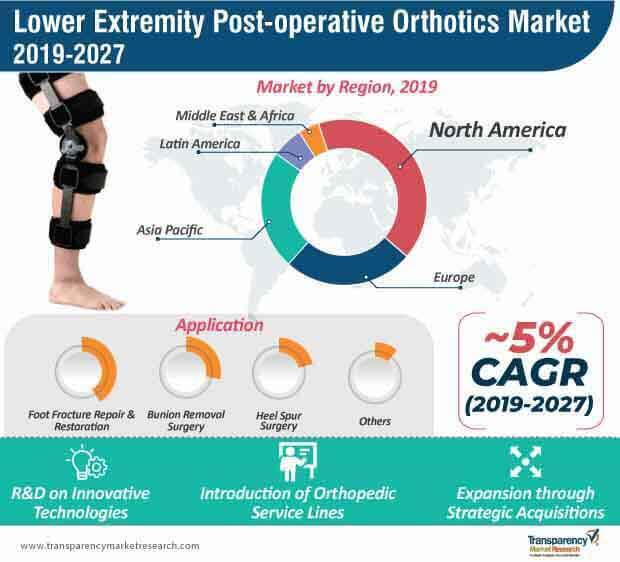
TMR’s analysts expect the market to grow ~5% year-over-year, to reach a value of ~US$ 817 million in 2019, up from ~ US$ 785 million in 2018. Lower extremity post-operative orthotics have been gathering increased momentum as a viable rehabilitative device to help restore altered lower extremity biomechanics and promote fast recovery, following surgery.
In the view of changing habits and rapid inclination towards sedentary lifestyles, a large number of individuals, worldwide, are affected by medical conditions such as obesity and diabetes that can create severe symptoms in their feet, ankles, knees, and other parts of the body. Some feet- and ankle-related disorders require surgical interventions, thereby potentially raising the demand for lower extremity post-operative orthotics.
According to TMR’s analysts, rising application in foot fracture repair & restoration accounted for ~40% sales in 2018, while greater awareness and efficacy of lower extremity post-operative orthotics in the recovery of bunion surgery is likely to result in increased profit pools of market players. As patients are seeking personalization in lower extremity post-operative orthotics purchases, manufacturers are targeted towards developing custom and prefabricated devices through the incorporation of innovative technologies such as 3D printing and robotic automation in manufacturing. These technologies are further likely to enable modifications based on an individual patient’s anatomy and functionality.
However, it is pertinent to note that, lack of proven studies regarding the efficacy and relevance of custom foot post-op orthotics in providing positive outcome has added to the reluctance of their prescription as well as adoption.
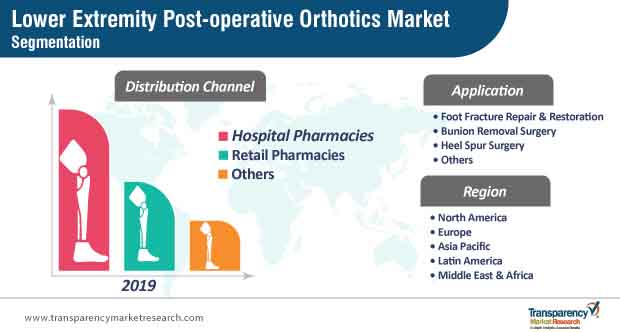
Although the market remains considerably consolidated, with a few large-sized multinational players enjoying monopoly in certain segments, a number of small players have been recently posing significant competition by offering high quality products at affordable prices at local levels. As the competition intensifies, a strong product portfolio no longer suffices for maintaining a distinctive brand persona. While hospital pharmacies continue to influence growth strategies, the emergence of new digital channels such as mail-order pharmacies or Internet pharmacies is likely to bring significant changes in terms of targeting a larger patient pool and increasing overall reach.
High adoption of better treatment options and favorable reimbursement policies in North America have worked to the advantage of stakeholders in the lower extremity post-operative orthotics market. In addition, these stakeholders are tapping into newer opportunities in developing countries in Asia Pacific, considering increased healthcare expenditure per capita and rapid adoption of novel treatment methods in the region.
Analysts’ Viewpoint
As governments in developing countries are investing in healthcare infrastructure, and small players are placing their bets on offering cost-effective products, key players will need to strengthen their marketing capabilities. Considering the dissatisfaction towards the efficacy of lower extremity post-operative orthotics, strong collaborative models between manufacturers and research institutes will not only aid in developing better quality products but also remain a key in gaining a distinct competitive edge. Consequently, small players will need to dedicate their efforts in R&D initiatives and technological innovations to strengthen their position in the landscape.
The report provides the profiles of leading players operating in the global lower extremity post-operative orthotics market. Key companies present in the lower extremity post-operative orthotics market include
Lower extremity post-operative orthotics market is projected to reach a value of ~US$ 1.2 Bn by 2027
Lower extremity post-operative orthotics market to expand at a CAGR of ~5.3% from 2019 to 2027
Lower extremity post-operative orthotics market is driven by rise in the number of surgeries and favorable government policies & initiatives in developing countries
North America accounted for a major share of the global lower extremity post-operative orthotics market
Key players in the lower extremity post-operative orthotics market Hanger, Inc., DJO Global, Inc., Fillauer LLC, Ottobock SE & Co. KGaA (Ottobock Holding), Bauerfeind AG
1. Preface
1.1. Market Definition and Scope
1.2. Market Segmentation
1.3. Key Research Objectives
1.4. Research Highlights
2. Assumptions and Research Methodology
3. Executive Summary: Global Lower Extremity Post-operative Orthotics Market
4. Market Overview
4.1. Introduction
4.2. Overview
4.3. Market Dynamics
4.3.1. Drivers
4.3.2. Restraints
4.3.3. Opportunities
4.4. Global Lower Extremity Post-operative Orthotics Market Analysis and Forecast, 2017–2027
5. Market Outlook
5.1. Number of Major Lower Extremity Surgeries, by Major Region
5.2. Value Chain Analysis - Prosthetics & Orthotics Market
5.3. Reimbursement Scenario
6. Global Lower Extremity Post-operative Orthotics Market Analysis and Forecast, by Application
6.1. Introduction & Definition
6.2. Key Findings / Developments
6.3. Market Value Forecast, by Application, 2017–2027
6.3.1. Foot Fracture Repair and Restoration
6.3.2. Bunion Removal Surgery
6.3.3. Heel Spur Surgery
6.3.4. Others
6.4. Market Attractiveness, by Application
7. Global Lower Extremity Post-operative Orthotics Market Analysis and Forecast, by Distribution Channel
7.1. Introduction & Definition
7.2. Key Findings / Developments
7.3. Market Value Forecast, by Distribution Channel, 2017–2027
7.3.1. Hospital Pharmacies
7.3.2. Retail Pharmacies
7.3.3. Others
7.4. Market Attractiveness, by Distribution Channel
8. Global Lower Extremity Post-operative Orthotics Market Analysis and Forecast, by Region
8.1. Key Findings
8.2. Market Value Forecast, by Region
8.2.1. North America
8.2.2. Europe
8.2.3. Asia Pacific
8.2.4. Latin America
8.2.5. Middle East & Africa
8.3. Market Attractiveness, by Region
9. North America Lower Extremity Post-operative Orthotics Market Analysis and Forecast
9.1. Introduction
9.2. Market Value Forecast, by Application, 2017–2027
9.2.1. Foot Fracture Repair and Restoration
9.2.2. Bunion Removal Surgery
9.2.3. Heel Spur Surgery
9.2.4. Others
9.3. Market Value Forecast, by Distribution Channel, 2017–2027
9.3.1. Hospital Pharmacies
9.3.2. Retail Pharmacies
9.3.3. Others
9.4. Market Value Forecast, by Country, 2017–2027
9.4.1. U.S.
9.4.2. Canada
9.5. Market Attractiveness Analysis
9.5.1. By Application
9.5.2. By Distribution Channel
9.5.3. By Country
10. Europe Lower Extremity Post-operative Orthotics Market Analysis and Forecast
10.1. Introduction
10.2. Market Value Forecast, by Application, 2017–2027
10.2.1. Foot Fracture Repair and Restoration
10.2.2. Bunion Removal Surgery
10.2.3. Heel Spur Surgery
10.2.4. Others
10.3. Market Value Forecast, by Distribution Channel, 2017–2027
10.3.1. Hospital Pharmacies
10.3.2. Retail Pharmacies
10.3.3. Others
10.4. Market Value Forecast, by Country/Sub-region, 2017–2027
10.4.1. Germany
10.4.2. U.K.
10.4.3. France
10.4.4. Spain
10.4.5. Italy
10.4.6. Rest of Europe
10.5. Market Attractiveness Analysis
10.5.1. By Application
10.5.2. By Distribution Channel
10.5.3. By Country/Sub-region
11. Asia Pacific Lower Extremity Post-operative Orthotics Market Analysis and Forecast
11.1. Introduction
11.2. Market Value Forecast, by Application, 2017–2027
11.2.1. Foot Fracture Repair and Restoration
11.2.2. Bunion Removal Surgery
11.2.3. Heel Spur Surgery
11.2.4. Others
11.3. Market Value Forecast, by Distribution Channel, 2017–2027
11.3.1. Hospital Pharmacies
11.3.2. Retail Pharmacies
11.3.3. Others
11.4. Market Value Forecast, by Country/Sub-region, 2017–2027
11.4.1. China
11.4.2. Japan
11.4.3. India
11.4.4. Australia & New Zealand
11.4.5. Rest of Asia Pacific
11.5. Market Attractiveness Analysis
11.5.1. By Application
11.5.2. By Distribution Channel
11.5.3. By Country/Sub-region
12. Latin America Lower Extremity Post-operative Orthotics Market Analysis and Forecast
12.1. Introduction
12.2. Market Value Forecast, by Application, 2017–2027
12.2.1. Foot Fracture Repair and Restoration
12.2.2. Bunion Removal Surgery
12.2.3. Heel Spur Surgery
12.2.4. Others
12.3. Market Value Forecast, by Distribution Channel, 2017–2027
12.3.1. Hospital Pharmacies
12.3.2. Retail Pharmacies
12.3.3. Others
12.4. Market Value Forecast, by Country/Sub-region, 2017–2027
12.4.1. Brazil
12.4.2. Mexico
12.4.3. Rest of Latin America
12.5. Market Attractiveness Analysis
12.5.1. By Application
12.5.2. By Distribution Channel
12.5.3. By Country/Sub-region
13. Middle East & Africa Lower Extremity Post-operative Orthotics Market Analysis and Forecast
13.1. Introduction
13.2. Market Value Forecast, by Application, 2017–2027
13.2.1. Foot Fracture Repair and Restoration
13.2.2. Bunion Removal Surgery
13.2.3. Heel Spur Surgery
13.2.4. Others
13.3. Market Value Forecast, by Distribution Channel, 2017–2027
13.3.1. Hospital Pharmacies
13.3.2. Retail Pharmacies
13.3.3. Others
13.4. Market Value Forecast, by Country/Sub-region, 2017–2027
13.4.1. GCC Countries
13.4.2. South Africa
13.4.3. Rest of Middle East & Africa
13.5. Market Attractiveness Analysis
13.5.1. By Application
13.5.2. By Distribution Channel
13.5.3. By Country/Sub-region
14. Competition Landscape
14.1. Lower Extremity Post-operative Orthotics Market: Competitive Dashboard
14.2. Company Profiles
14.2.1. Hanger, Inc.
14.2.1.1. Company Overview (HQ, Business Segments, Employee Strength)
14.2.1.2. Financial Overview
14.2.1.3. SWOT Analysis
14.2.1.4. Strategic Overview
14.2.2. DJO Global, Inc.
14.2.2.1. Company Overview (HQ, Business Segments, Employee Strength)
14.2.2.2. Financial Overview
14.2.2.3. SWOT Analysis
14.2.2.4. Strategic Overview
14.2.3. Fillauer LLC
14.2.3.1. Company Overview (HQ, Business Segments, Employee Strength)
14.2.3.2. SWOT Analysis
14.2.3.3. Strategic Overview
14.2.4. Ottobock SE & Co. KGaA (Ottobock Holding)
14.2.4.1. Company Overview (HQ, Business Segments, Employee Strength)
14.2.4.2. SWOT Analysis
14.2.4.3. Strategic Overview
14.2.5. Bauerfeind AG
14.2.5.1. Company Overview (HQ, Business Segments, Employee Strength)
14.2.5.2. Financial Overview
14.2.5.3. SWOT Analysis
14.2.5.4. Strategic Overview
14.2.6. Össur Corporate
14.2.6.1. Company Overview (HQ, Business Segments, Employee Strength)
14.2.6.2. SWOT Analysis
14.2.6.3. Strategic Overview
14.2.7. BSN medical
14.2.7.1. Company Overview (HQ, Business Segments, Employee Strength)
14.2.7.2. SWOT Analysis
14.2.7.3. Strategic Overview
14.2.8. Breg, Inc.
14.2.8.1. Company Overview (HQ, Business Segments, Employee Strength)
14.2.8.2. SWOT Analysis
14.2.8.3. Strategic Overview
14.2.9. DeRoyal Industries, Inc.
14.2.9.1. Company Overview (HQ, Business Segments, Employee Strength)
14.2.9.2. SWOT Analysis
14.2.9.3. Strategic Overview
List of Tables
Table 01 Number of Surgeries, by Major Region, 2016 or later
Table 02 Percentages By Major Types Of Foot And Ankle Problems in the U.S. Population
Table 03 Global Lower Extremity Post-operative Orthotics Market Size (US$ Mn) Forecast, by Application, 2019–2027
Table 04 Global Lower Extremity Post-operative Orthotics Market Size (US$ Mn) Forecast, by Distribution Channel, 2019–2027
Table 05 Global Lower Extremity Post-operative Orthotics Market Size (US$ Mn) Forecast, by Region, 2019–2027
Table 06 North America Lower Extremity Post-operative Orthotics Market Size (US$ Mn) Forecast, by Application, 2019–2027
Table 07 North America Lower Extremity Post-operative Orthotics Market Size (US$ Mn) Forecast, by Distribution Channel, 2019–2027
Table 08 North America Lower Extremity Post-operative Orthotics Market Size (US$ Mn) Forecast, by Country, 2019–2027
Table 09 Europe Lower Extremity Post-operative Orthotics Market Size (US$ Mn) Forecast, by Application, 2019–2027
Table 10 Europe Lower Extremity Post-operative Orthotics Market Size (US$ Mn) Forecast, by Distribution Channel, 2019–2027
Table 11 Europe Lower Extremity Post-operative Orthotics Market Size (US$ Mn) Forecast, by Country/Sub-region, 2019–2027
Table 12 Asia Pacific Lower Extremity Post-operative Orthotics Market Size (US$ Mn) Forecast, by Application, 2019–2027
Table 13 Asia Pacific Lower Extremity Post-operative Orthotics Market Size (US$ Mn) Forecast, by Distribution Channel, 2019–2027
Table 14 Asia Pacific Lower Extremity Post-operative Orthotics Market Size (US$ Mn) Forecast, by Country/Sub-region, 2019–2027
Table 15 Latin America Lower Extremity Post-operative Orthotics Market Size (US$ Mn) Forecast, by Application, 2019–2027
Table 16 Latin America Lower Extremity Post-operative Orthotics Market Size (US$ Mn) Forecast, by Distribution Channel, 2019–2027
Table 17 Latin America Lower Extremity Post-operative Orthotics Market Size (US$ Mn) Forecast, by Country/Sub-region, 2019–2027
Table 18 Middle East & Africa Lower Extremity Post-operative Orthotics Market Size (US$ Mn) Forecast, by Application, 2019–2027
Table 19 Middle East & Africa Lower Extremity Post-operative Orthotics Market Size (US$ Mn) Forecast, by Distribution Channel, 2019–2027
Table 20 Middle East & Africa Lower Extremity Post-operative Orthotics Market Size (US$ Mn) Forecast, by Country/Sub-region, 2019–2027
Table 21 DJO Global, Inc. Business Overview
Table 22 DJO Global, Inc. Product Offerings
Table 23 Fillauer LLC Business Overview
Table 24 Fillauer LLC Product Offerings
Table 25 Ossur Corporate Business Overview
Table 26 Hanger, Inc. Business Overview
Table 27 Bauerfeind AG Products Offered
Table 28 Ottobock SE & Co. KGaA Business Overview
Table 29 Breg, Inc. Business Overview
Table 30 Breg, Inc. Product Offerings
Table 31 BSN Medical Business Overview
Table 32 DeRoyal Industries, Inc. Business Overview
List of Figures
Figure 01 Global Market Size, by Application (US$ Mn), 2018
Figure 02 Global Lower Extremity Post-operative Orthotics Market Snapshot
Figure 03 Global Lower Extremity Post-operative Orthotics Market Share, by Distribution Channel, 2018
Figure 04 Market Share Analysis, by Region, 2018
Figure 05 Market Outlook, by Region
Figure 06 Lower Extremity Post-operative Orthotics Market Taxonomy
Figure 07 Global lower extremity Post-operative Orthotics Market Size (US$ Mn) Forecast, 2017–2027
Figure 08 Market Value Share, by Application, 2018
Figure 09 Market Value Share, by Distribution Channel, 2018
Figure 10 Market Value Share, by Region, 2018
Figure 11 Types of Foot Surgery
Figure 12 Value Chain Analysis - Prosthetics & Orthotics Market
Figure 13 Global Lower Extremity Post-operative Orthotics Market Value Share Analysis, by Application, 2018 And 2027
Figure 14 Global Lower Extremity Post-operative Orthotics Market Revenue (US$ Mn) And Y-o-y Growth (%), by Foot Fracture Repair & Restoration, 2017–2027
Figure 15 Global Lower Extremity Post-operative Orthotics Market Revenue (US$ Mn) And Y-o-y Growth (%), by Bunion Removal Surgery, 2017–2027
Figure 16 Global Lower Extremity Post-operative Orthotics Market Revenue (US$ Mn) And Y-o-y Growth (%), by Heel Spur Surgery, 2017–2027
Figure 17 Global Lower Extremity Post-operative Orthotics Market Revenue (US$ Mn) And Y-o-y Growth (%), by Others, 2017–2027
Figure 18 Global Lower Extremity Post-operative Orthotics Market Attractiveness Analysis, by Application, 2019–2027
Figure 19 Global Lower Extremity Post-operative Orthotics Market Value Share Analysis, by Distribution Channel, 2018 And 2027
Figure 20 Global Lower Extremity Post-operative Orthotics Market Revenue (US$ Mn) And Y-o-y Growth (%), by Hospital Pharmacies, 2017–2027
Figure 21 Global Lower Extremity Post-operative Orthotics Market Revenue (US$ Mn) And Y-o-y Growth (%), by Retail Pharmacies, 2017–2027
Figure 22 Global Lower Extremity Post-operative Orthotics Market Revenue (US$ Mn) And Y-o-y Growth (%), by Others, 2017–2027
Figure 23 Global Lower Extremity Post-operative Orthotics Market Attractiveness Analysis, by Distribution Channel, 2019–2027
Figure 24 Global Lower Extremity Post-operative Orthotics Market Value Share Analysis, by Region, 2018 And 2027
Figure 25 Global Lower Extremity Post-operative Orthotics Market Attractiveness Analysis, by Region, 2019–2027
Figure 26 North America Lower Extremity Post-operative Orthotics Market Size (US$ Mn) Forecast, 2019–2027
Figure 27 North America Market Attractiveness Analysis, by Country, 2019–2027
Figure 28 North America Lower Extremity Post-operative Orthotics Market Value Share Analysis, by Application, 2018 and 2027
Figure 29 North America Lower Extremity Post-operative Orthotics Market Value Share Analysis, by Distribution Channel, 2018 and 2027
Figure 30 North America Lower Extremity Post-operative Orthotics Market Value Share Analysis, by Country, 2018 and 2027
Figure 31 North America Lower Extremity Post-operative Orthotics Market Attractiveness Analysis, by Application, 2019–2027
Figure 32 North America Lower Extremity Post-operative Orthotics Market Attractiveness Analysis, by Distribution Channel, 2019–2027
Figure 33 Europe Lower Extremity Post-operative Orthotics Market Size (US$ Mn) Forecast, 2019–2027
Figure 34 Europe Market Attractiveness Analysis, by Country/Sub-region, 2019–2027
Figure 35 Europe Lower Extremity Post-operative Orthotics Market Value Share Analysis, by Application, 2018 and 2027
Figure 36 Europe Lower Extremity Post-operative Orthotics Market Value Share Analysis, by Distribution Channel, 2018 and 2027
Figure 37 Europe Lower Extremity Post-operative Orthotics Market Value Share Analysis, by Country/Sub-region, 2018 and 2027
Figure 38 Europe Lower Extremity Post-operative Orthotics Market Attractiveness Analysis, by Application, 2019–2027
Figure 39 Europe Lower Extremity Post-operative Orthotics Market Attractiveness Analysis, by Distribution Channel, 2019–2027
Figure 40 Asia Pacific Lower Extremity Post-operative Orthotics Market Size (US$ Mn) Forecast, 2019–2027
Figure 41 Asia Pacific Market Attractiveness Analysis, by Country/Sub-region, 2019–2027
Figure 42 Asia Pacific Lower Extremity Post-operative Orthotics Market Value Share Analysis, by Application, 2018 and 2027
Figure 43 Asia Pacific Lower Extremity Post-operative Orthotics Market Value Share Analysis, by Distribution Channel, 2018 and 2027
Figure 44 Asia Pacific Lower Extremity Post-operative Orthotics Market Value Share Analysis, by Country/Sub-region, 2018 and 2027
Figure 45 Asia Pacific Lower Extremity Post-operative Orthotics Market Attractiveness Analysis, by Application, 2019–2027
Figure 46 Asia Pacific Lower Extremity Post-operative Orthotics Market Attractiveness Analysis, by Distribution Channel, 2019–2027
Figure 47 Latin America Lower Extremity Post-operative Orthotics Market Size (US$ Mn) Forecast, 2019–2027
Figure 48 Latin America Market Attractiveness Analysis, by Country/Sub-region, 2019–2027
Figure 49 Latin America Lower Extremity Post-operative Orthotics Market Value Share Analysis, by Application, 2018 and 2027
Figure 50 Latin America Lower Extremity Post-operative Orthotics Market Value Share Analysis, by Distribution Channel, 2018 and 2027
Figure 51 Latin America Lower Extremity Post-operative Orthotics Market Value Share Analysis, by Country/Sub-region, 2018 and 2027
Figure 52 Latin America Lower Extremity Post-operative Orthotics Market Attractiveness Analysis, by Treatment, 2019–2027
Figure 53 Latin America Lower Extremity Post-operative Orthotics Market Attractiveness Analysis, by Distribution Channel, 2019–2027
Figure 54 Middle East & Africa Lower Extremity Post-operative Orthotics Market Size (US$ Mn) Forecast, 2019–2027
Figure 55 Middle East & Africa Market Attractiveness Analysis, by Country/Sub-region, 2019–2027
Figure 56 Middle East & Africa Lower Extremity Post-operative Orthotics Market Value Share Analysis, by Application, 2018 and 2027
Figure 57 Middle East & Africa Lower Extremity Post-operative Orthotics Market Value Share Analysis, by Distribution Channel, 2018 and 2027
Figure 58 Middle East & Africa Lower Extremity Post-operative Orthotics Market Value Share Analysis, by Country/Sub-region, 2018 and 2027
Figure 59 Middle East & Africa Lower Extremity Post-operative Orthotics Market Attractiveness Analysis, by Application, 2019–2027
Figure 60 Middle East & Africa Lower Extremity Post-operative Orthotics Market Attractiveness Analysis, by Distribution Channel, 2019–2027
Figure 61 DJO Global, Inc., Revenue (US$ Mn) and Y-o-Y Growth (%), 2014–2017
Figure 62 DJO Global, Inc. Breakdown of Net Sales (%), by Region, 2017
Figure 63 DJO Global, Inc., Research & Development (US$ Mn) - Company Level, 2015–2017
Figure 64 DJO Global, Inc. Breakdown of Net Sales (%), by Orthopedics Business Segment, 2017
Figure 65 Ossur Corporate Revenue (US$ Mn) and Y-o-Y Growth (%), 2015–2018
Figure 66 Ossur Corporate Breakdown of Sales (%), by Business Segment, 2018
Figure 67 Ossur Corporate Breakdown of Sales (%), by Region, 2018
Figure 68 Hanger, Inc. Revenue (US$ Mn) and Y-o-Y Growth (%), 2015–2018
Figure 69 Hanger, Inc. Material Cost (US$ Mn) - Company Level, 2015–2018
Figure 70 Hanger, Inc. Operation Cost (US$ Mn) - Company Level, 2015–2018
Figure 71 Hanger, Inc. Breakdown of Net Revenue (%), by Business Segment, 2018
Copyright © Transparency Market Research, Inc. All Rights reserved
Trust Online

Lower Extremity Post-operative Orthotics Market