
Reports
Reports
The relentless profitability pressures imposed on today’s finance sector have been triggering various banking organizations and specialty finance companies to integrate next-generation technologies with their liquidity asset liability management operations. In addition, as poor liquidity risk management systems can cost a company a fortune, it is further strengthening the need for applying technological advancements in liquidity asset liability management solutions to incur a significant rise in profitability.
With a mounting number of financial institutions undertaking a rigorous approach while dealing with risk management demands, the liquidity asset liability management solutions market in rapidly moving towards a smarter future. The growing adoption of cutting-edge technologies such as Artificial Intelligence (AI) and machine learning for predictive analytics is shaping the emerging trends in this landscape, underscoring the importance of technological integration into liquidity asset liability management solutions.
Transparency Market Research’s recent study examines the factors that are catalyzing technological transformations in the liquidity asset liability management solutions market, to project how the future will look for this landscape. This study offers value-based and actionable insights about the growth prospects of the market, for stakeholders to make more informed liquidity asset liability management-related decisions.
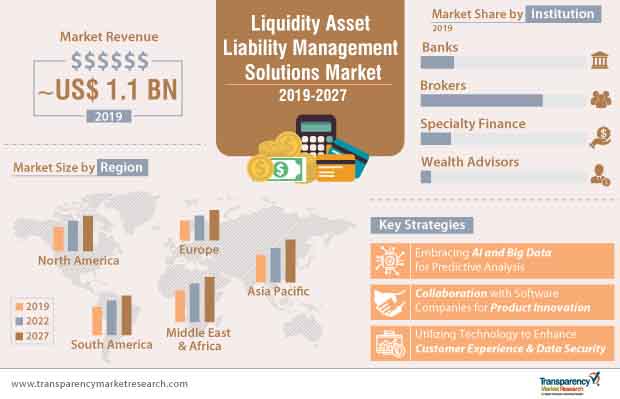
Financial institutions are showing inclination towards employing AI to understand their clients, ensure compliance, improve analytics, and produce better forecasts based on existing data. Eventually, leading players in the liquidity asset liability management solutions landscape are streamlining their business strategies to stay resilient and withstand potential technological disruptions in the industry, even as new competitors crowd the scene. Being a popular technology with guaranteed returns on investment, the application of AI in the liquidity asset liability management solutions landscape is expected to emerge as a winning strategy for stakeholders in the coming years.
Analytics in the liquidity asset liability management solutions market entails huge volumes of data that is complex, and Big Data technology has reshaped the finance sector with improved metrics for cognitive processing and forecasting. Stakeholders in the industry are likely to focus on employing Big Data for accurate results at each step. The integration of Big Data technology into liquidity asset liability management solutions will lead them to achieving faster results, which, in turn, will allow for newer risks to be uncovered.
Increasing growth of the liquidity asset liability management solutions landscape is mainly triggered by the growing volume of transactions and burgeoning need for risk management solutions. With the rise in the number of financial transactions taking place, both, online and offline, there is the heightened need to manage risk and maintain an acceptable profitability level of various financial transactions for various banking organizations.
Leading banking institutions are adopting technologically-advanced liquidity asset liability management solutions to ensure the efficient and coordinated management of sensitive banking operations with a rapidly multiplying number of individuals with at least one bank account or an account with a mobile money provider.
The global market for liquidity asset liability management solutions landed a valuation of ~ US$ 1 billion in 2018, and is expected to witness 4.5% year-over-year growth in 2019. While the market is likely to witness healthy growth in the coming years, the implementation of strict regulations and stringent norms adds to the shareholder pressures of increased margin and reduced returns. Tightening regulations in the finance sector are making the structure of the businesses of financial institutions more complex, creating numerous challenges in developing apt liquidity asset liability management solutions that can suit their specific requirements.
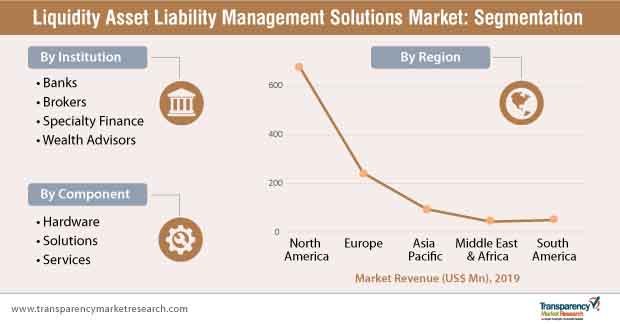
With the advantage of being a strong economy and by virtue of being the first adopters of technology, North America is currently a prominent region in the liquidity asset liability management solutions market. This is set to remain so, with the United States keeping its position, while the positive growth prospects of the European finance industry are expected to create new opportunities for stakeholders in its liquidity asset liability management solutions market. Despite an upsurge in financial activities in Asia Pacific, especially in India and China, which are supporting the liquidity asset liability management solutions market in this region, developed regions are creating more lucrative avenues of growth for market players.
Considering the changing consumer experiences due to the proliferation of technology, and the security concerns that go hand in hand, business strategies that focus on high-tech security protocols in tech-driven asset liability management solutions can fetch profits in developed markets. The adoption of hardware-based solutions for liquidity asset liability management is plummeting rapidly, as end users turn toward software-based solutions to sync with the growing digitalization in the finance sector. Seeking high value growth opportunities, mainly in developed regions, stakeholders are employing strategies to strengthen the presence of their companies by not only expanding their product portfolios but also increasing their customer data base and strengthening their long-term business strategies.
There is a growing trend among key players of strategically acquiring smaller firms that offer technological solutions, giving them a competitive edge to consolidate their global presence. Leading players in the market are partnering with software companies as well as financial organizations to co-innovate high quality solutions and services to expand their presence in developing countries. For instance, Fidelity National Information Services, Inc. (FIS) recently announced that it formed a joint venture with Banco Bradesco, a leading Brazil-based bank, in order to provide financial services and solutions.
Within the liquidity asset liability management solutions market, customer retention continues to remain a priority. Wolters Kluwer – a leading stakeholder in the liquidity asset liability management solutions market – recently declared that ~78% of its revenue is recurring, as it gives customer satisfaction and retention immense importance throughout its race in this landscape. Leading companies in the market are likely to continue focusing on improving customer experience, which is expected to have a significant impact on the revenue and the stock value of their companies.
Authors of the TMR report on the liquidity asset liability management solutions market are of the opinion that, the techniques of asset liability have evolved with technology, and the need for strategies to reduce the risks in asset-liability management in a digitalized finance sector has surged.
Looking ahead, market players should expect increased regulations, and a direct impact of the constraints of these regulations. Stakeholders who increase focus, not only on the adoption of technologies for effective liquidity asset management, but also to keep in sync with the advancements in existing technologies, will survive the cut-throat competition in this landscape. Though the liquid asset liability management market is set to grow at a fast pace, high installation and integration costs are still holding back avenues of growth. Market players will have to concentrate on promoting added value and return on investment for end users to pave their way through these challenges in the liquidity asset liability management solutions market.
Global Liquidity Asset Liability Management Solutions Market: Overview
Rapid Increase in Financial Inclusion, Globally
Liquidity Asset Liability Management Solutions Market: Taxonomy
Liquidity Asset Liability Management Solutions Market: Regional Outlook
The report provides in-depth segment analysis of the global liquidity asset liability management solutions market, thereby providing valuable insights at macro as well as micro levels. Analysis of major countries that hold growth opportunities or account for significant shares has also been included as part of the geographic analysis for the liquidity asset liability management solutions market.
Liquidity Asset Liability Management Solutions Market: Competition Dynamics
The research study includes profiles of leading companies operating in the global liquidity asset liability management solutions market.
Key players profiled in the report include
1. Preface
1.1. Market Scope
1.2. Market Segmentation
1.3. Key Research Objectives
2. Assumptions and Research Methodology
2.1. Report Assumptions
2.2. Acronyms
2.3. Research Methodology
3. Executive Summary : Global Liquidity Asset Liability Management Solutions Market
4. Market Overview
4.1. Introduction
4.2. Global Market – Macro Economic Factors Overview
4.2.1. World GDP Indicator – For Top 20 Economies
4.2.2. Key Regional Socio-political-technological Developments and Their Impact Considerations
4.3. Technology/Product Roadmap
4.4. Market Factor Analysis
4.4.1. Porter’s Five Forces Analysis
4.4.2. PESTLE Analysis
4.4.3. Value Chain Analysis
4.4.4. Market Dynamics (Growth Influencers)
4.4.4.1. Drivers
4.4.4.2. Restraints
4.4.4.3. Opportunities
4.5. Global Liquidity Asset Liability Management Solutions Market Analysis and Forecast, 2017 - 2027
4.5.1. Market Revenue Analysis (US$ Mn)
4.5.1.1. Historic Growth Trends, 2012-2018
4.5.1.2. Forecast trends, 2019-2027
4.6. Market Opportunity Assessment – By Region (Global/North America/Europe/Asia Pacific/Middle East & Africa/South America)
4.6.1. By Region/Country
4.6.2. By Component
4.6.3. By Institution Type
4.7. Market Outlook
5. Global Liquidity Asset Liability Management Solutions Market Analysis and Forecast, by Component
5.1. Overview and Definitions
5.2. Key Segment Analysis
5.3. Liquidity Asset Liability Management Solutions Market Size (US$ Mn) Forecast, by Component, 2017 - 2027
5.3.1. Hardware
5.3.2. Solution
5.3.3. Services
6. Global Liquidity Asset Liability Management Solutions Market Analysis and Forecast, by Institution Type
6.1. Overview and Definitions
6.2. Key Segment Analysis
6.3. Liquidity Asset Liability Management Solutions Market Size (US$ Mn) Forecast, by Institution Type, 2017 - 2027
6.3.1. Banks
6.3.2. Broker Dealers
6.3.3. Specialty Finance
6.3.4. Wealth Advisors
7. Global Liquidity Asset Liability Management Solutions Market Analysis and Forecast, by Region
7.1. Overview
7.2. Key Segment Analysis
7.3. Liquidity Asset Liability Management Solutions Market Size (US$ Mn) Forecast, by Region, 2017 - 2027
7.3.1. North America
7.3.2. Europe
7.3.3. Asia Pacific
7.3.4. Middle East & Africa
7.3.5. South America
8. North America Liquidity Asset Liability Management Solutions Market Analysis and Forecast
8.1.1. Overview & Analysis
8.1.2. Liquidity Asset Liability Management Solutions Market Size (US$ Mn) Forecast, by Component, 2017 - 2027
8.1.3. Hardware
8.1.4. Solution
8.1.5. Services
8.2. Liquidity Asset Liability Management Solutions Market Size (US$ Mn) Forecast, by Institution Type, 2017 - 2027
8.2.1. Banks
8.2.2. Broker Dealers
8.2.3. Specialty Finance
8.2.4. Wealth Advisors
8.3. Liquidity Asset Liability Management Solutions Market Size (US$ Mn) Forecast, by Country & Sub-region, 2017 - 2027
8.3.1. The U.S.
8.3.2. Canada
8.3.3. Rest of North America
9. Europe Liquidity Asset Liability Management Solutions Market Analysis and Forecast
9.1. Overview & Analysis
9.2. Liquidity Asset Liability Management Solutions Market Size (US$ Mn) Forecast, by Component, 2017 - 2027
9.2.1. Hardware
9.2.2. Solution
9.2.3. Services
9.3. Liquidity Asset Liability Management Solutions Market Size (US$ Mn) Forecast, by Institution Type, 2017 – 2027
9.3.1. Banks
9.3.2. Broker Dealers
9.3.3. Specialty Finance
9.3.4. Wealth Advisors
9.4. Liquidity Asset Liability Management Solutions Market Size (US$ Mn) Forecast, by Country & Sub-region, 2017 - 2027
9.4.1. Germany
9.4.2. France
9.4.3. UK
9.4.4. Spain
9.4.5. Rest of Europe
10. Asia Pacific Liquidity Asset Liability Management Solutions Market Analysis and Forecast
10.1. Overview & Analysis
10.2. Liquidity Asset Liability Management Solutions Market Size (US$ Mn) Forecast, by Component, 2017 - 2027
10.2.1. Hardware
10.2.2. Solution
10.2.3. Services
10.3. Liquidity Asset Liability Management Solutions Market Size (US$ Mn) Forecast, by Institution Type, 2017 - 2027
10.3.1. Banks
10.3.2. Broker Dealers
10.3.3. Specialty Finance
10.3.4. Wealth Advisors
10.4. Liquidity Asset Liability Management Solutions Market Size (US$ Mn) Forecast, by Country & Sub-region, 2017 - 2027
10.4.1. China
10.4.2. Japan
10.4.3. India
10.4.4. Australia
10.4.5. Rest of Asia Pacific
11. Middle East & Africa Liquidity Asset Liability Management Solutions Market Analysis and Forecast
11.1. Overview & Analysis
11.2. Liquidity Asset Liability Management Solutions Market Size (US$ Mn) Forecast, by Component, 2017 - 2027
11.2.1. Hardware
11.2.2. Solution
11.2.3. Services
11.3. Liquidity Asset Liability Management Solutions Market Size (US$ Mn) Forecast, by Institution Type, 2017 - 2027
11.3.1. Banks
11.3.2. Broker Dealers
11.3.3. Specialty Finance
11.3.4. Wealth Advisors
11.4. Liquidity Asset Liability Management Solutions Market Size (US$ Mn) Forecast, by Country & Sub-region, 2017 – 2027
11.4.1. GCC
11.4.2. Rest of Middle East & Africa
12. South America Liquidity Asset Liability Management Solutions Market Analysis and Forecast
12.1. Overview & Analysis
12.2. Liquidity Asset Liability Management Solutions Market Size (US$ Mn) Forecast, by Component, 2017 - 2027
12.2.1. Hardware
12.2.2. Solution
12.2.3. Services
12.3. Liquidity Asset Liability Management Solutions Market Size (US$ Mn) Forecast, by Institution Type, 2017 - 2027
12.3.1. Banks
12.3.2. Broker Dealers
12.3.3. Specialty Finance
12.3.4. Wealth Advisors
12.4. Liquidity Asset Liability Management Solutions Market Size (US$ Mn) Forecast, by Country & Sub-region, 2017 - 2027
12.4.1. Brazil
12.4.2. Rest of South America
13. Competition Landscape
13.1. Liquidity Asset Liability Management Solutions Market Competition Structure Analysis, 2018
13.2. Market Player – Regional Presence Intensity Map
14. Company Profiles(Details – Basic Overview, Geographical Presence, Revenue, Strategy)
14.1. Fidelity National Information Services, Inc.
14.1.1. Overview
14.1.2. Product Portfolio
14.1.3. Revenue
14.1.4. Key Developments
14.1.5. Strategic Overview
14.2. Finastra
14.2.1. Overview
14.2.2. Product Portfolio
14.2.3. Revenue
14.2.4. Key Developments
14.2.5. Strategic Overview
14.3. Fiserv, Inc
14.3.1. Overview
14.3.2. Product Portfolio
14.3.3. Revenue
14.3.4. Key Developments
14.3.5. Strategic Overview
14.4. Infosys Limited
14.4.1. Overview
14.4.2. Product Portfolio
14.4.3. Revenue
14.4.4. Key Developments
14.4.5. Strategic Overview
14.5. International Business Machines Corporation
14.5.1. Overview
14.5.2. Product Portfolio
14.5.3. Revenue
14.5.4. Key Developments
14.5.5. Strategic Overview
14.6. Moody's Corporation
14.6.1. Overview
14.6.2. Product Portfolio
14.6.3. Revenue
14.6.4. Key Developments
14.6.5. Strategic Overview
14.7. Oracle Corporation
14.7.1. Overview
14.7.2. Product Portfolio
14.7.3. Revenue
14.7.4. Key Developments
14.7.5. Strategic Overview
14.8. Polaris Financial Technology Limited
14.8.1. Overview
14.8.2. Product Portfolio
14.8.3. Revenue
14.8.4. Key Developments
14.8.5. Strategic Overview
14.9. SAP SE
14.9.1. Overview
14.9.2. Product Portfolio
14.9.3. Revenue
14.9.4. Key Developments
14.9.5. Strategic Overview
14.10. Wolters Kluwer N.V.
14.10.1. Overview
14.10.2. Product Portfolio
14.10.3. Revenue
14.10.4. Key Developments
14.10.5. Strategic Overview
14.11. Key Takeaways
List of Tables
Table 1: North America ICT Spending (US$ Mn)
Table 2: Europe ICT Spending (US$ Mn)
Table 3: Asia Pacific ICT Spending (US$ Mn)
Table 4: MEA ICT Spending (US$ Mn)
Table 5: South America ICT Spending (US$ Mn)
Table 6: List of Emerging, Prominent and Leading Players
Table 7: Mergers & Acquisitions, Expansions
Table 8: Global Liquidity Asset Liability Management Solutions Market Revenue (US$ Mn) Forecast, by Component, 2017 - 2027
Table 9: Global Liquidity Asset Liability Management Solutions Market Revenue (US$ Mn) Forecast, by Institution Type, 2017 - 2027
Table 10: Global Liquidity Asset Liability Management Solutions Market Revenue (US$ Mn) Forecast, by Region, 2017 - 2027
Table 11: North America - Impact Analysis of Drivers and Restraints
Table 12: North America Liquidity Asset Liability Management Solutions Market Revenue (US$ Mn) Forecast, by Component, 2017 - 2027
Table 13: North America Liquidity Asset Liability Management Solutions Market Revenue (US$ Mn) Forecast, by Institution Type, 2017 - 2027
Table 14: North America Liquidity Asset Liability Management Solutions Market Revenue (US$ Mn) Forecast, by Country, 2017 - 2027
Table 15: Europe - Impact Analysis of Drivers and Restraints
Table 16: Europe Liquidity Asset Liability Management Solutions Market Revenue (US$ Mn) Forecast, by Component, 2017 - 2027
Table 17: Europe Liquidity Asset Liability Management Solutions Market Revenue (US$ Mn) Forecast, by Institution Type, 2017 - 2027
Table 18: Europe Liquidity Asset Liability Management Solutions Market Revenue (US$ Mn) Forecast, by Country, 2017 - 2027
Table 19: Asia Pacific - Impact Analysis of Drivers and Restraints
Table 20: Asia Pacific Liquidity Asset Liability Management Solutions Market Revenue (US$ Mn) Forecast, by Component, 2017 - 2027
Table 21: Asia Pacific Liquidity Asset Liability Management Solutions Market Revenue (US$ Mn) Forecast, by Institution Type, 2017 - 2027
Table 22: Asia Pacific Liquidity Asset Liability Management Solutions Market Revenue (US$ Mn) Forecast, by Country, 2017 - 2027
Table 23: Middle East & Africa - Impact Analysis of Drivers and Restraints
Table 24: Middle East & Africa Liquidity Asset Liability Management Solutions Market Revenue (US$ Mn) Forecast, by Component, 2017 - 2027
Table 25: Middle East & Africa Liquidity Asset Liability Management Solutions Market Revenue (US$ Mn) Forecast, by Institution Type, 2017 - 2027
Table 26: Middle East & Africa Liquidity Asset Liability Management Solutions Market Revenue (US$ Mn) Forecast, by Country, 2017 - 2027
Table 27: South America - Impact Analysis of Drivers and Restraints
Table 28: South America Liquidity Asset Liability Management Solutions Market Revenue (US$ Mn) Forecast, by Component, 2017 - 2027
Table 29: South America Liquidity Asset Liability Management Solutions Market Revenue (US$ Mn) Forecast, by Institution Type, 2017 - 2027
Table 30: South America Liquidity Asset Liability Management Solutions Market Revenue (US$ Mn) Forecast, by Country, 2017 - 2027
Table 31: Business Segments - IBM Corporation
Table 32: Business Segments - Capgemini SE
Table 33: Business Segments - Fidelity National Information Services, Inc.,
Table 34: Business Segments - Infosys Limited
Table 35: Business Segments - Oracle Corporation
Table 36: Business Segments - SAP SE
List of Figures
Figure 1: Market Segmentation
Figure 2: Research Methodology
Figure 3: Global Liquidity Asset Liability Management Solutions Market Size (US$ Mn) Forecast, 2017–2027
Figure 4: Global Top 3 Regions, Market Share Analysis, 2019 & 2027 (%)
Figure 5: Global Top 5 Countries – CAGR (2018-2027) Analysis
Figure 6: Global Top 2 Component Market Share Analysis, 2027
Figure 7: Global Top 2 Institution Type Market Share Analysis, 2027
Figure 8: GDP (US$ Bn), Top Economies 2017)
Figure 9: Top Economies GDP Landscape
Figure 10: Gross Domestic Product (GDP) Analysis By Major Countries, 2017
Figure 11: ICT Spending (US$ Mn) Trend
Figure 12: Product/ Technology Roadmap
Figure 13: Porter’s Five Forces Analysis
Figure 14: PESTEL Analysis
Figure 15: Value Chain Analysis
Figure 16: Impact Analysis of Drivers & Restraints
Figure 17: Global Liquidity Asset Liability Management Solutions Market Size (US$ Mn) and Forecast, 2017 – 2027
Figure 18: Global Liquidity Asset Liability Management Solutions Market Opportunity Analysis, 2017 – 2027
Figure 19: Global Liquidity Asset Liability Management Solutions Market Opportunity Assessment, by Component, (2019)
Figure 20: Global Liquidity Asset Liability Management Solutions Market Opportunity Assessment, by Institution Type, (2019)
Figure 21: Global Liquidity Asset Liability Management Solutions Market Opportunity Assessment, by Region, (2019)
Figure 22: Liquidity Asset Liability Management Solutions Market Concentration Rate
Figure 23: Market Outlook
Figure 24: Global Liquidity Asset Liability Management Solutions Market Share Analysis, by Component, 2019 & 2027
Figure 25: Global Liquidity Asset Liability Management Solutions Market Share Analysis, by Institution Type, 2019 & 2027
Figure 26: Global Liquidity Asset Liability Management Solutions Market Share Analysis, by Region, 2019 &2027
Figure 27: Key Findings
Figure 28: North America Liquidity Asset Liability Management Solutions Market Size (US$ Mn) and Forecast, 2017 – 2027
Figure 29: North America Liquidity Asset Liability Management Solutions Market Opportunity Analysis, 2017 – 2027
Figure 30: North America Liquidity Asset Liability Management Solutions Market Share Analysis, by Component, 2019 & 2027
Figure 31: North America Liquidity Asset Liability Management Solutions Market Share Analysis, by Institution Type, 2019 & 2027
Figure 32: North America Liquidity Asset Liability Management Solutions Market Share Analysis, by Country, 2019 & 2027
Figure 33: Key Findings
Figure 34: Europe Liquidity Asset Liability Management Solutions Market Size (US$ Mn) and Forecast, 2017 – 2027
Figure 35: Europe Liquidity Asset Liability Management Solutions Market Opportunity Analysis, 2017 – 2027
Figure 36: Europe Liquidity Asset Liability Management Solutions Market Share Analysis, by Component, 2019 & 2027
Figure 37: Europe Liquidity Asset Liability Management Solutions Market Share Analysis, by Institution Type, 2019 & 2027
Figure 38: Europe Liquidity Asset Liability Management Solutions Market Share Analysis, by Country, 2019 & 2027
Figure 39: Key Findings
Figure 40: Asia Pacific Liquidity Asset Liability Management Solutions Market Size (US$ Mn) and Forecast, 2017 – 2027
Figure 41: Asia Pacific Liquidity Asset Liability Management Solutions Market Opportunity Analysis, 2017 – 2027
Figure 42: Asia Pacific Liquidity Asset Liability Management Solutions Market Share Analysis, by Component, 2019 & 2027
Figure 43: Asia Pacific Liquidity Asset Liability Management Solutions Market Share Analysis, by Institution Type, 2019 & 2027
Figure 44: Asia Pacific Liquidity Asset Liability Management Solutions Market Share Analysis, by Country, 2019 & 2027
Figure 45: Key Findings
Figure 46: Middle East & Africa Liquidity Asset Liability Management Solutions Market Size (US$ Mn) and Forecast, 2017 – 2027
Figure 47: Middle East & Africa Liquidity Asset Liability Management Solutions Market Opportunity Analysis, 2017 – 2027
Figure 48: Middle East & Africa Liquidity Asset Liability Management Solutions Market Share Analysis, by Component, 2019 & 2027
Figure 49: Middle East & Africa Liquidity Asset Liability Management Solutions Market Share Analysis, by Institution Type, 2019 & 2027
Figure 50: Middle East & Africa Liquidity Asset Liability Management Solutions Market Share Analysis, by Country, 2019 & 2027
Figure 51: Key Findings
Figure 52: South America Liquidity Asset Liability Management Solutions Market Size (US$ Mn) and Forecast, 2017 – 2027
Figure 53: South America Liquidity Asset Liability Management Solutions Market Opportunity Analysis, 2017 – 2027
Figure 54: South America Liquidity Asset Liability Management Solutions Market Share Analysis, by Component, 2019 & 2027
Figure 55: South America Liquidity Asset Liability Management Solutions Market Share Analysis, by Institution Type, 2019 & 2027
Figure 56: South America Liquidity Asset Liability Management Solutions Market Share Analysis, by Country, 2019 & 2027
Figure 57: Market Player – Competition Matrix
Figure 58: Market Revenue Share Analysis (%), by Company (2018)
Figure 59: Revenue - IBM Corporation
Figure 60: Revenue - Capgemini SE
Figure 61: Revenue - Fidelity National Information Services, Inc.,
Figure 62: Revenue - Infosys Limited
Figure 63: Revenue - Oracle Corporation
Figure 64: Revenue - SAP SE
Copyright © Transparency Market Research, Inc. All Rights reserved
Trust Online

Liquidity Asset Liability Management Solutions Market