
Reports
Reports
Deployment in Multiple Applications Rise on Back of Attractive Performance Characteristics and Favorable Economics
The lead acid battery market has made continuous strides, fueled by the constantly rising deployment in multiple applications. The adoption of the battery system in energy management applications has grown tremendously over the past several decades. Businesses across the globe are fervently betting big on lead-acid battery as a cost-effective and high-performance energy storage solution. The use in a number of stationary applications such as smart-grid frequency regulation facilities and other critical backup applications is proliferating.
Ease of Transportation and Relative low Costs Makes Lead Acid Batteries Competitive with Other Battery Systems
The versatile use of lead acid battery is one of the major propositions behind the deployment of the technologies in the market. The choice of alloy and design advancements have been shaped by the changing energy requirements in these industries.
Players in the lead acid battery market have conducted extensive R&D on extending the life of these batteries and enhance their dynamic charge-acceptance. The launch of products with longer lifetimes and higher efficiencies has been invigorating interest in new materials and electrolytes as novel chemistries.
Proliferating Demand in Renewable Energy Storage Application Enriched Future Lead Acid Battery Market Outlook
The renewable energy sector has made some massive advancements, given the need to reduce the greenhouse gas emissions and the recurrent drive to meet lower carbon emissions. The trend has received a massive thrust in developing economies, and has nudged developed countries to extend financial support to make the transition. In all these, cost-effective secondary storage solutions attract groundswell of attention.
Lead acid battery technologies prove to be promising for smart energy storage solutions for smart grids. The ease of recyclability, simplicity of charging, and ease of transportation are propelling the revenue generation from the adoption of these in renewable energy storage applications.
Lead Acid Battery Likely to be Prominent Choice for Energy-Intensive Data Centers
The global lead acid battery market is projected to reach worth of US$ 79 Bn by 2025-end.
The demand has risen in data center infrastructures. The trend has created new revenue streams in emerging markets. Africa and ASEAN have been attractive markets. The explosion of internet-of-things (IoT) applications has led to spurt in demand for data centers to store volumes of data for use in various end-use industries. As a result, the prospects for the lead acid battery market in data centers is anticipated to rise at a promising growth rate during the forecast period.
Data centers are becoming power-hungry more than ever. Hence, the development of cost-efficient energy storage applications is expected to impart significant headwinds. This will open new frontiers for players in the lead acid battery market.
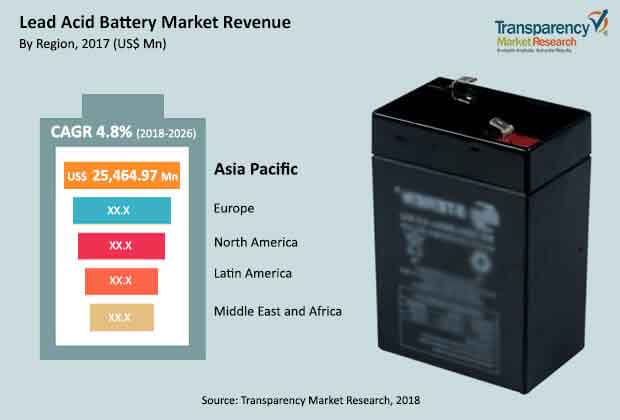
Automotive Sector Keeps Demand in Asia Pacific Market Buoyant
Asia Pacific held the major share of the global lead acid battery market in 2016. This was trailed by Europe and North America.
The strides made in automotive sector has played a large role in spurring the commercialization prospects of the Asia Pacific lead acid battery market. There has been substantial deployment of lead acid batteries in SLI (Starting, Lighting, and Ignition) batteries in automobiles.
New Designs & Safety Features to Chalk Future of Automotive Lead–Acid Battery Market
Advent of new lead acid battery designs has helped manufacturers in the lead acid battery market meet the evolving requirements in relation to maintenance, endurance, charge-acceptance, and cold crankability. Advanced designs have bolstered the use of lead acid battery in high-rate operation in the automotive applications. Lead acid battery for automotive sector will continue to make exciting strides ahead. This will be stridently fueled by the commercialization of maintenance-free lead acid batteries.
Manufacturers Commit Sizable Funds on Novel Energy Storage Materials
Various approaches have been tested and several of them are the key themes in ongoing research in energy storage applications. One of the key approaches is promoting the negative-plate charge and discharge processes. Another objective of manufacturers is reducing the degradation of positive electrode due to corrosion. Stridently, the lead acid battery market has witnessed the advent of new chemistries with longer lifetimes, essentially more charge/discharge cycles, and cycle life under 100% depth of discharge condition.
New Materials Enhance Cycle Life of Lead-acid Battery Find Applications in Electric Vehicles
A number of additives and alloys are being tested for developing and commercializing new chemistries in the lead acid battery market.
The relevant body of R&D activities has opened up new applications, particularly to meet the standards of new-age automotive. A prominent case in point is the need for battery technologies to meet various technical requirements for electric vehicles. Several studies have demonstrated activated carbon, carbon black, graphite, and carbon nanotubes to the negative active material (NAM) of the lead acid batteries to decrease premature failure of sulfation. This has resulted in prolonging the cycle life of batteries.
Graphene-enhanced Lead-Acid Batteries Attract Attention of Researchers
Use of graphene as an additive in the active mass of negative electrode in valve-regulated lead–acid batteries is attracting growing attention. At least three companies in China have tested the potential of this novel technology, leading to launch of graphene-enhanced lead-acid batteries.
Such product developments and launches in the lead acid battery market make the products competitive with respect to popular contemporary battery technologies. This is particularly with respect to lead acid batteries. The result was noticeable in performance of e-bike motive power VRLA batteries with respect to 100% depth-of-discharge cycle, notably in low ambient temperature.
Application of PV Cells Shows Game-changing Potential in Energy Storage Systems
In numerous countries, the demand in the lead acid battery market has been burgeoning on the back of production new solar photovoltaic systems. These are slated to attract industry investments from countries looking to modernize their energy storage systems and incorporate more renewables in the energy mix. Thus, the application of lead acid battery in PV cells has been growing at a rapid pace, adding momentum to the lead acid battery market.
Over the past few years, a number of new solar photovoltaic systems have been incorporated in renewables. One major motivation for this focus of utility companies and energy companies in reducing variability of renewable electricity sources. China and the U.S. have been at the forefront of these trends.
Industry Players Focus on Circumventing Environmental and Health Hazards
There are a few glaring challenges in the commercialization of lead acid battery market. Technological challenges are the primary bottlenecks, but not severe. This is because the market has been witnessing tailwinds due to advent of new battery chemistries. Significant loss in energy and power density at low ambient temperatures especially below 10 °C is creating hurdles. New electrochemical materials and other chemistries will help players circumvent these challenges.
But, perhaps a more serious problem is the environmental and health hazards posed by lead and lead oxides. Various international health and environmental standards have classified these as hazardous heavy metal materials. In particular, human skin is vulnerable to ill effects when it comes into contact with theses, and are especially sensitive to mucous membranes.
On the other hand, producers are keenly complying with better workplace standards to keep their workers safe in battery manufacturing plants.
Yet another contentious concern that has impeded the swift growth of the lead acid battery market is the absence of an adequate recycling infrastructure. Hence, policy makers in key markets such as in North America are taking efforts to close the loop between lead from recycled lead–acid batteries and the utilization of lead in manufacturing of these. New recycling concepts have emerged, thereby enriching the prospects of the lead acid battery market.
Some of the key players in the lead acid battery market are Trojan battery Company, Crown Battery Manufacturing Co., FIAMM Energy Technology S.p.A., East Penn Manufacturing Co., C&D Technologies, Inc., and HBL Power Systems Limited.
1. Preface
1.1. Market Definition and Scope
1.2. Market Segmentation
1.3. Key Research Objectives
1.4. Research Highlights
2. Assumptions and Research Methodology
3. Executive Summary : Global Lead Acid Battery Market
3.1. Global Lead Acid Battery Market Size, US$ Mn, Thousand Units, 2017-2026
4. Market Overview
4.1. Introduction
4.1.1. Lead Acid Battery Market Definition
4.1.2. Industry Developments
4.2. Key Market Indicators
4.3. Market Dynamics
4.3.1. Drivers
4.3.2. Restraints
4.3.3. Opportunity
4.4. Porter’s Five Force Analysis
4.5. Value Chain Analysis
4.5.1. List of Key Raw Material Suppliers
4.5.2. List of Key Manufacturers
4.5.3. List of Potential Customers
4.5.4. Level of Integration
4.6. Regulatory Scenario
4.7. SWOT Analysis
5. Global Lead Acid Battery Price Trend Analysis by Application, 2017-2026
6. Global Lead Acid Battery – Supply Demand Scenario, 2016
6.1. Overview
6.2. Global Import/Export Scenario (HS Code 850710)
7. Global Lead Acid Battery Market Analysis and Forecasts, by Product Type Segment
7.1. Introduction & Definition
7.2. Key Findings
7.3. Market Size (Thousand Units) (US$ Mn) Forecast by Product Type Segment, 2018-2026
7.3.1. Flooded
7.3.2. Sealed
7.3.2.1.AGM
7.3.2.2.Gel
7.4. Market Attractiveness By Product Type Segment
8. Global Lead Acid Battery Market Analysis and Forecasts, by Application Segment
8.1. Introduction & Definition
8.2. Key Findings
8.3. Market Size (Thousand Units) (US$ Mn) Forecast by Application Segment, 2018-2026
8.3.1. Automotive
8.3.2. Motor Cycles
8.3.3. Motive Power
8.3.4. Renewable Power
8.3.5. UPS & Telecom
8.3.6. Others (Wheel chair, etc.)
8.4. Market Attractiveness By Application Segment
9. Global Lead Acid Battery Market Analysis and Forecasts, by Region
9.1. Key Findings
9.2. Market Size (Thousand Units) (US$ Mn) Forecast by Region, 2018-2026
9.2.1. North America
9.2.2. Europe
9.2.3. Asia Pacific
9.2.4. Latin America
9.2.5. Middle East & Africa
9.3. Market Attractiveness By Region
10. North America Lead Acid Battery Market Size and Forecast (Thousand Units) (US$ Mn), 2018-2026
10.1. Key Findings
10.2. North America Market, by Product Type Segment
10.2.1. Flooded
10.2.2. Sealed
10.2.2.1.AGM
10.2.2.2.Gel
10.3. North America Market, by Application Segment
10.3.1. Automotive
10.3.2. Motor Cycles
10.3.3. Motive Power
10.3.4. Renewable Power
10.3.5. UPS & Telecom
10.3.6. Others (Wheel chair, etc.)
10.4. U.S. Market Size & Forecast by Product Type Segment
10.4.1. Flooded
10.4.2. Sealed
10.4.2.1.AGM
10.4.2.2.Gel
10.5. U.S. Market Size & Forecast by Application Segment
10.5.1. Automotive
10.5.2. Motor Cycles
10.5.3. Motive Power
10.5.4. Renewable Power
10.5.5. UPS & Telecom
10.5.6. Others (Wheel chair, etc.)
10.6. Canada Market Size & Forecast by Product Type Segment
10.6.1. Flooded
10.6.2. Sealed
10.6.2.1.AGM
10.6.2.2.Gel
10.7. Canada Market Size & Forecast by Application Segment
10.7.1. Automotive
10.7.2. Motor Cycles
10.7.3. Motive Power
10.7.4. Renewable Power
10.7.5. UPS & Telecom
10.7.6. Others (Wheel chair, etc.)
11.Europe Lead Acid Battery Market Size and Forecast (Thousand Units) (US$ Mn), 2018-2026
11.1. Key Findings
11.2. Europe Market, by Product Type Segment
11.2.1. Flooded
11.2.2. Sealed
11.2.2.1.AGM
11.2.2.2.Gel
11.3. Europe Market, by Application Segment
11.3.1. Automotive
11.3.2. Motor Cycles
11.3.3. Motive Power
11.3.4. Renewable Power
11.3.5. UPS & Telecom
11.3.6. Others (Wheel chair, etc.)
11.4. Germany Market Size & Forecast by Product Type Segment
11.4.1. Flooded
11.4.2. Sealed
11.4.2.1. AGM
11.4.2.2. Gel
11.5. Germany Market Size & Forecast by Application Segment
11.5.1. Automotive
11.5.2. Motor Cycles
11.5.3. Motive Power
11.5.4. Renewable Power
11.5.5. UPS & Telecom
11.5.6. Others (Wheel chair, etc.)
11.6. France Market Size & Forecast by Product Type Segment
11.6.1. Flooded
11.6.2. Sealed
11.6.2.1.AGM
11.6.2.2.Gel
11.7. France Market Size & Forecast by Application Segment
11.7.1. Automotive
11.7.2. Motor Cycles
11.7.3. Motive Power
11.7.4. Renewable Power
11.7.5. UPS & Telecom
11.7.6. Others (Wheel chair, etc.)
11.8. U.K. Market Size & Forecast by Product Type Segment
11.8.1. Flooded
11.8.2. Sealed
11.8.2.1. AGM
11.8.2.2. Gel
11.9. U.K. Market Size & Forecast by Application Segment
11.9.1. Automotive
11.9.2. Motor Cycles
11.9.3. Motive Power
11.9.4. Renewable Power
11.9.5. UPS & Telecom
11.9.6. Others (Wheel chair, etc.)
11.10. Spain Market Size & Forecast by Product Type Segment
11.10.1. Flooded
11.10.2. Sealed
11.10.2.1. AGM
11.10.2.2. Gel
11.11. Spain Market Size & Forecast by Application Segment
11.11.1. Automotive
11.11.2. Motor Cycles
11.11.3. Motive Power
11.11.4. Renewable Power
11.11.5. UPS & Telecom
11.11.6. Others (Wheel chair, etc.)
11.12. Italy Market Size & Forecast by Product Type Segment
11.12.1. Flooded
11.12.2. Sealed
11.12.2.1. AGM
11.12.2.2. Gel
11.13. Italy Market Size & Forecast by Application Segment
11.13.1. Automotive
11.13.2. Motor Cycles
11.13.3. Motive Power
11.13.4. Renewable Power
11.13.5. UPS & Telecom
11.13.6. Others (Wheel chair, etc.)
11.14. Russia & CIS Market Size & Forecast by Product Type Segment
11.14.1. Flooded
11.14.2. Sealed
11.14.2.1.AGM
11.14.2.2.Gel
11.15. Russia & CIS Market Size & Forecast by Application Segment
11.15.1. Automotive
11.15.2. Motor Cycles
11.15.3. Motive Power
11.15.4. Renewable Power
11.15.5. UPS & Telecom
11.15.6. Others (Wheel chair, etc.)
11.16. Rest of Europe Market Size & Forecast by Product Type Segment
11.16.1. Flooded
11.16.2. Sealed
11.16.2.1.AGM
11.16.2.2.Gel
11.17. Rest of Europe Market Size & Forecast by Application Segment
11.17.1. Automotive
11.17.2. Motor Cycles
11.17.3. Motive Power
11.17.4. Renewable Power
11.17.5. UPS & Telecom
11.17.6. Others (Wheel chair, etc.)
12. Asia Pacific Lead Acid Battery Market Size and Forecast (Thousand Units) (US$ Mn), 2018-2026
12.1. Key Findings
12.2. Asia Pacific Market, by Product Type Segment
12.2.1. Flooded
12.2.2. Sealed
12.2.2.1. AGM
12.2.2.2. Gel
12.3. Asia Pacific Market, by Application Segment
12.3.1. Automotive
12.3.2. Motor Cycles
12.3.3. Motive Power
12.3.4. Renewable Power
12.3.5. UPS & Telecom
12.3.6. Others (Wheel chair, etc.)
12.4. China Market Size & Forecast by Product Type Segment
12.4.1. Flooded
12.4.2. Sealed
12.4.2.1. AGM
12.4.2.2. Gel
12.5. China Market Size & Forecast by Application Segment
12.5.1. Automotive
12.5.2. Motor Cycles
12.5.3. Motive Power
12.5.4. Renewable Power
12.5.5. UPS & Telecom
12.5.6. Others (Wheel chair, etc.)
12.6. India Market Size & Forecast by Product Type Segment
12.6.1. Flooded
12.6.2. Sealed
12.6.2.1.AGM
12.6.2.2.Gel
12.7. India Market Size & Forecast by Application Segment
12.7.1. Automotive
12.7.2. Motor Cycles
12.7.3. Motive Power
12.7.4. Renewable Power
12.7.5. UPS & Telecom
12.7.6. Others (Wheel chair, etc.)
12.8. Japan Market Size & Forecast by Product Type Segment
12.8.1. Flooded
12.8.2. Sealed
12.8.2.1.AGM
12.8.2.2.Gel
12.9. Japan Market Size & Forecast by Application Segment
12.9.1. Automotive
12.9.2. Motor Cycles
12.9.3. Motive Power
12.9.4. Renewable Power
12.9.5. UPS & Telecom
12.9.6. Others (Wheel chair, etc.)
12.10. ASEAN Market Size & Forecast by Product Type Segment
12.10.1. Flooded
12.10.2. Sealed
12.10.2.1.AGM
12.10.2.2.Gel
12.11. ASEAN Market Size & Forecast by Application Segment
12.11.1. Automotive
12.11.2. Motor Cycles
12.11.3. Motive Power
12.11.4. Renewable Power
12.11.5. UPS & Telecom
12.11.6. Others (Wheel chair, etc.)
12.12. Rest of Asia Pacific Market Size & Forecast by Product Type Segment
12.12.1. Flooded
12.12.2. Sealed
12.12.2.1.AGM
12.12.2.2.Gel
12.13. Rest of Asia Pacific Market Size & Forecast by Application Segment
12.13.1. Automotive
12.13.2. Motor Cycles
12.13.3. Motive Power
12.13.4. Renewable Power
12.13.5. UPS & Telecom
12.13.6. Others (Wheel chair, etc.)
13. Latin America Lead Acid Battery Market Size and Forecast (Thousand Units) (US$ Mn), 2018-2026
13.1. Key Findings
13.2. Latin America Market, by Product Type Segment
13.2.1. Flooded
13.2.2. Sealed
13.2.2.1.AGM
13.2.2.2.Gel
13.3. Latin America Market, by Application Segment
13.3.1. Automotive
13.3.2. Motor Cycles
13.3.3. Motive Power
13.3.4. Renewable Power
13.3.5. UPS & Telecom
13.3.6. Others (Wheel chair, etc.)
13.4. Brazil Market Size & Forecast by Product Type Segment
13.4.1. Flooded
13.4.2. Sealed
13.4.2.1.AGM
13.4.2.2.Gel
13.5. Brazil Market Size & Forecast by Application Segment
13.5.1. Automotive
13.5.2. Motor Cycles
13.5.3. Motive Power
13.5.4. Renewable Power
13.5.5. UPS & Telecom
13.5.6. Others (Wheel chair, etc.)
13.6. Mexico Market Size & Forecast by Product Type Segment
13.6.1. Flooded
13.6.2. Sealed
13.6.2.1.AGM
13.6.2.2.Gel
13.7. Mexico Market Size & Forecast by Application Segment
13.7.1. Automotive
13.7.2. Motor Cycles
13.7.3. Motive Power
13.7.4. Renewable Power
13.7.5. UPS & Telecom
13.7.6. Others (Wheel chair, etc.)
13.8. Argentina Market Size & Forecast by Product Type Segment
13.8.1. Flooded
13.8.2. Sealed
13.8.2.1.AGM
13.8.2.2.Gel
13.9.Argentina Market Size & Forecast by Application Segment
13.9.1. Automotive
13.9.2. Motor Cycles
13.9.3. Motive Power
13.9.4. Renewable Power
13.9.5. UPS & Telecom
13.9.6. Others (Wheel chair, etc.)
13.10. Rest of Latin America Market Size & Forecast by Product Type Segment
13.10.1. Flooded
13.10.2. Sealed
13.10.2.1. AGM
13.10.2.2. Gel
13.12. Rest of Latin America Market Size & Forecast by Application Segment
13.12.1. Automotive
13.12.2. Motor Cycles
13.12.3. Motive Power
13.12.4. Renewable Power
13.12.5. UPS & Telecom
13.12.6. Others (Wheel chair, etc.)
14. Middle East & Africa Lead Acid Battery Market Size and Forecast (Thousand Units) (US$ Mn), 2018-2026
14.1. Key Findings
14.2. Middle East & Africa Market, by Product Type Segment
14.2.1. Flooded
14.2.2. Sealed
14.2.2.1.AGM
14.2.2.2.Gel
14.3. Middle East & Africa Market, by Application Segment
14.3.1. Automotive
14.3.2. Motor Cycles
14.3.3. Motive Power
14.3.4. Renewable Power
14.3.5. UPS & Telecom
14.3.6. Others (Wheel chair, etc.)
14.4. GCC Market Size & Forecast by Product Type Segment
14.4.1. Flooded
14.4.2. Sealed
14.4.2.1.AGM
14.4.2.2.Gel
14.5. GCC Market Size & Forecast by Application Segment
14.5.1. Automotive
14.5.2. Motor Cycles
14.5.3. Motive Power
14.5.4. Renewable Power
14.5.5. UPS & Telecom
14.5.6. Others (Wheel chair, etc.)
14.6. South Africa Market Size & Forecast by Product Type Segment
14.6.1. Flooded
14.6.2. Sealed
14.6.2.1.AGM
14.6.2.2.Gel
14.7. South Africa Market Size & Forecast by Application Segment
14.7.1. Automotive
14.7.2. Motor Cycles
14.7.3. Motive Power
14.7.4. Renewable Power
14.7.5. UPS & Telecom
14.7.6. Others (Wheel chair, etc.)
14.8. Rest of Middle East & Africa Market Size & Forecast by Product Type Segment
14.8.1. Flooded
14.8.2. Sealed
14.8.2.1.AGM
14.8.2.2.Gel
14.9. Rest of Middle East & Africa Market Size & Forecast by Application Segment
14.9.1. Automotive
14.9.2. Motor Cycles
14.9.3. Motive Power
14.9.4. Renewable Power
14.9.5. UPS & Telecom
14.9.6. Others (Wheel chair, etc.)
15. Competition Landscape
15.1. Competition Matrix (By Tier and Size of companies)
15.2. Company Profiles
15.2.1. JOHNSON CONTROLS INTERNATIONAL PLC
15.2.1.1. Company Details (Headquarters’, Established year, Revenue, Employee Strength, Key Management)
15.2.1.2. Business Overview
15.2.1.3. Product Segments & Applications
15.2.1.4. Financial Overview
15.2.1.5. Strategic Overview
15.2.1.5.1. Key Developments
15.2.1.5.2. Partnerships
15.2.2. ENERSYS
15.2.2.1. Company Details (Headquarters’, Established year, Revenue, Employee Strength, Key Management)
15.2.2.2. Business Overview
15.2.2.3. Product Segments & Applications
15.2.2.4. Financial Overview
15.2.2.5. Strategic Overview
15.2.2.5.1. Intellectual Property
15.2.2.5.2. Acquisitions
15.2.2.5.3. Key Developments
15.2.3. Exide Technologies
15.2.3.1. Company Details (Headquarters’, Established year, Revenue, Employee Strength, Key Management)
15.2.3.2. Business Overview
15.2.3.3. Product Segments & Applications
15.2.3.4. Financial Overview
15.2.3.5. Strategic Overview
15.2.3.5.1. Research & Development
15.2.3.5.2. Key Developments
15.2.4. GS Yuasa Corporation
15.2.4.1. Company Details (Headquarters’, Established year, Revenue, Employee Strength, Key Management)
15.2.4.2. Business Overview
15.2.4.3. Product Segments & Industries Served
15.2.4.4. Financial Overview
15.2.4.5. Strategic Overview
15.2.4.5.1. Acquisitions
15.2.5. Amara Raja Batteries Limited
15.2.5.1. Company Details (Headquarters’, Established year, Revenue, Employee Strength, Key Management)
15.2.5.2. Business Overview
15.2.5.3. Product Segments & Applications
15.2.5.4. Financial Overview
15.2.5.5. Strategic Overview
15.2.5.5.1. Expansions
15.2.6. EXIDE INDUSTRIES LIMITED
15.2.6.1. Company Details (Headquarters’, Established year, Revenue, Employee Strength, Key Management)
15.2.6.2. Business Overview
15.2.6.3. Product Segments & Applications
15.2.6.4. Financial Overview
15.2.6.5. Strategic Overview
15.2.6.5.1. Research & Development
15.2.6.5.2. Exports
15.2.7. HBL Power Systems Limited
15.2.7.1. Company Details (Headquarters’, Established year, Revenue, Employee Strength, Key Management)
15.2.7.2. Business Overview
15.2.7.3. Product Segments & Applications
15.2.7.4. Financial Overview
15.2.7.5. Strategic Overview
15.2.7.5.1. Reverse Merger
15.2.8. C&D TECHNOLOGIES, INC
15.2.8.1. Company Details (Headquarters’, Established year, Revenue, Employee Strength, Key Management)
15.2.8.2. Business Overview
15.2.8.3. Product Segments & Applications
15.2.8.4. Strategic Overview
15.2.8.4.1. Key Developments
15.2.8.4.2. Divestiture
15.2.8.4.3. Acquisitions
15.2.8.4.4. Expansions
15.2.9. NorthStar.
15.2.9.1. Company Details (Headquarters’, Established year, Revenue, Employee Strength, Key Management)
15.2.9.2. Business Overview
15.2.9.3. Product Segments & Applications
15.2.9.4. Strategic Overview
15.2.9.4.1. Key Developments
15.2.9.4.2. Technology
15.2.10. First National Battery.
15.2.10.1. Company Details (Headquarters’, Established year, Revenue, Employee Strength, Key Management)
15.2.10.2. Business Overview
15.2.10.3. Product Segments & Applications
15.2.10.4. Strategic Overview
15.2.10.4.1. Key Developments
15.2.10.4.2. Production Plants
15.2.11. East Penn Manufacturing Co.
15.2.11.1. Company Details (Headquarters’, Established year, Revenue, Employee Strength, Key Management)
15.2.11.2. Business Overview
15.2.11.3. Product Segments & Applications
15.2.11.4. Strategic Overview
15.2.11.4.1. Expansion
15.2.11.4.2. Facilities
15.2.12. FIAMM Energy Technology S.p.A.
15.2.12.1. Company Details (Headquarters’, Established year, Revenue, Employee Strength, Key Management)
15.2.12.2. Business Overview
15.2.12.3. Product Segments & Applications
15.2.12.4. Strategic Overview
15.2.12.4.1. Joint Venture
15.2.12.4.2. Partnerships
15.2.13. HOPPECKE Batterien GmbH & Co. KG
15.2.13.1. Company Details (Headquarters’, Established year, Revenue, Employee Strength, Key Management)
15.2.13.2. Business Overview
15.2.13.3. Product Segments & Applications
15.2.13.4. Strategic Overview
15.2.13.4.1. Key Developments
15.2.14. Crown Battery Manufacturing Company
15.2.14.1. Company Details (Headquarters’, Established year, Revenue, Employee Strength, Key Management)
15.2.14.2. Business Overview
15.2.14.3. Product Segments & Applications
15.2.15. Trojan Battery Company
15.2.15.1. Company Details (Headquarters’, Established year, Revenue, Employee Strength, Key Management)
15.2.15.2. Business Overview
15.2.15.3. Product Segments & Applications
15.2.15.4. Strategic Overview
15.2.15.4.1. Key Developments
List of Tables
Table 01: Global Lead-acid Batteries Market size (US$ Mn) (Thousand Units) Forecast, by Product Type, 2017–2026
Table 02: Global Lead-acid Batteries Market Size (US$ Mn) Forecast, by Application, 2017–2026
Table 03: Global Lead-acid Batteries Market Volume (Thousand Units) Forecast, by Application, 2017–2026
Table 04: Global Lead-acid Batteries Market Revenue (US$ Mn) and Forecast, by Country/Sub-region, 2017–2026
Table 05: Global Lead-acid Batteries Market Volume (Thousand Units) and Forecast, by Country/Sub-region, 2017–2026
Table 06: North America Lead-acid Batteries Market Size (US$ Mn) (Thousand Units) Forecast, by Product, 2017–2026
Table 07: North America Lead-acid Batteries Market Size (US$ Mn) Forecast, by Application, 2017–2026
Table 08: North America Lead-acid Batteries Market Volume (Thousand Units) Forecast, by Application, 2017–2026
Table 09: North America Lead-acid Batteries Market Revenue (US$ Mn) Volume ( Thousand Units) Forecast, by Country/Sub-region, 2017–2026
Table 10: U.S. Lead-acid Batteries Market Size (US$ Mn) (Thousand Units) Forecast, by Product, 2017–2026
Table 11: U.S. Lead-acid Batteries Market Size (US$ Mn) Forecast, by Application, 2017–2026
Table 12: U.S. Lead-acid Batteries Market Volume (Thousand Units) Forecast, by Application, 2017–2026
Table 13: Canada Lead-acid Batteries Market Size (US$ Mn) (Thousand Units) Forecast, by Product, 2017–2026
Table 14: Canada Lead-acid Batteries Market Size (US$ Mn) Forecast, by Application, 2017–2026
Table 15: Canada Lead-acid Batteries Market Volume (Thousand Units) Forecast, by Application, 2017–2026
Table 16: Europe Lead-acid Batteries Market size (US$ Mn) (Thousand Units) Forecast, by Product, 2017–2026
Table 17: Europe Lead-acid Batteries Market Size (US$ Mn) Forecast, by Application, 2017–2026
Table 18: Europe Lead-acid Batteries Market Volume (Thousand Units) Forecast, by Application, 2017–2026
Table 19: Europe Lead-acid Batteries Market Revenue (US$ Mn) and Forecast, by Country/Sub region, 2017–2026
Table 20: Europe Lead-acid Batteries Market Volume (Thousand Units) and Forecast, by Country Region, 2017–2026
Table 21: Germany Lead-acid Batteries Market size (US$ Mn) (Thousand Units) Forecast, by Product, 2017–2026
Table 22: Germany Lead-acid Batteries Market Size (US$ Mn) Forecast, by Application, 2017–2026
Table 23: Germany Lead-acid Batteries Market Volume (Thousand Units) Forecast, by Application, 2017–2026
Table 24: France Lead-acid Batteries Market size (US$ Mn) (Thousand Units) Forecast, by Product, 2017–2026
Table 25: France Lead-acid Batteries Market Size (US$ Mn) Forecast, by Application, 2017–2026
Table 26: France Lead-acid Batteries Market Volume (Thousand Units) Forecast, by Application, 2017–2026
Table 27: U.K. Lead-acid Batteries Market size (US$ Mn) (Thousand Units) Forecast, by Product, 2017–2026
Table 28: U.K. Lead-acid Batteries Market Size (US$ Mn) Forecast, by Application, 2017–2026
Table 29: U.K. Lead-acid Batteries Market Volume (Thousand Units) Forecast, by Application, 2017–2026
Table 30: Spain Lead-acid Batteries Market size (US$ Mn) (Thousand Units) Forecast, by Product, 2017–2026
Table 31: Spain Lead-acid Batteries Market Size (US$ Mn) Forecast, by Application, 2017–2026
Table 32: Spain Lead-acid Batteries Market Volume (Thousand Units) Forecast, by Application, 2017–2026
Table 33: Italy Lead-acid Batteries Market size (US$ Mn) (Thousand Units) Forecast, by Product, 2017–2026
Table 34: Italy Lead-acid Batteries Market Size (US$ Mn) Forecast, by Application, 2017–2026
Table 35: Italy Lead-acid Batteries Market Volume (Thousand Units) Forecast, by Application, 2017–2026
Table 36: Russia & CIS Lead-acid Batteries Market size (US$ Mn) (Thousand Units) Forecast, by Product, 2017–2026
Table 37: Russia & CIS Lead-acid Batteries Market Size (US$ Mn) Forecast, by Application, 2017–2026
Table 38: Russia & CIS Lead-acid Batteries Market Volume (Thousand Units) Forecast, by Application, 2017–2026
Table 39: Rest of Europe Lead-acid Batteries Market size (US$ Mn) (Thousand Units) Forecast, by Product, 2017–2026
Table 40: Rest of Europe Lead-acid Batteries Market Size (US$ Mn) Forecast, by Application, 2017–2026
Table 41: Rest of Europe Lead-acid Batteries Market Volume (Thousand Units) Forecast, by Application, 2017–2026
Table 42: Asia Pacific Lead-acid Batteries Market size (US$ Mn) (Thousand Units) Forecast, by Product Type, 2017–2026
Table 43: Asia Pacific Lead-acid Batteries Market Size (US$ Mn) Forecast, by Application, 2017–2026
Table 44: Asia Pacific Lead-acid Batteries Market Volume (Thousand Units) Forecast, by Application, 2017–2026
Table 45: Asia Pacific Lead-acid Batteries Market Revenue (US$ Mn) and Forecast, by Country/Sub-region, 2017–2026
Table 46: Asia Pacific Lead-acid Batteries Market Volume (Thousand Units) and Forecast, by Country/Sub-region, 2017–2026
Table 47: China Lead-acid Batteries Market size (US$ Mn) (Thousand Units) Forecast, by Product Type, 2017–2026
Table 48: China Lead-acid Batteries Market Size (US$ Mn) Forecast, by Application, 2017–2026
Table 49: China Lead-acid Batteries Market Volume (Thousand Units) Forecast, by Application, 2017–2026
Table 50: India Lead-acid Batteries Market size (US$ Mn) (Thousand Units) Forecast, by Product Type, 2017–2026
Table 51: India Lead-acid Batteries Market Size (US$ Mn) Forecast, by Application, 2017–2026
Table 52: India Lead-acid Batteries Market Volume (Thousand Units) Forecast, by Application, 2017–2026
Table 53: Japan Lead-acid Batteries Market size (US$ Mn) (Thousand Units) Forecast, by Product Type, 2017–2026
Table 54: Japan Lead-acid Batteries Market Size (US$ Mn) Forecast, by Application, 2017–2026
Table 55: Japan Lead-acid Batteries Market Volume (Thousand Units) Forecast, by Application, 2017–2026
Table 56: ASEAN Lead-acid Batteries Market size (US$ Mn) (Thousand Units) Forecast, by Product Type, 2017–2026
Table 57: ASEAN Lead-acid Batteries Market Size (US$ Mn) Forecast, by Application, 2017–2026
Table 58: ASEAN Lead-acid Batteries Market Volume (Thousand Units) Forecast, by Application, 2017–2026
Table 59: Rest of Asia Pacific Lead-acid Batteries Market size (US$ Mn) (Thousand Units) Forecast, by Product Type, 2017–2026
Table 60: Rest of Asia Pacific Lead-acid Batteries Market Size (US$ Mn) Forecast, by Application, 2017–2026
Table 61: Rest of Asia Pacific Lead-acid Batteries Market Volume (Thousand Units) Forecast, by Application, 2017–2026
Table 62: Latin America Lead-acid Batteries Market size (US$ Mn) (Thousand Units) Forecast, by Product Type, 2017–2026
Table 63: Latin America Lead-acid Batteries Market Size (US$ Mn) Forecast, by Application, 2017–2026
Table 64: Latin America Lead-acid Batteries Market Volume (Thousand Units) Forecast, by Application, 2017–2026
Table 65: Latin America Lead-acid Batteries Market Revenue (US$ Mn) and Forecast, by Country/Sub-region, 2017–2026
Table 66: Latin America Lead-acid Batteries Market Volume (Thousand Units) and Forecast, by Country Country/Sub-region, 2017–2026
Table 67: Brazil Lead-acid Batteries Market size (US$ Mn) (Thousand Units) Forecast, by Product Type, 2017–2026
Table 68: Brazil Lead-acid Batteries Market Size (US$ Mn) Forecast, by Application, 2017–2026
Table 69: Brazil Lead-acid Batteries Market Volume (Thousand Units) Forecast, by Application, 2017–2026
Table 70: Mexico Lead-acid Batteries Market size (US$ Mn) (Thousand Units) Forecast, by Product Type, 2017–2026
Table 71: Mexico Lead-acid Batteries Market Size (US$ Mn) Forecast, by Application, 2017–2026
Table 72: Mexico Lead-acid Batteries Market Volume (Thousand Units) Forecast, by Application, 2017–2026
Table 73: Argentina Lead-acid Batteries Market size (US$ Mn) (Thousand Units) Forecast, by Product Type, 2017–2026
Table 74: Argentina Lead-acid Batteries Market Size (US$ Mn) Forecast, by Application, 2017–2026
Table 75: Argentina Lead-acid Batteries Market Volume (Thousand Units) Forecast, by Application, 2017–2026
Table 76: Rest of Latin America Lead-acid Batteries Market size (US$ Mn) (Thousand Units) Forecast, by Product Type, 2017–2026
Table 77: Rest of Latin America Lead-acid Batteries Market Size (US$ Mn) Forecast, by Application, 2017–2026
Table 78: Rest of Latin America Lead-acid Batteries Market Volume (Thousand Units) Forecast, by Application, 2017–2026
Table 79: Middle East & Africa Lead-acid Batteries Market Size (US$ Mn) (Thousand Units) Forecast, by Product Type, 2017–2026
Table 80: Middle East & Africa Lead-acid Batteries Market Size (US$ Mn) Forecast, by Application, 2017–2026
Table 81: Middle East & Africa Lead-acid Batteries Market Volume (Thousand Units) Forecast, by Application, 2017–2026
Table 82: Middle East & Africa Lead-acid Batteries Market Revenue (US$ Mn) and Forecast, by Country/Sub-region, 2017–2026
Table 83: Middle East & Africa Lead-acid Batteries Market Volume (Thousand Units) and Forecast, by Country/Sub-region, 2017–2026
Table 84: GCC Lead-acid Batteries Market size (US$ Mn) (Thousand Units) Forecast, by Product Type, 2017–2026
Table 85: GCC Lead-acid Batteries Market Size (US$ Mn) Forecast, by Application, 2017–2026
Table 86: GCC Lead-acid Batteries Market Volume (Thousand Units) Forecast, by Application, 2017–2026
Table 87: South Africa Lead-acid Batteries Market size (US$ Mn) (Thousand Units) Forecast, by Product Type, 2017–2026
Table 88: South Africa Lead-acid Batteries Market Size (US$ Mn) Forecast, by Application, 2017–2026
Table 89: South Africa Lead-acid Batteries Market Volume (Thousand Units) Forecast, by Application, 2017–2026
Table 90: Rest of Middle East & Africa Lead-acid Batteries Market size (US$ Mn) (Thousand Units) Forecast, by Product Type, 2017–2026
Table 91: Rest of Middle East & Africa Lead-acid Batteries Market Size (US$ Mn) Forecast, by Application, 2017–2026
Table 92: Rest of Middle East & Africa Lead-acid Batteries Market Volume (Thousand Units) Forecast, by Application, 2017–2026
List of Figures
Figure 01: Summary: Global Lead-acid Batteries Market value (US$ Mn) & Volume (Thousand Units), 2017–2026
Figure 02: Schematic of Lead Acid Batteries
Figure 03: Lead acid-Batteries Recycling Supply chain
Figure 04: Breakup of Percentage Split of Imports - HS 850710, by Country/Sub-region, 2016
Figure 05: Breakup of Percentage Split of Exports- HS 850710, by Country/Sub-region, 2016
Figure 06: Lead Acid Battery Price Trend for Automotive (US$/Unit), 2017-2026
Figure 07: Lead Acid Battery Price Trend for Motorcycle (US$/Unit), 2017-2026
Figure 08: Lead Acid Battery Price Trend for Motive Power (US$/Unit), 2017-2026
Figure 09: Lead Acid Battery Price Trend for Renewable Power (US$/Unit), 2017-2026
Figure 10: Lead Acid Battery Price Trend for UPS & Telecom (US$/Unit), 2017-2026
Figure 11: Lead Acid Battery Price Trend for Others (US$/Unit), 2017-2026
Figure 12: Global Lead-acid Batteries Market Value Share Analysis, by Product Type, 2017 and 2026
Figure 13: Global Lead-acid Batteries Market Value Share Analysis, by Sealed Product Type, 2017 and 2026
Figure 14: Global Lead Acid Market Size, Value (US$ Mn), Volume (Thousand Units), by Flooded Product Type
Figure 15: Global Lead Acid Market Size, Value (US$ Mn), Volume (Thousand Units), by Sealed Product Type
Figure 16: Global Lead Acid Market Size, Value (US$ Mn), Volume (Thousand Units), by AGM Product Type
Figure 17: Global Lead Acid Market Size, Value (US$ Mn), Volume (Thousand Units), by Gel Product Type
Figure18: Global Lead-acid Batteries Market Attractiveness Analysis, by Product Type
Figure 19: Global Lead-acid Batteries Market Attractiveness Analysis, by Sealed Product Type
Figure 20: Global Lead-acid Batteries Market Value Share Analysis, by Application, 2017 and 2026
Figure 21: Global Lead Acid Market Size, Value (US$ Mn), Volume (Thousand Units), by Automotive Application
Figure 22: Global Lead Acid Market Size, Value (US$ Mn), Volume (Thousand Units), by Motorcycles Application
Figure 23: Global Lead Acid Market Size, Value (US$ Mn), Volume (Thousand Units), by Motive Power Application
Figure 24: Global Lead Acid Market Size, Value (US$ Mn), Volume (Thousand Units), by Renewable Power Application
Figure 25: Global Lead Acid Market Size, Value (US$ Mn), Volume (Thousand Units), by UPS & Telecom Application
Figure 26: Global Lead Acid Market Size, Value (US$ Mn), Volume (Thousand Units), by Other Application
Figure 27: Global Lead-acid Batteries Market Attractiveness Analysis, by Application
Figure 28: Global Lead-acid Batteries Market Value Share Analysis, by Country/Sub-region, 2017 and 2026
Figure 29: Global Lead-acid Batteries Market Attractiveness Analysis, by Country/Sub-region
Figure 30: North America Lead-acid Batteries Market Value Share Analysis, by Product, 2017 and 2026
Figure 31: North America Lead-acid Batteries Market Value Share Analysis, by Sealed Product Type, 2017 and 2026
Figure 32: North America Lead-acid Batteries Market Attractiveness Analysis, by Product
Figure 33: North America Lead-acid Batteries Market Attractiveness Analysis, by Sealed Product Type
Figure 34: North America Lead-acid Batteries Market Value Share Analysis, by Application, 2017 and 2026
Figure 35: North America Lead-acid Batteries Market Attractiveness Analysis, by Application
Figure 36: North America Lead-acid Batteries Market Value Share Analysis, by Country/Sub-region, 2017 and 2026
Figure 37: North America Lead-acid Batteries Market Attractiveness Analysis by Country/Sub-region 2017
Figure 38: Europe Lead-acid Batteries Market Value Share Analysis, by Product, 2017 and 2026
Figure 39: Europe Lead-acid Batteries Market Value Share Analysis, by Sealed Battery, 2017 and 2026
Figure 40: Europe Lead-acid Batteries Market Attractiveness Analysis, by Product
Figure 41: Europe Lead-acid Batteries Market Attractiveness Analysis, by Sealed Battery
Figure 42: Europe Lead-acid Batteries Market Value Share Analysis, by Application, 2017 and 2026
Figure 43: Europe Lead-acid Batteries Market Attractiveness Analysis, by Application
Figure 44: Europe Lead-acid Batteries Market Value Share Analysis, by Country/Sub-region, 2017 and 2026
Figure 45: Europe Lead-acid Battery Market Attractiveness Analysis by Country/Sub region, 2017
Figure 46: Asia Pacific Lead-acid Batteries Market Value Share Analysis, by Product Type, 2017 and 2026
Figure 47: Asia Pacific Lead-acid Batteries Market Value Share Analysis, by Sealed Product Type, 2017 and 2026
Figure 48: Asia Pacific Lead-acid Batteries Market Attractiveness Analysis, by Product Type
Figure 49: Asia Pacific Lead-acid Batteries Market Attractiveness Analysis, by Sealed Product Type
Figure 50: Asia Pacific Lead-acid Batteries Market Value Share Analysis, by Application, 2017 and 2026
Figure 51: Asia Pacific Lead-acid Batteries Market Attractiveness Analysis, by Application
Figure 52: Asia Pacific Lead-acid Batteries Market Value Share Analysis, by Country/Sub-region, 2017 and 2026
Figure 53: Asia Pacific Lead-acid Batteries Market Attractiveness Analysis, by Country/Sub-region
Figure 54: Latin America Lead-acid Batteries Market Value Share Analysis, by Product Type, 2017 and 2026
Figure 55: Latin America Lead-acid Batteries Market Value Share Analysis, by Sealed Product Type, 2017 and 2026
Figure 56: Latin America Lead-acid Batteries Market Attractiveness Analysis, by Product Type
Figure 57: Latin America Lead-acid Batteries Market Attractiveness Analysis, by Sealed Product Type
Figure 58: Latin America Lead-acid Batteries Market Value Share Analysis, by Application, 2017 and 2026
Figure 59: Latin America Lead-acid Batteries Market Attractiveness Analysis, by Application
Figure 60: Latin America Lead-acid Batteries Market Value Share Analysis, by Country/Sub-region, 2017 and 2026
Figure 61: Latin America Lead-acid Batteries Market Attractiveness Analysis, by Country/Sub-region
Figure 62: Middle East & Africa Lead-acid Batteries Market Value Share Analysis, by Product Type, 2017 and 2026
Figure 63: Middle East & Africa Lead-acid Batteries Market Value Share Analysis, by Sealed Product Type, 2017 and 2026
Figure 64: Middle East & Africa Lead-acid Batteries Market Attractiveness Analysis, by Product Type
Figure 65: Middle East & Africa Lead-acid Batteries Market Attractiveness Analysis, by Sealed Product Type
Figure 66: Middle East & Africa Lead-acid Batteries Market Value Share Analysis, by Application, 2017 and 2026
Figure 67: Middle East & Africa Lead-acid Batteries Market Attractiveness Analysis, by Application
Figure 68: Middle East & Africa Lead-acid Batteries Market Value Share Analysis, by Country/Sub-region, 2017 and 2026
Figure 69: Middle East & Africa Lead-acid Batteries Market Attractiveness Analysis, by Country/Sub-region
Copyright © Transparency Market Research, Inc. All Rights reserved
Trust Online

Lead Acid Battery Market