
Reports
Reports
Inulin is a dietary fiber found in a variety of fruits, vegetables, and herbs, including wheat, onions, bananas, leeks, artichokes, and asparagus. Plants commonly contain inulin, and some producers add it to processed foods. Inulin is also a polymer of fructose molecule (fructan). Like other fructans, it is prebiotic, meaning that it nourishes the good bacteria in the gut. Moreover, the gut bacteria transform inulin and other prebiotics into short-chain fatty acids, which sustain colon cells and present several other health benefits. Inulin molecules link collectively in a way that the small intestine cannot break down, and instead travel to the lower gut and feed beneficial bacteria. Moreover, inulin is a starchy substance and is most commonly used for medicine obtained by soaking chicory roots in hot water. Hence, the growing demand for pharmaceuticals and rising trends of ingredients derived from natural products are expected to propel the demand for the global inulin market during the forecast period.
Various plants that contain inulin have been around for several thousand years, and some humans consumed more inulin as compared to the present. Inulin is not digested or embodied in the stomach. It runs to the bowels where bacteria are able to use it to grow. It fosters the growth of specific kinds of bacteria that are affiliated with improving bowel function and overall health. Furthermore, inulin reduces the body’s ability to gain certain sorts of fats. Inulin is usually used by the mouth for high blood fats, including cholesterol and triglycerides. It is also utilized for weight loss, costiveness, diarrhoea, and diabetes. Inulin has been proven effective for elderly people with once or twice a week bowel movements to have a bowel movement daily.
The outbreak of the COVID-19 pandemic has severely impacted almost every industry, of which many have been highly responsive. The inulin market leaders have rallied to enable the supply of raw materials, direct workforce safety, and manage unfolding government restrictions all while starting to plan for ways to supply inulin to end-use industries. Major market players have put crisis-response instruction centers in place to suitably manage and bring stability to an otherwise uncertain time. However, the global inulin market has witnessed a surge in the demand from the pharmaceutical sector, owing to an increased number of hospitalized people across the world. However, restrictions in the global supply chain caused a lack of inulin in several pharmaceutical medicines. With available alternatives for inulin at the time of the pandemic, the demand curve went down for the global inulin market. Furthermore, the food & beverage segment remained affected due to limited raw materials, insufficient workforce, and restricted supply chain. This hampered the demand for inulin from the food industry, which affected the inulin market severely.
On the path to recovery, COVID-19 has intensified the focus on risk management, as businesses reassess their supply chain policies, and steps to make them more flexible and resilient to disruption. It includes the potential for future disruptions to the workforce, as modifications in design and operating models will drive redistribution of expertise and new skill sets. Various businesses are considering revaluating their strategies, risk sensitivity, and the overall network footprint to address these types of risks. Moreover, businesses are considering the excess capacity they might need, dual sourcing, and geographic diversification. As buying decisions are impacted and will be reliant on the way businesses assess their contract development and manufacturing organizations (CDMOs). This includes weighing solvency risks, controlling amount, merging with partners in diversifying locations, and other considerations that balance cost and risk.
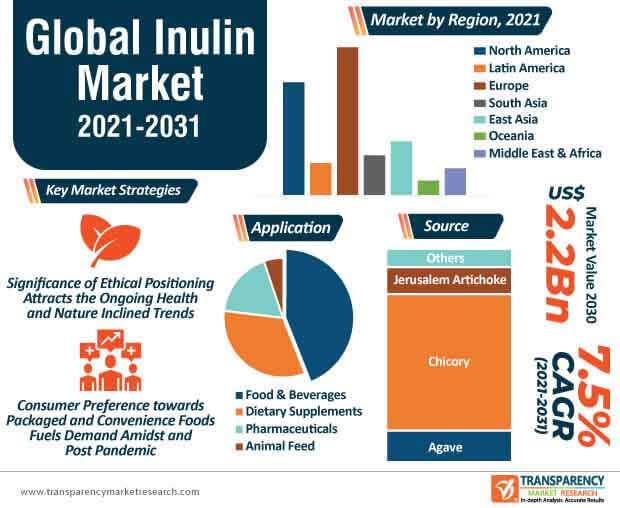
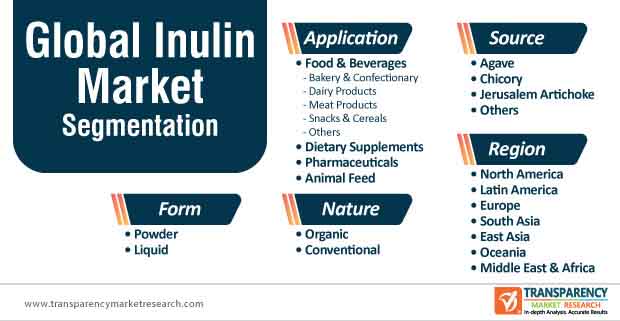
Growing popularity of prebiotic ingredients and increasing awareness campaigns for low fat and calorie reduction are expected to fuel the global inulin market during the forecast period. Moreover, government authorized food and drugs organizations across several nations have recognized inulin as a safe product, ensuring consumer safety. In addition, the growing use of inulin in the formation of cheese, ice creams, and yogurts is driving the demand from the dairy industry. In the food & beverage sector, the growing importance of low caloric sugar products is propelling the demand for inulin on a global scale. Additionally, as the market price of inulin is stable, it is expected to support application development and penetration. The abundance of chicory root, one of the basic sources of inulin, especially in Europe and Asia, is anticipated to maintain stable supply rates and evade market volatility. All these factors are likely to contribute to the growth of the global inulin market in the near future.
Consumer shifts toward health and fitness are generating better opportunities for the inulin manufacturers for dietary supplements and functional foods. Moreover, consumers' expenditure on clinical nutrition due to wellness trends is influencing the growth of the inulin market. Inulin is also trending for its higher nutritional content that includes rich fibers and the presence of minerals such as potassium and calcium, proteins, and vitamins including vitamin C. In many regions, especially in North America, old age people are rapidly adopting dietary supplements to live a longer life. This rise in inulin adoption is likely to attract new consumers toward the inulin market during the forecast period. However, an increasing number of probiotic and prebiotic ingredients is likely to prove restraining factors for the global inulin market.
Europe holds major share of the inulin market and is likely to dominate the market in the near future. The presence of beneficial regulatory policies for the inclusion of functional ingredients, mainly in food & beverages applications in Europe is one of the primary reasons for the region's steady growth rate. However, with increasing old age population and surging consumption of infant food formula, the inulin market in Asia Pacific is expected to gain notable growth during the projected period. In addition, North America is anticipated to account for a significant share of the rising consciousness of consumers toward calorie reduction in the region. The global inulin market is anticipated to reach the value of US$ 2.2 Bn by 2031, expanding at a CAGR of 6.3% during the forecast period.
Analysts’ Viewpoint
The growing prevalence of various diseases is driving researchers and scientists to innovate and develop solutions for customers. The health-benefiting properties of inulin are being increasingly adopted in the pharmaceutical industry for the treatment of various disorders. The food & beverages industry is one of the larger end users, and is witnessing an increased demand for sports and performance drinks, ready-to-drink beverages, energy drinks, and other enhanced and enriched beverages. Furthermore, as inulin is plant-based and natural, it is increasingly attracting consumers inclining toward a vegan diet. All these factors are contributing toward the growth of the global inulin market during the forecast period.
Inulin Market: Overview
Inulin Market: Frontrunners
Inulin Market: Dynamics
Inulin Market: Strategies
Europe Wheat Starch Market: Key Players
Inulin Market is expected to Reach US$ 2.2 Bn By 2031
Inulin Market is estimated to rise at a CAGR of 6.3% during forecast period
Increasing demand for energy supplements is expected to drive the Inulin Market
North America is more attractive for vendors in the Inulin Market
Key players of Inulin Market are Ingredion Incorporated, Cargill Incorporated, Archer Daniels Midland Company, Tereos S.A, BENEO, Nexira, COSUCRA, Sensus, NOW Health Group, Inc, Steviva Brands, Inc, Naturel West Corp EU B.V, The Tierra Group, The Green Labs LLC, IntrinsicOrganics, Bioway (Xi'An) Organic Ingredients Co.,Ltd
1. Executive Summary
1.1. Global Market Outlook
1.2. Demand Side Trends
1.3. Supply Side Trends
1.4. Analysis and Recommendations
2. Market Overview
2.1. Market Coverage / Taxonomy
2.2. Market Definition / Scope / Limitations
3. Key Market Trends
3.1. Key Trends Impacting the Market
3.2. Product Innovation / Development Trends
4. Key Success Factors
4.1. Product Adoption / Usage Analysis
4.2. Product USPs / Features
4.3. Strategic Promotional Strategies
5. Global Inulin Market Demand Analysis 2016–2020 and Forecast, 2021–2031
5.1. Historical Market Volume (Tons) Analysis, 2016–2020
5.2. Current and Future Market Volume (Tons) Projections, 2021–2031
6. Global Inulin Market - Pricing Analysis
6.1. Regional Pricing Analysis
6.2. Global Average Pricing Analysis Benchmark
7. Global Inulin Market Demand (in Value or Size in US$ Mn) Analysis 2016–2020 and Forecast, 2021–2031
7.1. Historical Market Value (US$ Mn) Analysis, 2016–2020
7.2. Current and Future Market Value (US$ Mn) Projections, 2021–2031
7.2.1. Y-o-Y Growth Trend Analysis
7.2.2. Absolute $ Opportunity Analysis
8. Market Background
8.1. Macro-Economic Factors
8.1.1. Global GDP Growth Outlook
8.1.2. Global Industry Value Added
8.1.3. Global Urbanization Growth Outlook
8.1.4. Global Food Security Index Outlook
8.1.5. Global Rank – Ease of Doing Business
8.1.6. Global Rank – Trading Across Borders
8.2. Impact of COVID-19 on the Food & Beverage Industry
8.2.1. Manufacturer/Processors
8.2.2. Supply Chain and Logistics
8.2.3. Wholesalers/Traders
8.2.4. Retailers
8.3. COVID-19 Risk Assessment/Impact
8.4. Global Food & Beverage Industry Outlook
8.5. Global Nutraceutical Industry Outlook
8.6. Global Animal Feed Industry Outlook
8.7. Perceived Benefits of Dietary Fibers
8.8. Industry Value and Supply Chain Analysis
8.8.1. Profit Margin Analysis at each point of sales
8.8.1.1. Manufacturers/ Processors
8.8.1.2. Distributors/Suppliers/Wholesalers
8.8.1.3. Traders/Retailers
8.8.1.4. End-Users
8.9. Key Certifications/Regulations
8.10. Market Dynamics
8.10.1. Drivers
8.10.2. Restraints
8.10.3. Opportunity Analysis
8.11. Forecast Factors - Relevance & Impact
9. Global Inulin Market Analysis 2016–2020 and Forecast 2021–2031, By Nature
9.1. Introduction / Key Findings
9.2. Historical Market Source (US$ Mn) and Volume Analysis By Nature, 2016–2020
9.3. Current and Future Market Source (US$ Mn) and Volume Analysis and Forecast By Nature, 2021–2031
9.3.1. Organic
9.3.2. Conventional
9.4. Market Attractiveness Analysis By Nature
10. Global Inulin Market Analysis 2016–2020 and Forecast 2021–2031, By Source
10.1. Introduction / Key Findings
10.2. Historical Market Source (US$ Mn) and Volume Analysis By Source, 2016–2020
10.3. Current and Future Market Source (US$ Mn) and Volume Analysis and Forecast By Source, 2021–2031
10.3.1. Agave
10.3.2. Chicory
10.3.3. Jerusalem Artichoke
10.3.4. Others
10.4. Market Attractiveness Analysis By Source
11. Global Inulin Market Analysis 2016–2020 and Forecast 2021–2031, By Form
11.1. Introduction / Key Findings
11.2. Historical Market Source (US$ Mn) and Volume Analysis By Form, 2016–2020
11.3. Current and Future Market Source (US$ Mn) and Volume Analysis and Forecast By Form, 2021–2031
11.3.1. Powder
11.3.2. Liquid
11.4. Market Attractiveness Analysis By Form
12. Global Inulin Market Analysis 2016–2020 and Forecast 2021–2031, By Application
12.1. Introduction / Key Findings
12.2. Historical Market Source (US$ Mn) and Volume Analysis By Application, 2016–2020
12.3. Current and Future Market Source (US$ Mn) and Volume Analysis and Forecast By Application, 2021–2031
12.3.1. Food & Beverages
12.3.1.1. Bakery & Confectionery
12.3.1.2. Dairy Products
12.3.1.3. Meat Products
12.3.1.4. Snacks & Cereals
12.3.1.5. Others
12.3.2. Nutraceutical
12.3.3. Pharmaceutical
12.3.4. Animal Feed
12.4. Market Attractiveness Analysis By Application
13. Global Inulin Market Analysis 2016–2020 and Forecast 2021–2031, by Region
13.1. Introduction
13.2. Historical Market Source (US$ Mn) and Volume Analysis By Region, 2016–2020
13.3. Current Market Source (US$ Mn) and Volume Analysis and Forecast By Region, 2021–2031
13.3.1. North America
13.3.2. Latin America
13.3.3. Europe
13.3.4. East Asia
13.3.5. South Asia
13.3.6. Oceania
13.3.7. Middle East and Africa (MEA)
13.4. Market Attractiveness Analysis By Region
14. North America Inulin Market Analysis 2016–2020 and Forecast 2021–2031
14.1. Introduction
14.2. Historical Market Source (US$ Mn) Trend Analysis By Market Taxonomy, 2016–2020
14.3. Market Source (US$ Mn) Forecast By Market Taxonomy, 2021–2031
14.3.1. By Country
14.3.1.1. U.S.
14.3.1.2. Canada
14.3.2. By Nature
14.3.3. By Source
14.3.4. By Form
14.3.5. By Application
14.4. Market Attractiveness Analysis
14.4.1. By Country
14.4.2. By Nature
14.4.3. By Source
14.4.4. By Form
14.4.5. By Application
14.5. Drivers and Restraints - Impact Analysis
15. Latin America Inulin Market Analysis 2016–2020 and Forecast 2021–2031
15.1. Introduction
15.2. Historical Market Source (US$ Mn) Trend Analysis By Market Taxonomy, 2016–2020
15.3. Market Source (US$ Mn) Forecast By Market Taxonomy, 2021–2031
15.3.1. By Country
15.3.1.1. Brazil
15.3.1.2. Mexico
15.3.1.3. Rest of Latin America
15.3.2. By Nature
15.3.3. By Source
15.3.4. By Form
15.3.5. By Application
15.4. Market Attractiveness Analysis
15.4.1. By Country
15.4.2. By Nature
15.4.3. By Source
15.4.4. By Form
15.4.5. By Application
15.5. Drivers and Restraints - Impact Analysis
16. Europe Inulin Market Analysis 2016–2020 and Forecast 2021–2031
16.1. Introduction
16.2. Historical Market Source (US$ Mn) Trend Analysis By Market Taxonomy, 2016–2020
16.3. Market Source (US$ Mn) Forecast By Market Taxonomy, 2021–2031
16.3.1. By Country
16.3.1.1. Germany
16.3.1.2. Italy
16.3.1.3. France
16.3.1.4. U.K.
16.3.1.5. Spain
16.3.1.6. BENELUX
16.3.1.7. Nordic
16.3.1.8. Russia
16.3.1.9. Poland
16.3.1.10. Rest of Europe
16.3.2. By Nature
16.3.3. By Source
16.3.4. By Form
16.3.5. By Application
16.4. Market Attractiveness Analysis
16.4.1. By Country
16.4.2. By Nature
16.4.3. By Source
16.4.4. By Form
16.4.5. By Application
16.5. Drivers and Restraints - Impact Analysis
17. South Asia Inulin Market Analysis 2016–2020 and Forecast 2021–2031
17.1. Introduction
17.2. Historical Market Source (US$ Mn) Trend Analysis By Market Taxonomy, 2016–2020
17.3. Market Source (US$ Mn) Forecast By Market Taxonomy, 2021–2031
17.3.1. By Country
17.3.1.1. India
17.3.1.2. Thailand
17.3.1.3. Indonesia
17.3.1.4. Malaysia
17.3.1.5. Rest of South Asia
17.3.2. By Nature
17.3.3. By Source
17.3.4. By Form
17.3.5. By Application
17.4. Market Attractiveness Analysis
17.4.1. By Country
17.4.2. By Nature
17.4.3. By Source
17.4.4. By Form
17.4.5. By Application
17.5. Drivers and Restraints - Impact Analysis
18. East Asia Inulin Market Analysis 2016–2020 and Forecast 2021–2031
18.1. Introduction
18.2. Historical Market Source (US$ Mn) Trend Analysis By Market Taxonomy, 2016–2020
18.3. Market Source (US$ Mn) Forecast By Market Taxonomy, 2021–2031
18.3.1. By Country
18.3.1.1. China
18.3.1.2. Japan
18.3.1.3. South Korea
18.3.2. By Nature
18.3.3. By Source
18.3.4. By Form
18.3.5. By Application
18.4. Market Attractiveness Analysis
18.4.1. By Country
18.4.2. By Nature
18.4.3. By Source
18.4.4. By Form
18.4.5. By Application
18.5. Drivers and Restraints - Impact Analysis
19. Oceania Inulin Market Analysis 2016–2020 and Forecast 2021–2031
19.1. Introduction
19.2. Historical Market Source (US$ Mn) Trend Analysis By Market Taxonomy, 2016–2020
19.3. Market Source (US$ Mn) Forecast By Market Taxonomy, 2021–2031
19.3.1. By Country
19.3.1.1. Australia
19.3.1.2. New Zealand
19.3.2. By Nature
19.3.3. By Source
19.3.4. By Form
19.3.5. By Application
19.4. Market Attractiveness Analysis
19.4.1. By Country
19.4.2. By Nature
19.4.3. By Source
19.4.4. By Form
19.4.5. By Application
19.5. Drivers and Restraints - Impact Analysis
20. Middle East and Africa Inulin Market Analysis 2016–2020 and Forecast 2021–2031
20.1. Introduction
20.2. Historical Market Source (US$ Mn) Trend Analysis By Market Taxonomy, 2016–2020
20.3. Market Source (US$ Mn) Forecast By Market Taxonomy, 2021–2031
20.3.1. By Country
20.3.1.1. GCC Countries
20.3.1.2. Turkey
20.3.1.3. South Africa
20.3.1.4. Rest of Middle East and Africa
20.3.2. By Nature
20.3.3. By Source
20.3.4. By Form
20.3.5. By Application
20.4. Market Attractiveness Analysis
20.4.1. By Country
20.4.2. By Nature
20.4.3. By Source
20.4.4. By Form
20.4.5. By Application
20.5. Drivers and Restraints - Impact Analysis
21. Market Structure Analysis
21.1. Market Analysis by Tier of Companies
21.2. Market Concentration
21.3. Market Presence Analysis
22. Competition Analysis
22.1. Competition Dashboard
22.2. Competition Deep Dive
22.2.1. Ingredion Incorporated
22.2.1.1. Overview
22.2.1.2. Product Portfolio
22.2.1.3. Production Footprint
22.2.1.4. Sales Footprint
22.2.1.5. Strategy Overview
22.2.2. Archer Daniels Midland Company
22.2.2.1. Overview
22.2.2.2. Product Portfolio
22.2.2.3. Production Footprint
22.2.2.4. Sales Footprint
22.2.2.5. Strategy Overview
22.2.3. Cargill, Incorporated
22.2.3.1. Overview
22.2.3.2. Product Portfolio
22.2.3.3. Production Footprint
22.2.3.4. Sales Footprint
22.2.3.5. Strategy Overview
22.2.4. BENEO
22.2.4.1. Overview
22.2.4.2. Product Portfolio
22.2.4.3. Production Footprint
22.2.4.4. Sales Footprint
22.2.4.5. Strategy Overview
22.2.5. Tereos S.A.
22.2.5.1. Overview
22.2.5.2. Product Portfolio
22.2.5.3. Production Footprint
22.2.5.4. Sales Footprint
22.2.5.5. Strategy Overview
22.2.6. Nexira
22.2.6.1. Overview
22.2.6.2. Product Portfolio
22.2.6.3. Production Footprint
22.2.6.4. Sales Footprint
22.2.6.5. Strategy Overview
22.2.7. COSUCRA
22.2.7.1. Overview
22.2.7.2. Product Portfolio
22.2.7.3. Production Footprint
22.2.7.4. Sales Footprint
22.2.7.5. Strategy Overview
22.2.8. NOW Health Group, Inc.
22.2.8.1. Overview
22.2.8.2. Product Portfolio
22.2.8.3. Production Footprint
22.2.8.4. Sales Footprint
22.2.8.5. Strategy Overview
22.2.9. Others (On Additional Request)
23. Assumptions and Acronyms Used
24. Research Methodology
List of Tables
Table 01: Global Inulin Market Value (US$ Mn) Analysis and Forecast by Nature, 2016-2031
Table 02: Global Inulin Market Volume (Ton) Analysis and Forecast by Nature, 2016-2031
Table 03: Global Inulin Market Value (US$ Mn) Analysis and Forecast by Source, 2016-2031
Table 04: Global Inulin Market Volume (Ton) Analysis and Forecast by Source, 2016-2031
Table 05: Global Inulin Market Value (US$ Mn) Analysis and Forecast by Form, 2016-2031
Table 06: Global Inulin Market Volume (Ton) Analysis and Forecast by Form, 2016-2031
Table 07: Global Inulin Market Value (US$ Mn) Analysis and Forecast by Application, 2016-2031
Table 08: Global Inulin Market Volume (Ton) Analysis and Forecast by Application, 2016-2031
Table 09: Global Inulin Market Value (US$ Mn) Analysis and Forecast by Food & Beverage Segment, 2016-2031
Table 10: Global Inulin Market Volume (Ton) Analysis and Forecast by Food & Beverage Segment, 2016-2031
Table 11: Global Inulin Market Value (US$ Mn) Analysis and Forecast by Region, 2016-2031
Table 12: Global Inulin Market Volume (Ton) Analysis and Forecast by Region, 2016-2031
Table 13: North America Inulin Market Value (US$ Mn) Analysis and Forecast by Nature, 2016-2031
Table 14: North America Inulin Market Volume (Ton) Analysis and Forecast by Nature, 2016-2031
Table 15: North America Inulin Market Value (US$ Mn) Analysis and Forecast by Form, 2016-2031
Table 16: North America Inulin Market Volume (Ton) Analysis and Forecast by Form, 2016-2031
Table 17: North America Inulin Market Value (US$ Mn) Analysis and Forecast by Source, 2016-2031
Table 18: North America Inulin Market Volume (Ton) Analysis and Forecast by Source, 2016-2031
Table 19: North America Inulin Market Value (US$ Mn) Analysis and Forecast by Application, 2016-2031
Table 20: North America Inulin Market Volume (Ton) Analysis and Forecast by Application, 2016-2031
Table 21: North America Inulin Market Value (US$ Mn) Analysis and Forecast by Food & Beverages, 2016-2031
Table 22: North America Inulin Market Volume (Ton) Analysis and Forecast by Food & Beverages, 2016-2031
Table 23: North America Inulin Market Value (US$ Mn) Analysis and Forecast by Country, 2016-2031
Table 24: North America Inulin Market Volume (Ton) Analysis and Forecast by Country, 2016-2031
Table 25: Latin America Inulin Market Value (US$ Mn) Analysis and Forecast by Nature, 2016-2031
Table 26: Latin America Inulin Market Volume (Ton) Analysis and Forecast by Nature, 2016-2031
Table 27: Latin America Inulin Market Value (US$ Mn) Analysis and Forecast by Source, 2016-2031
Table 28: Latin America Inulin Market Volume (Ton) Analysis and Forecast by Source, 2016-2031
Table 29: Latin America Inulin Market Value (US$ Mn) Analysis and Forecast by Form, 2016-2031
Table 30: Latin America Inulin Market Volume (Ton) Analysis and Forecast by Form, 2016-2031
Table 31: Latin America Inulin Market Value (US$ Mn) Analysis and Forecast by Application, 2016-2031
Table 32: Latin America Inulin Market Volume (Ton) Analysis and Forecast by Application, 2016-2031
Table 33: Latin America Inulin Market Value (US$ Mn) Analysis and Forecast by Food & Beverages, 2016-2031
Table 34: Latin America Inulin Market Volume (Ton) Analysis and Forecast by Food & Beverages, 2016-2031
Table 35: Latin America Inulin Market Value (US$ Mn) Analysis and Forecast by Country, 2016-2031
Table 36: Latin America Inulin Market Volume (Ton) Analysis and Forecast by Country, 2016-2031
Table 37: Europe Inulin Market Value (US$ Mn) Analysis and Forecast by Nature, 2016-2031
Table 38: Europe Inulin Market Volume (Ton) Analysis and Forecast by Nature, 2016-2031
Table 39: Europe Inulin Market Value (US$ Mn) Analysis and Forecast by Source, 2016-2031
Table 40: Europe Inulin Market Volume (Ton) Analysis and Forecast by Source, 2016-2031
Table 41: Europe Inulin Market Value (US$ Mn) Analysis and Forecast by Form, 2016-2031
Table 42: Europe Inulin Market Volume (Ton) Analysis and Forecast by Form, 2016-2031
Table 43: Europe Inulin Market Value (US$ Mn) Analysis and Forecast by Application, 2016-2031
Table 44: Europe Inulin Market Volume (Ton) Analysis and Forecast by Application, 2016-2031
Table 45: Europe Inulin Market Value (US$ Mn) Analysis and Forecast by Food & Beverages, 2016-2031
Table 46: Europe Inulin Market Volume (Ton) Analysis and Forecast by Food & Beverages, 2016-2031
Table 47: Europe Inulin Market Value (US$ Mn) Analysis and Forecast by Country, 2016-2031
Table 48: Europe Inulin Market Volume (Ton) Analysis and Forecast by Country, 2016-2031
Table 49: South Asia Inulin Market Value (US$ Mn) Analysis and Forecast by Nature, 2016-2031
Table 50: South Asia Inulin Market Volume (Ton) Analysis and Forecast by Nature, 2016-2031
Table 51: South Asia Inulin Market Value (US$ Mn) Analysis and Forecast by Source, 2016-2031
Table 52: South Asia Inulin Market Volume (Ton) Analysis and Forecast by Source, 2016-2031
Table 53: South Asia Inulin Market Value (US$ Mn) Analysis and Forecast by Form, 2016-2031
Table 54: South Asia Inulin Market Volume (Ton) Analysis and Forecast by Form, 2016-2031
Table 55: South Asia Inulin Market Value (US$ Mn) Analysis and Forecast by Application, 2016-2031
Table 56: South Asia Inulin Market Volume (Ton) Analysis and Forecast by Application, 2016-2031
Table 57: South Asia Inulin Market Value (US$ Mn) Analysis and Forecast by Food & Beverages, 2016-2031
Table 58: South Asia Inulin Market Volume (Ton) Analysis and Forecast by Food & Beverages, 2016-2031
Table 59: South Asia Inulin Market Value (US$ Mn) Analysis and Forecast by Country, 2016-2031
Table 60: South Asia Inulin Market Volume (Ton) Analysis and Forecast by Country, 2016-2031
Table 61: East Asia Inulin Market Value (US$ Mn) Analysis and Forecast by Nature, 2016-2031
Table 62: East Asia Inulin Market Volume (Ton) Analysis and Forecast by Nature, 2016-2031
Table 63: East Asia Inulin Market Value (US$ Mn) Analysis and Forecast by Source, 2016-2031
Table 64: East Asia Inulin Market Volume (Ton) Analysis and Forecast by Source, 2016-2031
Table 65: East Asia Inulin Market Value (US$ Mn) Analysis and Forecast by Form, 2016-2031
Table 66: East Asia Inulin Market Volume (Ton) Analysis and Forecast by Form, 2016-2031
Table 67: East Asia Inulin Market Value (US$ Mn) Analysis and Forecast by Application, 2016-2031
Table 68: East Asia Inulin Market Volume (Ton) Analysis and Forecast by Application, 2016-2031
Table 69: East Asia Inulin Market Value (US$ Mn) Analysis and Forecast by Food & Beverages, 2016-2031
Table 70: East Asia Inulin Market Volume (Ton) Analysis and Forecast by Food & Beverages, 2016-2031
Table 71: East Asia Inulin Market Value (US$ Mn) Analysis and Forecast by Country, 2016-2031
Table 72: East Asia Inulin Market Volume (Ton) Analysis and Forecast by Country, 2016-2031
Table 73: Oceania Inulin Market Value (US$ Mn) Analysis and Forecast by Nature, 2016-2031
Table 74: Oceania Inulin Market Volume (Ton) Analysis and Forecast by Nature, 2016-2031
Table 75: Oceania Inulin Market Value (US$ Mn) Analysis and Forecast by Source, 2016-2031
Table 76: Oceania Inulin Market Volume (Ton) Analysis and Forecast by Source, 2016-2031
Table 77: Oceania Inulin Market Value (US$ Mn) Analysis and Forecast by Form, 2016-2031
Table 78: Oceania Inulin Market Volume (Ton) Analysis and Forecast by Form, 2016-2031
Table 79: Oceania Inulin Market Value (US$ Mn) Analysis and Forecast by Application, 2016-2031
Table 80: Oceania Inulin Market Volume (Ton) Analysis and Forecast by Application, 2016-2031
Table 81: Oceania Inulin Market Value (US$ Mn) Analysis and Forecast by Food & Beverages, 2016-2031
Table 82: Oceania Inulin Market Volume (Ton) Analysis and Forecast by Food & Beverages, 2016-2031
Table 83: Oceania Inulin Market Value (US$ Mn) Analysis and Forecast by Country, 2016-2031
Table 84: Oceania Inulin Market Volume (Ton) Analysis and Forecast by Country, 2016-2031
Table 85: Middle East & Africa Inulin Market Value (US$ Mn) Analysis and Forecast by Nature, 2016-2031
Table 86: Middle East & Africa Inulin Market Volume (Ton) Analysis and Forecast by Nature, 2016-2031
Table 87: Middle East & Africa Inulin Market Value (US$ Mn) Analysis and Forecast by Source, 2016-2031
Table 88: Middle East & Africa Inulin Market Volume (Ton) Analysis and Forecast by Source, 2016-2031
Table 89: Middle East & Africa Inulin Market Value (US$ Mn) Analysis and Forecast by Form, 2016-2031
Table 90: Middle East & Africa Inulin Market Volume (Ton) Analysis and Forecast by Form, 2016-2031
Table 91: Middle East & Africa Inulin Market Value (US$ Mn) Analysis and Forecast by Application, 2016-2031
Table 92: Middle East & Africa Inulin Market Volume (Ton) Analysis and Forecast by Application, 2016-2031
Table 93: Middle East & Africa Inulin Market Value (US$ Mn) Analysis and Forecast by Food & Beverages, 2016-2031
Table 94: Middle East & Africa Inulin Market Volume (Ton) Analysis and Forecast by Food & Beverages, 2016-2031
Table 95: Middle East & Africa Inulin Market Value (US$ Mn) Analysis and Forecast by Country, 2016-2031
Table 96: Middle East & Africa Inulin Market Volume (Ton) Analysis and Forecast by Country, 2016-2031
List of Figures
Figure 01: Global Inulin Market Value (US$ Mn) Forecast, 2021–2031
Figure 02: Global Inulin Market Volume (Tons) Forecast, 2021–2031
Figure 03: Global Inulin Market Value Share Analysis by Nature, 2021 E
Figure 04: Global Inulin Market Y-o-Y Growth Rate by Nature, 2021-2031
Figure 05: Global Inulin Market Value (US$ Mn) Analysis & Forecast by Nature, 2021–2031
Figure 06: Global Inulin Market Volume (Ton) Analysis & Forecast by Nature, 2021–2031
Figure 07: Global Inulin Market Value Share Analysis by Source, 2021 E
Figure 08: Global Inulin Market Y-o-Y Growth Rate by Source, 2021-2031
Figure 09: Global Inulin Market Value (US$ Mn) Analysis & Forecast by Source, 2021–2031
Figure 10: Global Inulin Market Volume (Ton) Analysis & Forecast by Source, 2021–2031
Figure 11: Global Inulin Market Value Share Analysis by Form, 2021 E
Figure 12: Global Inulin Market Y-o-Y Growth Rate by Form, 2021-2031
Figure 13: Global Inulin Market Value (US$ Mn) Analysis & Forecast by Form, 2021–2031
Figure 14: Global Inulin Market Volume (Ton) Analysis & Forecast by Form, 2021–2031
Figure 15: Global Inulin Market Value Share Analysis by Application, 2021 E
Figure 16: Global Inulin Market Y-o-Y Growth Rate by Application, 2021-2031
Figure 17: Global Inulin Market Value (US$ Mn) Analysis & Forecast by Application, 2021–2031
Figure 18: Global Inulin Market Volume (Ton) Analysis & Forecast by Application, 2021–2031
Figure 19: Global Inulin Market Value Share Analysis by Region, 2021 E
Figure 20: Global Inulin Market Y-o-Y Growth Rate by Region, 2021-2031
Figure 21: Global Inulin Market Value (US$ Mn) Analysis & Forecast by Region, 2021–2031
Figure 22: Global Inulin Market Volume (Ton) Analysis & Forecast by Region, 2021–2031
Figure 23: Global Inulin Market Attractiveness Analysis by Region, 2021-2031
Figure 24: Global Inulin Market Attractiveness Analysis by Nature, 2021-2031
Figure 25: Global Inulin Market Attractiveness Analysis by Source, 2021-2031
Figure 26: Global Inulin Market Attractiveness Analysis by Form, 2021-2031
Figure 27: Global Inulin Market Attractiveness Analysis by Application, 2021-2031
Figure 28: North America Inulin Market Value (US$ Mn) Analysis & Forecast by Nature, 2021–2031
Figure 29: North America Inulin Market Volume (Ton) Analysis & Forecast by Nature, 2021–2031
Figure 30: North America Inulin Market Value (US$ Mn) Analysis & Forecast by Form, 2021–2031
Figure 31: North America Inulin Market Volume (Ton) Analysis & Forecast by Form, 2021–2031
Figure 32: North America Inulin Market Value (US$ Mn) Analysis & Forecast by Source, 2021–2031
Figure 33: North America Inulin Market Volume (Ton) Analysis & Forecast by Source, 2021–2031
Figure 34: North America Inulin Market Value (US$ Mn) Analysis & Forecast by Application, 2021–2031
Figure 35: North America Inulin Market Volume (Ton) Analysis & Forecast by Application, 2021–2031
Figure 36: North America Inulin Market Value (US$ Mn) Analysis & Forecast by Country, 2021–2031
Figure 37: North America Inulin Market Volume (Ton) Analysis & Forecast by Country, 2021–2031
Figure 38: North America Inulin Market Attractiveness Analysis by Country, 2021-2031
Figure 39: North America Inulin Market Attractiveness Analysis by Nature, 2021-2031
Figure 40: North America Inulin Market Attractiveness Analysis by Source, 2021-2031
Figure 41: North America Inulin Market Attractiveness Analysis by Form, 2021-2031
Figure 42: North America Inulin Market Attractiveness Analysis by Application, 2021-2031
Figure 43: Latin America Inulin Market Value (US$ Mn) Analysis & Forecast by Nature, 2021–2031
Figure 44: Latin America Inulin Market Volume (Ton) Analysis & Forecast by Nature, 2021–2031
Figure 45: Latin America Inulin Market Value (US$ Mn) Analysis & Forecast by Source, 2021–2031
Figure 46: Latin America Inulin Market Volume (Ton) Analysis & Forecast by Source, 2021–2031
Figure 47: Latin America Inulin Market Value (US$ Mn) Analysis & Forecast by Form, 2021–2031
Figure 48: Latin America Inulin Market Volume (Ton) Analysis & Forecast by Form, 2021–2031
Figure 49: Latin America Inulin Market Value (US$ Mn) Analysis & Forecast by Application, 2021–2031
Figure 50: Latin America Inulin Market Volume (Ton) Analysis & Forecast by Application, 2021–2031
Figure 51: Latin America Inulin Market Value (US$ Mn) Analysis & Forecast by Country, 2021–2031
Figure 52: Latin America Inulin Market Volume (Ton) Analysis & Forecast by Country, 2021–2031
Figure 53: Latin America Inulin Market Attractiveness Analysis by Country, 2021-2031
Figure 54: Latin America Inulin Market Attractiveness Analysis by Nature, 2021-2031
Figure 55: Latin America Inulin Market Attractiveness Analysis by Source, 2021-2031
Figure 56: Latin America Inulin Market Attractiveness Analysis by Form, 2021-2031
Figure 57: Latin America Inulin Market Attractiveness Analysis by Application, 2021-2031
Figure 58: Europe Inulin Market Value (US$ Mn) Analysis & Forecast by Nature, 2021–2031
Figure 59: Europe Inulin Market Volume (Ton) Analysis & Forecast by Nature, 2021–2031
Figure 60: Europe Inulin Market Value (US$ Mn) Analysis & Forecast by Source, 2021–2031
Figure 61: Europe Inulin Market Volume (Ton) Analysis & Forecast by Source, 2021–2031
Figure 62: Europe Inulin Market Value (US$ Mn) Analysis & Forecast by Form, 2021–2031
Figure 63: Europe Inulin Market Volume (Ton) Analysis & Forecast by Form, 2021–2031
Figure 64: Europe Inulin Market Value (US$ Mn) Analysis & Forecast by Application, 2021–2031
Figure 65: Europe Inulin Market Volume (Ton) Analysis & Forecast by Application, 2021–2031
Figure 66: Europe Inulin Market Value (US$ Mn) Analysis & Forecast by Country, 2021–2031
Figure 67: Europe Inulin Market Volume (Ton) Analysis & Forecast by Country, 2021–2031
Figure 68: Europe Inulin Market Attractiveness Analysis by Country, 2021-2031
Figure 69: Europe Inulin Market Attractiveness Analysis by Nature, 2021-2031
Figure 70: Europe Inulin Market Attractiveness Analysis by Source, 2021-2031
Figure 71: Europe Inulin Market Attractiveness Analysis by Form, 2021-2031
Figure 72: Europe Inulin Market Attractiveness Analysis by Application, 2021-2031
Figure 73: South Asia Inulin Market Value (US$ Mn) Analysis & Forecast by Nature, 2021–2031
Figure 74: South Asia Inulin Market Volume (Ton) Analysis & Forecast by Nature, 2021–2031
Figure 75: South Asia Inulin Market Value (US$ Mn) Analysis & Forecast by Source, 2021–2031
Figure 76: South Asia Inulin Market Volume (Ton) Analysis & Forecast by Source, 2021–2031
Figure 77: South Asia Inulin Market Value (US$ Mn) Analysis & Forecast by Form, 2021–2031
Figure 78: South Asia Inulin Market Volume (Ton) Analysis & Forecast by Form, 2021–2031
Figure 79: South Asia Inulin Market Value (US$ Mn) Analysis & Forecast by Application, 2021–2031
Figure 80: South Asia Inulin Market Volume (Ton) Analysis & Forecast by Application, 2021–2031
Figure 81: South Asia Inulin Market Value (US$ Mn) Analysis & Forecast by Country, 2021–2031
Figure 82: South Asia Inulin Market Volume (Ton) Analysis & Forecast by Country, 2021–2031
Figure 83: South Asia Inulin Market Attractiveness Analysis by Country, 2021-2031
Figure 84: South Asia Inulin Market Attractiveness Analysis by Nature, 2021-2031
Figure 85: South Asia Inulin Market Attractiveness Analysis by Source, 2021-2031
Figure 86: South Asia Inulin Market Attractiveness Analysis by Form, 2021-2031
Figure 87: South Asia Inulin Market Attractiveness Analysis by Application, 2021-2031
Figure 88: East Asia Inulin Market Value (US$ Mn) Analysis & Forecast by Nature, 2021–2031
Figure 89: East Asia Inulin Market Volume (Ton) Analysis & Forecast by Nature, 2021–2031
Figure 90: East Asia Inulin Market Value (US$ Mn) Analysis & Forecast by Source, 2021–2031
Figure 91: East Asia Inulin Market Volume (Ton) Analysis & Forecast by Source, 2021–2031
Figure 92: East Asia Inulin Market Value (US$ Mn) Analysis & Forecast by Form, 2021–2031
Figure 93: East Asia Inulin Market Volume (Ton) Analysis & Forecast by Form, 2021–2031
Figure 94: East Asia Inulin Market Value (US$ Mn) Analysis & Forecast by Application, 2021–2031
Figure 95: East Asia Inulin Market Volume (Ton) Analysis & Forecast by Application, 2021–2031
Figure 96: East Asia Inulin Market Value (US$ Mn) Analysis & Forecast by Country, 2021–2031
Figure 97: East Asia Inulin Market Volume (Ton) Analysis & Forecast by Country, 2021–2031
Figure 98: East Asia Inulin Market Attractiveness Analysis by Country, 2021-2031
Figure 99: East Asia Inulin Market Attractiveness Analysis by Nature, 2021-2031
Figure 100: East Asia Inulin Market Attractiveness Analysis by Source, 2021-2031
Figure 101: East Asia Inulin Market Attractiveness Analysis by Form, 2021-2031
Figure 102: East Asia Inulin Market Attractiveness Analysis by Application, 2021-2031
Figure 103: Oceania Inulin Market Value (US$ Mn) Analysis & Forecast by Nature, 2021–2031
Figure 104: Oceania Inulin Market Volume (Ton) Analysis & Forecast by Nature, 2021–2031
Figure 105: Oceania Inulin Market Value (US$ Mn) Analysis & Forecast by Source, 2021–2031
Figure 106: Oceania Inulin Market Volume (Ton) Analysis & Forecast by Source, 2021–2031
Figure 107: Oceania Inulin Market Value (US$ Mn) Analysis & Forecast by Form, 2021–2031
Figure 108: Oceania Inulin Market Volume (Ton) Analysis & Forecast by Form, 2021–2031
Figure 109: Oceania Inulin Market Value (US$ Mn) Analysis & Forecast by Application, 2021–2031
Figure 110: Oceania Inulin Market Volume (Ton) Analysis & Forecast by Application, 2021–2031
Figure 111: Oceania Inulin Market Value (US$ Mn) Analysis & Forecast by Country, 2021–2031
Figure 112: Oceania Inulin Market Volume (Ton) Analysis & Forecast by Country, 2021–2031
Figure 113: Oceania Inulin Market Attractiveness Analysis by Country, 2021-2031
Figure 114: Oceania Inulin Market Attractiveness Analysis by Nature, 2021-2031
Figure 115: Oceania Inulin Market Attractiveness Analysis by Source, 2021-2031
Figure 116: Oceania Inulin Market Attractiveness Analysis by Form, 2021-2031
Figure 117: Oceania Inulin Market Attractiveness Analysis by Application, 2021-2031
Figure 118: Middle East & Africa Inulin Market Value (US$ Mn) Analysis & Forecast by Nature, 2021–2031
Figure 119: Middle East & Africa Inulin Market Volume (Ton) Analysis & Forecast by Nature, 2021–2031
Figure 120: Middle East & Africa Inulin Market Value (US$ Mn) Analysis & Forecast by Source, 2021–2031
Figure 121: Middle East & Africa Inulin Market Volume (Ton) Analysis & Forecast by Source, 2021–2031
Figure 122: Middle East & Africa Inulin Market Value (US$ Mn) Analysis & Forecast by Form, 2021–2031
Figure 123: Middle East & Africa Inulin Market Volume (Ton) Analysis & Forecast by Form, 2021–2031
Figure 124: Middle East & Africa Inulin Market Value (US$ Mn) Analysis & Forecast by Application, 2021–2031
Figure 125: Middle East & Africa Inulin Market Volume (Ton) Analysis & Forecast by Application, 2021–2031
Figure 126: Middle East & Africa Inulin Market Value (US$ Mn) Analysis & Forecast by Country, 2021–2031
Figure 127: Middle East & Africa Inulin Market Volume (Ton) Analysis & Forecast by Country, 2021–2031
Figure 128: Middle East & Africa Inulin Market Attractiveness Analysis by Country, 2021-2031
Figure 129: Middle East & Africa Inulin Market Attractiveness Analysis by Nature, 2021-2031
Figure 130: Middle East & Africa Inulin Market Attractiveness Analysis by Source, 2021-2031
Figure 131: Middle East & Africa Inulin Market Attractiveness Analysis by Form, 2021-2031
Figure 132: Middle East & Africa Inulin Market Attractiveness Analysis by Application, 2021-2031
Copyright © Transparency Market Research, Inc. All Rights reserved
Trust Online

Inulin Market