
Reports
Reports
Phosphorus Trichloride Market – Snapshot
Phosphorus trichloride is a colorless or slightly yellow fuming liquid. It possesses pungent odor, similar to that of hydrochloric acid. It is primarily utilized as a chemical intermediate in the manufacture of agrochemicals and flame retardants. Phosphorus trichloride is also used as a plasticizer in plastic manufacturing. It is employed in agrochemicals. Rise in population and urbanization is driving the agricultural industry. This, in turn, is fueling the demand for mineral fertilizer-containing phosphorus. Phosphorus trichloride is also used as an intermediate in the manufacture of chemicals such as triphenylphosphine and phosphites. Expansion in the global chemicals industry is expected to drive the demand for phosphorus trichloride as an intermediate during the forecast period.
Pure grade has phosphorus concentration of 96% to 99% and is of lower purity than the analytical reagent grade. It is the commonly used grade of phosphorus trichloride. The pure segment accounted for leading share of the global phosphorus trichloride market in 2018. The segment is estimated to maintain its dominance during the forecast period. The analytical reagent grade constitutes small share of the global market in terms of demand. The grade is expensive considering its high purity. The segment is anticipated to expand at a rapid pace during the forecast period. The analytical reagent segment is expected to create lucrative opportunities in the phosphorus trichloride market during the forecast period due to its emerging applications in the pharmaceutical industry.
In terms of application, the global phosphorus trichloride market has been segmented into phosphorus oxychloride, chemical intermediates, agrochemicals, plasticizers, pharmaceuticals, and others (including surfactants, oil additives, and dyestuffs). The agrochemicals segment holds the dominant share of the global phosphorus trichloride market. The segment is expected to maintain its dominance during the forecast period. The agrochemicals segment is anticipated to be attractive in terms for growth rate during the forecast period due to the rise in consumption of pesticides and herbicides across the globe. Phosphorus oxychloride and plasticizers are also likely to be high-potential segments of the global phosphorus trichloride market during the forecast period. Phosphorus trichloride is a favored and effective agent used in the manufacture of flame retardants and plasticizers.
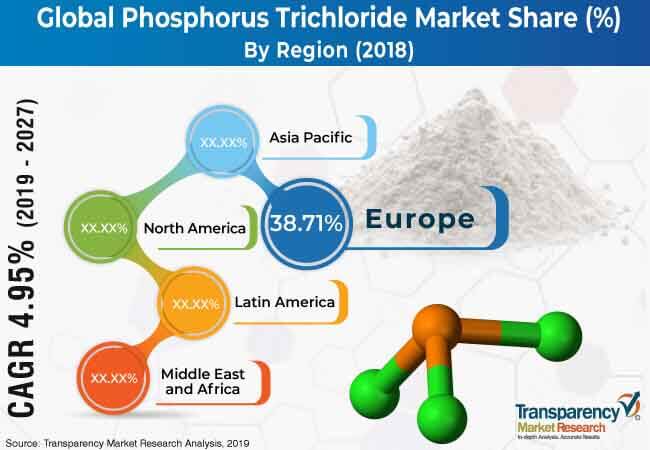
Based on region, the global phosphorus trichloride market can be divided into North America, Europe, Asia Pacific, Middle East & Africa, and Latin America. Asia Pacific was the dominant region of the global phosphorus trichloride market in 2018. It is also a leading producer of phosphorus trichloride with most of the production concentrated in China. Presence of large numbers of producers of phosphorus trichloride in China has boosted the market in the country. Demand for phosphorus trichloride in Europe is projected to rise at a sluggish pace due to mature nature of the market. Demand for phosphorus trichloride in North America is expected to rise at a moderate pace during the forecast period due to increase in the demand for agrochemicals in the region. The market in Latin America is estimated to expand at a rapid pace during the forecast period, led by the rise in demand for phosphorus trichloride in the agrochemicals segment.
Phosphorus trichloride is a fragmented market. Many large as well as medium scale manufacturers operate in the market. Key players operating in the market are Monsanto Company, Syngenta, Mosaic Company, Solvay SA, and Akzo Nobel N.V. Most of these players prefer captive consumption of phosphorus trichloride. Market players have been profiled in terms of company overview, business strategies, and recent developments.
Rising Demand for Quality Level Pesticides will Augment Phosphorus Trichloride Market Growth
Phosphorus trichloride is used as a pesticide halfway. The compound is generally utilized in the creation of organ phosphorus pesticides, for example, glyphosate. Glyphosate is a functioning constituent of different herbicides, insect poisons, and fungicides. The agrochemical application fragment held a predominant portion of the worldwide phosphorus trichloride market in 2018. Rising populace requires improved cultivating effectiveness to take into account the appeal for horticultural items. Also, legislatures of nations, like India, have executed appropriations to diminish the expense weight of pesticides on ranchers. This, thusly, has empowered the use of pesticides. Development of the pesticides business in China is additionally advanced by fares of pesticide-dynamic fixings and expanded homegrown creation of detailed pesticides.
The energy needed for mining and handling of phosphate rock and for creation of manures got from phosphorus is typically sourced from petroleum products. This prompts extra ozone depleting substance (GHG) discharges, contracting non-renewable energy source assets, and contamination. Since both petroleum products and phosphorus are non-inexhaustible and debilitating assets, the expense of preparing and, in this manner, the handled phosphorus is required to increment in the following not many years. Accordingly, ascend in phosphorus costs is expected to altogether hamper the worldwide phosphorus trichloride market sooner rather than later.
The worldwide phosphorus trichloride market is fundamentally determined by developing interest from its significant application like drugs, compound union, plastic stabilizers, agrochemicals, fuel added substances, and others. The compound blend and agrochemicals portion are collectively boosting the development of the worldwide phosphorus trichloride market. Phosphorus trichloride is utilized as a compound transitional in the creation of organophosphonates, utilized as chelating specialists, cleaners, consumption inhibitors. They are hostile to scaling specialist for water purification and treatment, and are likely to accelerate the market development graph. The expanding populace alongside their expanding utilization of food and the absence of agricultural land will boost the requirement for agrochemicals, that further propels the phosphorus trichloride market development. Further, the utilization of phosphorus trichloride in the creation of gas and oil added substances are projected to flood the market development because of the interest for effective and subjective fuel from the transportation and car areas. Furthermore, it is additionally utilized as a plasticizer and is a crude material to the medication utilized for anticipation of heart and explicitly communicated sicknesses, which may fuel the market development in the coming years.
1. Preface
1.1. Market Definition and Scope
1.2. Market Segmentation
1.3. Key Research Objectives
1.4. Research Highlights
2. Assumptions and Research Methodology
3. Executive Summary: Global Phosphorus Trichloride Market
4. Market Overview
4.1. Introduction
4.2. Key Market Indicators/Definitions
4.3. Market Dynamics
4.3.1. Drivers
4.3.2. Restraints
4.3.3. Opportunities
4.4. Global Phosphorus Trichloride Market Analysis and Forecast, 2018–2027
4.4.1. Global Phosphorus Trichloride Market Volume (Kilo Tons)
4.4.2. Global Phosphorus Trichloride Market Value (US$ Mn)
4.5. Porters Five Forces Analysis
4.6. Value Chain Analysis
4.7. Pricing Analysis (2018 Benchmarking)
5. Global Phosphorus Trichloride Market Analysis and Forecast, by Grade
5.1. Introduction & Key Findings
5.2. Global Phosphorus Trichloride Market Volume (Kilo Tons) and Value (US$ Mn) Forecast, by Grade, 2018–2027
5.2.1. Pure
5.2.2. Analytical Reagent
5.3. Global Phosphorus Trichloride Market Attractiveness, by Grade, 2018
6. Global Phosphorus Trichloride Market Analysis and Forecast, by Application
6.1. Introduction
6.2. Global Phosphorus Trichloride Market Volume (Kilo Tons) and Value (US$ Mn) Forecast, by Application, 2018–2027
6.2.1. Agrochemicals
6.2.2. Phosphorus Oxychloride
6.2.3. Chemical Intermediate
6.2.4. Plasticizers
6.2.5. Pharmaceuticals
6.2.6. Others (including Surfactants, Oil Additives, and Dyestuffs)
6.3. Global Phosphorus Trichloride Market Attractiveness, by Application, 2018
7. Global Phosphorus Trichloride Market Analysis and Forecast, by Region
7.1. Key Findings
7.2. Global Phosphorus Trichloride Market Volume (Kilo Tons) and Value (US$ Mn) Forecast, by Region, 2018–2027
7.2.1. North America
7.2.1.1. U.S.
7.2.1.2. Canada
7.2.2. Europe
7.2.2.1. Germany
7.2.2.2. U.K.
7.2.2.3. Italy
7.2.2.4. France
7.2.2.5. Spain
7.2.2.7. Rest of Europe
7.2.3. Asia Pacific
7.2.3.1. China
7.2.3.2. India
7.2.3.3. Japan
7.2.3.4. ASEAN
7.2.3.5. Rest of Asia Pacific
7.2.4. Latin America
7.2.4.1. Brazil
7.2.4.2. Mexico
7.2.4.3. Rest of Latin America
7.2.5. Middle East & Africa
7.2.5.1. GCC
7.2.5.2. South Africa
7.2.5.3. Rest of Middle East & Africa
7.3. Global Phosphorus Trichloride Market Attractiveness, by Region, 2018
8. North America Phosphorus Trichloride Market Analysis and Forecast
8.1. Key Findings
8.2. North America Phosphorus Trichloride Market Forecast, by Grade, 2018–2027
8.3. North America Phosphorus Trichloride Market Forecast, by Application, 2018–2027
8.4. North America Phosphorus Trichloride Market Forecast, by Country, 2018–2027
8.4.1.1. U.S. Phosphorus Trichloride Market Volume (Kilo Tons) and Value (US$ Mn) Forecast, by Grade, 2018–2027
8.4.1.2. U.S. Phosphorus Trichloride Market Volume (Kilo Tons) and Value (US$ Mn) Forecast, by Application,2018–2027
8.4.1.3. Canada Phosphorus Trichloride Market Volume (Kilo Tons) and Value (US$ Mn) Forecast, by Grade, 2018–2027
8.4.1.4. Canada Phosphorus Trichloride Market Volume (Kilo Tons) and Value (US$ Mn) Forecast, by Application,2018–2027
8.5. North America Phosphorus Trichloride Market Attractiveness Analysis, 2018
9. Europe Phosphorus Trichloride Market Analysis and Forecast
9.1. Key Findings
9.2. Europe Phosphorus Trichloride Market Forecast, by Grade, 2018–2027
9.3. Europe Phosphorus Trichloride Market Forecast, by Application, 2018–2027
9.4. Europe Phosphorus Trichloride Market Forecast, by Country and Sub-region, 2018–2027
9.4.1.1. Germany Phosphorus Trichloride Market Volume (Kilo Tons) and Value (US$ Mn) Forecast, by Grade, 2018–2027
9.4.1.2. Germany Phosphorus Trichloride Market Volume (Kilo Tons) and Value (US$ Mn) Forecast, by Application,2018–2027
9.4.1.3. U.K. Phosphorus Trichloride Market Volume (Kilo Tons) and Value (US$ Mn) Forecast, by Grade, 2018–2027
9.4.1.4. U.K. Phosphorus Trichloride Market Volume (Kilo Tons) and Value (US$ Mn) Forecast, by Application,2018–2027
9.4.1.5. France Phosphorus Trichloride Market Volume (Kilo Tons) and Value (US$ Mn) Forecast, by Grade, 2018–2027
9.4.1.6. France Phosphorus Trichloride Market Volume (Kilo Tons) and Value (US$ Mn) Forecast, by Application,2018–2027
9.4.1.7. Italy Phosphorus Trichloride Market Volume (Kilo Tons) and Value (US$ Mn) Forecast, by Grade, 2018–2027
9.4.1.8. Italy Phosphorus Trichloride Market Volume (Kilo Tons) and Value (US$ Mn) Forecast, by Application,2018–2027
9.4.1.9. Spain Phosphorus Trichloride Market Volume (Kilo Tons) and Value (US$ Mn) Forecast, by Grade, 2018–2027
9.4.1.10. Spain Phosphorus Trichloride Market Volume (Kilo Tons) and Value (US$ Mn) Forecast, by Application,2018–2027
9.4.1.11. Rest of Europe Phosphorus Trichloride Market Volume (Kilo Tons) and Value (US$ Mn) Forecast, by Grade, 2018–2027
9.4.1.12. Rest of Europe Phosphorus Trichloride Market Volume (Kilo Tons) and Value (US$ Mn) Forecast, by Application,2018–2027
9.5. Europe Phosphorus Trichloride Market Attractiveness Analysis, 2018
10. Asia Pacific Phosphorus Trichloride Market Analysis and Forecast
10.1. Key Findings
10.2. Asia Pacific Phosphorus Trichloride Market Forecast, by Grade, 2018–2027
10.3. Asia Pacific Phosphorus Trichloride Market Forecast, by Application, 2018–2027
10.4. Asia Pacific Phosphorus Trichloride Market Forecast, by Country and Sub-region, 2018–2027
10.4.1.1. China Phosphorus Trichloride Market Volume (Kilo Tons) and Value (US$ Mn) Forecast, by Grade, 2018–2027
10.4.1.2. China Phosphorus Trichloride Market Volume (Kilo Tons) and Value (US$ Mn) Forecast, by Application,2018–2027
10.4.1.3. Japan Phosphorus Trichloride Market Volume (Kilo Tons) and Value (US$ Mn) Forecast, by Grade, 2018–2027
10.4.1.4. Japan Phosphorus Trichloride Market Volume (Kilo Tons) and Value (US$ Mn) Forecast, by Application,2018–2027
10.4.1.5. India Phosphorus Trichloride Market Volume (Kilo Tons) and Value (US$ Mn) Forecast, by Grade, 2018–2027
10.4.1.6. India Phosphorus Trichloride Market Volume (Kilo Tons) and Value (US$ Mn) Forecast, by Application,2018–2027
10.4.1.7. ASEAN Phosphorus Trichloride Market Volume (Kilo Tons) and Value (US$ Mn) Forecast, by Grade, 2018–2027
10.4.1.8. ASEAN Phosphorus Trichloride Market Volume (Kilo Tons) and Value (US$ Mn) Forecast, by Application,2018–2027
10.4.1.9. Rest of Asia Pacific Phosphorus Trichloride Market Volume (Kilo Tons) and Value (US$ Mn) Forecast, by Grade, 2018–2027
10.4.1.10. Rest of Asia Pacific Phosphorus Trichloride Market Volume (Kilo Tons) and Value (US$ Mn) Forecast, by Application,2018–2027
10.5. Asia Pacific Phosphorus Trichloride Market Attractiveness Analysis, 2018
11. Latin America Phosphorus Trichloride Market Analysis and Forecast
11.1. Key Findings
11.2. Latin America Phosphorus Trichloride Market Forecast, by Grade, 2018–2027
11.3. Latin America Phosphorus Trichloride Market Forecast, by Application, 2018–2027
11.4. Latin America Phosphorus Trichloride Market Forecast, by Country and Sub-region, 2018–2027
11.4.1.1. Brazil Phosphorus Trichloride Market Volume (Kilo Tons) and Value (US$ Mn) Forecast, by Grade, 2018–2027
11.4.1.2. Brazil Phosphorus Trichloride Market Volume (Kilo Tons) and Value (US$ Mn) Forecast, by Application, 2018–2027
11.4.1.3. Mexico Phosphorus Trichloride Market Volume (Kilo Tons) and Value (US$ Mn) Forecast, by Grade, 2018–2027
11.4.1.4. Mexico Phosphorus Trichloride Market Volume (Kilo Tons) and Value (US$ Mn) Forecast, by Application, 2018–2027
11.4.1.5. Rest of Latin America Phosphorus Trichloride Market Volume (Kilo Tons) and Value (US$ Mn) Forecast, by Grade, 2018–2027
11.4.1.6. Rest of Latin America Phosphorus Trichloride Market Volume (Kilo Tons) and Value (US$ Mn) Forecast, by Application, 2018–2027
11.5. Latin America Phosphorus Trichloride Market Attractiveness Analysis, 2018
12. Middle East & Africa Phosphorus Trichloride Market Analysis and Forecast
12.1. Key Findings
12.2. Middle East & Africa Phosphorus Trichloride Market Forecast, by Grade, 2018–2027
12.3. Middle East & Africa Phosphorus Trichloride Market Forecast, by Application, 2018–2027
12.4. Middle East & Africa Phosphorus Trichloride Market Forecast, by Country and Sub-region, 2018–2027
12.4.1.1. GCC Phosphorus Trichloride Market Volume (Kilo Tons) and Value (US$ Mn) Forecast, by Grade, 2018–2027
12.4.1.2. GCC Phosphorus Trichloride Market Volume (Kilo Tons) and Value (US$ Mn) Forecast, by Application, 2018–2027
12.4.1.3. South Africa Phosphorus Trichloride Market Volume (Kilo Tons) and Value (US$ Mn) Forecast, by Grade, 2018–2027
12.4.1.4. South Africa Phosphorus Trichloride Market Volume (Kilo Tons) and Value (US$ Mn) Forecast, by Application, 2018–2027
12.4.1.5. Rest of Middle East & Africa Phosphorus Trichloride Market Volume (Kilo Tons) and Value (US$ Mn) Forecast, by Grade, 2018–2027
12.4.1.6. Rest of Middle East & Africa Phosphorus Trichloride Market Volume (Kilo Tons) and Value (US$ Mn) Forecast, by Application, 2018–2027
12.5. Middle East & Africa Phosphorus Trichloride Market Attractiveness Analysis, 2018
13. Competition Landscape
13.1. Competition Matrix
13.1.1. Monsanto Company
13.1.2. Solvay S.A.
13.2. Company Profiles
13.2.1. Monsanto Company
13.2.1.1 Company Description
13.2.1.2 Business Overview
13.2.1.3 Financial Details
13.2.1.4 Strategic Overview
13.2.2. Solvay S.A.
13.2.2.1 Company Description
13.2.2.2 Business Overview
13.2.2.3 Financial Details
13.2.2.4 Strategic Overview
13.2.1. Syngenta
13.2.1.1 Company Description
13.2.1.2 Business Overview
13.2.1.3 Financial Details
13.2.1.4 Strategic Overview
13.2.2. The Mosiac Company
13.2.2.1 Company Description
13.2.2.2 Business Overview
13.2.2.3 Financial Details
13.2.2.4 Strategic Overview
13.2.2. Akzo Nobel N.V.
13.2.1.1 Company Description
13.2.1.2 Business Overview
13.2.1.3 Financial Details
13.2.1.4 Strategic Overview
13.2.2. Excel Industries
13.2.2.1 Company Description
13.2.2.2 Business Overview
13.2.2.3 Financial Details
13.2.2.4 Strategic Overview
13.2.1. Shanghai Fopol Chem-Tech Industry Co. Ltd
13.2.1.1 Company Description
13.2.1.2 Business Overview
13.2.1.3 Financial Details
13.2.1.4 Strategic Overview
13.2.2. Nutrien Ltd.
13.2.2.1 Company Description
13.2.2.2 Business Overview
13.2.2.3 Financial Details
13.2.2.4 Strategic Overview
13.2.1. Guangzhou Zoron Chemical Technology Co., Ltd.
13.2.1.1 Company Description
13.2.1.2 Business Overview
13.2.1.3 Financial Details
13.2.1.4 Strategic Overview
13.2.2. Lanxess
13.2.2.1 Company Description
13.2.2.2 Business Overview
13.2.2.3 Financial Details
13.2.2.4 Strategic Overview
13.2.1. LianYunGang Dongjin Chemical Co., Ltd.
13.2.1.1 Company Description
13.2.1.2 Business Overview
13.2.1.3 Financial Details
13.2.1.4 Strategic Overview
13.2.2. Italmatch Chemicals
13.2.2.1 Company Description
13.2.2.2 Business Overview
13.2.2.3 Financial Details
13.2.2.4 Strategic Overview
List of Tables
Table 01: Global Phosphorus Trichloride Market Volume (Kilo Tons) and Value (US$ Mn) Forecast, by Grade, 2018–2027
Table 02: Global Phosphorus Trichloride Market Volume (Kilo Tons) and Value (US$ Mn) Forecast, by Application, 2018–2027
Table 03: Global Phosphorus Trichloride Market Volume (Kilo Tons) and Value (US$ Mn) Forecast, by Region, 2018–2027
Table 04: North America Phosphorus Trichloride Market Volume (Kilo Tons) and Value (US$ Mn) Forecast, by Grade, 2018–2027
Table 05: North America Phosphorus Trichloride Market Volume (Kilo Tons) and Value (US$ Mn) Forecast, by Application, 2018–2027
Table 06: North America Phosphorus Trichloride Market Volume (Kilo Tons) and Value (US$ Mn) Forecast, by Country, 2018–2027
Table 07: U.S. Phosphorus Trichloride Market Volume (Kilo Tons) and Value (US$ Mn) Forecast, by Grade, 2018–2027
Table 08: U.S. Phosphorus Trichloride Market Volume (Kilo Tons) and Value (US$ Mn) Forecast, by Application, 2018–2027
Table 09: Canada Phosphorus Trichloride Market Volume (Kilo Tons) and Value (US$ Mn) Forecast, by Grade, 2018–2027
Table 10: Canada Phosphorus Trichloride Market Volume (Kilo Tons) and Value (US$ Mn) Forecast, by Application, 2018–2027
Table 11: Europe Phosphorus Trichloride Market Volume (Kilo Tons) and Value (US$ Mn) Forecast, by Grade, 2018–2027
Table 12: Europe Phosphorus Trichloride Market Volume (Kilo Tons) and Value (US$ Mn) Forecast, by Application, 2018–2027
Table 13: Europe Phosphorus Trichloride Market Volume (Kilo Tons) and Value (US$ Mn) Forecast, by Country and Sub-region, 2018–2027
Table 14: Germany Phosphorus Trichloride Market Volume (Kilo Tons) and Value (US$ Mn) Forecast, by Grade, 2018–2027
Table 15: Germany Phosphorus Trichloride Market Volume (Kilo Tons) and Value (US$ Mn) Forecast, by Application, 2018–2027
Table 16: France Phosphorus Trichloride Market Volume (Kilo Tons) and Value (US$ Mn) Forecast, by Grade, 2018–2027
Table 17: France Phosphorus Trichloride Market Volume (Kilo Tons) and Value (US$ Mn) Forecast, by Application, 2018–2027
Table 18: U.K. Phosphorus Trichloride Market Volume (Kilo Tons) and Value (US$ Mn) Forecast, by Grade, 2018–2027
Table 19: U.K. Phosphorus Trichloride Market Volume (Kilo Tons) and Value (US$ Mn) Forecast, by Application, 2018–2027
Table 20: Italy Phosphorus Trichloride Market Volume (Kilo Tons) and Value (US$ Mn) Forecast, by Grade, 2018–2027
Table 21: Italy Phosphorus Trichloride Market Volume (Kilo Tons) and Value (US$ Mn) Forecast, by Application, 2018–2027
Table 22: Rest of Europe Phosphorus Trichloride Market Volume (Kilo Tons) and Value (US$ Mn) Forecast, by Grade, 2018–2027
Table 23: Rest of Europe Phosphorus Trichloride Market Volume (Kilo Tons) and Value (US$ Mn) Forecast, by Application, 2018–2027
Table 24: Asia Pacific Phosphorus Trichloride Market Volume (Kilo Tons) and Value (US$ Mn) Forecast, by Grade, 2018–2027
Table 25: Asia Pacific Phosphorus Trichloride Market Volume (Kilo Tons) and Value (US$ Mn) Forecast, by Application, 2018–2027
Table 26: Asia Pacific Phosphorus Trichloride Market Volume (Kilo Tons) and Value (US$ Mn) Forecast, by Country and Sub-region, 2018–2027
Table 27: China Phosphorus Trichloride Market Volume (Kilo Tons) and Value (US$ Mn) Forecast, by Grade, 2018–2027
Table 28: China Phosphorus Trichloride Market Volume (Kilo Tons) and Value (US$ Mn) Forecast, by Application, 2018–2027
Table 29: India Phosphorus Trichloride Market Volume (Kilo Tons) and Value (US$ Mn) Forecast, by Grade, 2018–2027
Table 30: India Phosphorus Trichloride Market Volume (Kilo Tons) and Value (US$ Mn) Forecast, by Application, 2018–2027
Table 31: Japan Phosphorus Trichloride Market Volume (Kilo Tons) and Value (US$ Mn) Forecast, by Grade, 2018–2027
Table 32: Japan Phosphorus Trichloride Market Volume (Kilo Tons) and Value (US$ Mn) Forecast, by Application, 2018–2027
Table 33: ASEAN Phosphorus Trichloride Market Volume (Kilo Tons) and Value (US$ Mn) Forecast, by Grade, 2018–2027
Table 34: ASEAN Phosphorus Trichloride Market Volume (Kilo Tons) and Value (US$ Mn) Forecast, by Application, 2018–2027
Table 35: Rest of Asia Pacific Phosphorus Trichloride Market Volume (Kilo Tons) and Value (US$ Mn) Forecast, by Grade, 2018–2027
Table 36: Rest of Asia Pacific Phosphorus Trichloride Market Volume (Kilo Tons) and Value (US$ Mn) Forecast, by Application, 2018–2027
Table 37: Latin America Phosphorus Trichloride Market Volume (Kilo Tons) and Value (US$ Mn) Forecast, by Grade, 2018–2027
Table 38: Latin America Phosphorus Trichloride Market Volume (Kilo Tons) and Value (US$ Mn) Forecast, by Application, 2018–2027
Table 39: Latin America Phosphorus Trichloride Market Volume (Kilo Tons) and Value (US$ Mn) Forecast, by Country and Sub-region, 2018–2027
Table 40: Brazil Phosphorus Trichloride Market Volume (Kilo Tons) and Value (US$ Mn) Forecast, by Grade, 2018–2027
Table 41: Brazil Phosphorus Trichloride Market Volume (Kilo Tons) and Value (US$ Mn) Forecast, by Application, 2018–2027
Table 42: Mexico Phosphorus Trichloride Market Volume (Kilo Tons) and Value (US$ Mn) Forecast, by Grade, 2018–2027
Table 43: Mexico Phosphorus Trichloride Market Volume (Kilo Tons) and Value (US$ Mn) Forecast, by Application, 2018–2027
Table 44: Rest of Latin America Phosphorus Trichloride Market Volume (Kilo Tons) and Value (US$ Mn) Forecast, by Grade, 2018–2027
Table 45: Rest of Latin America Phosphorus Trichloride Market Volume (Kilo Tons) and Value (US$ Mn) Forecast, by Application, 2018–2027
Table 46: Middle East & Africa Phosphorus Trichloride Market Volume (Kilo Tons) and Value (US$ Mn) Forecast, by Grade, 2018–2027
Table 47: Middle East & Africa Phosphorus Trichloride Market Volume (Kilo Tons) and Value (US$ Mn) Forecast, by Application, 2018–2027
Table 48: Middle East & Africa Phosphorus Trichloride Market Volume (Kilo Tons) and Value (US$ Mn) Forecast, by Country and Sub-region, 2018–2027
Table 49: GCC Phosphorus Trichloride Market Volume (Kilo Tons) and Value (US$ Mn) Forecast, by Grade, 2018–2027
Table 50: GCC Phosphorus Trichloride Market Volume (Kilo Tons) and Value (US$ Mn) Forecast, by Application, 2018–2027
Table 51: South Africa Phosphorus Trichloride Market Volume (Kilo Tons) and Value (US$ Mn) Forecast, by Grade, 2018–2027
Table 52: South Africa Phosphorus Trichloride Market Volume (Kilo Tons) and Value (US$ Mn) Forecast, by Application, 2018–2027
Table 53: Rest of Middle East & Africa Phosphorus Trichloride Market Volume (Kilo Tons) and Value (US$ Mn) Forecast, by Grade, 2018–2027
Table 54: Rest of Middle East & Africa Phosphorus Trichloride Market Volume (Kilo Tons) and Value (US$ Mn) Forecast, by Application, 2018–2027
List of Figures
Figure 01: Global Phosphorus Trichloride Market
Figure 02: Global Phosphorus Trichloride Market Volume (Kilo Tons) and Value (US$ Mn) Forecast, 2018–2027
Figure 03: Global Phosphorus Trichloride Pricing Analysis, by Grade, 2018–2027
Figure 04: Global Phosphorus Trichloride Pricing Analysis, by Region, 2018–2027
Figure 05: Global Phosphorus Trichloride Market Value Share Analysis, by Grade, 2018 and 2027
Figure 06: Global Phosphorus Trichloride Market Attractiveness Analysis, by Grade, 2019-2027
Figure 07: Global Phosphorus Trichloride Market Value Share Analysis, by Application, 2018 and 2027
Figure 08: Global Phosphorus Trichloride Market Attractiveness Analysis, by Application, 2019-2027
Figure 09: Global Phosphorus Trichloride Market Value Share Analysis, by Region, 2018 and 2027
Figure 10: Global Phosphorus Trichloride Market Attractiveness Analysis, by Region, 2019-2027
Figure 11: North America Phosphorus Trichloride Market Volume (Kilo Tons) and Value (US$ Mn) Forecast, 2018–2027
Figure 12: North America Market Attractiveness Analysis, by Country
Figure 13: North America Market Value Share Analysis, by Grade, 2018 and 2027
Figure 14: North America Market Attractiveness Analysis, by Grade
Figure 15: North America Market Value Share Analysis, by Application, 2018 and 2027
Figure 16: North America Market Attractiveness Analysis, by Application, 2018-2027
Figure 17: North America Market Value Share Analysis, by Country, 2018 and 2027
Figure 18: Europe Phosphorus Trichloride Market Volume (Kilo Tons) and Value (US$ Mn) Forecast, 2018–2027
Figure 19: Europe Market Attractiveness Analysis, by Country and Sub-region
Figure 20: Europe Market Value Share Analysis, by Grade, 2018 and 2027
Figure 21: Europe Market Attractiveness Analysis, by Grade, 2018-2027
Figure 22: Europe Market Value Share Analysis, by Application, 2018 and 2027
Figure 23: Europe Market Attractiveness Analysis, by Application, 2018-2027
Figure 24: Europe Market Value Share Analysis, by Country and Sub-region, 2018 and 2027
Figure 25: Asia Pacific Phosphorus Trichloride Market Volume (Kilo Tons) and Value (US$ Mn) Forecast, 2018–2027
Figure 26: Asia Pacific Market Attractiveness Analysis, by Country and Sub-region
Figure 27: Asia Pacific Market Value Share Analysis, by Grade, 2018 and 2027
Figure 28: Asia Pacific Market Attractiveness Analysis, by Grade, 2019-2027
Figure 29: Asia Pacific Market Value Share Analysis, by Application, 2018 and 2027
Figure 30: Asia Pacific Market Attractiveness Analysis, by Application, 2019-2027
Figure 31: Asia Pacific Market Value Share Analysis, by Country and Sub-region, 2018 and 2027
Figure 32: Latin America Phosphorus Trichloride Market Volume (Kilo Tons) and Value (US$ Mn) Forecast, 2018–2027
Figure 33: Latin America Market Attractiveness Analysis, by Country and Sub-region
Figure 34: Latin America Market Value Share Analysis, by Grade, 2018 and 2027
Figure 35: Latin America Market Attractiveness Analysis, by Grade, 2019-2027
Figure 36: Latin America Market Value Share Analysis, by Application, 2018 and 2027
Figure 37: Latin America Market Attractiveness Analysis, by Application, 2019-2027
Figure 38: Latin America Market Value Share Analysis, by Country and Sub-region, 2018 and 2027
Figure 39: Middle East & Africa Phosphorus Trichloride Market Volume (Kilo Tons) and Value (US$ Mn) Forecast, 2018–2027
Figure 40: Middle East & Africa Market Attractiveness Analysis, by Country and Sub-region
Figure 41: Middle East & Africa Market Value Share Analysis, by Grade, 2018 and 2027
Figure 42: Middle East & Africa Market Attractiveness Analysis, by Grade, 2019-2027
Figure 43: Middle East & Africa Market Value Share Analysis, by Application, 2018 and 2027
Figure 44: Middle East & Africa Market Attractiveness Analysis, by Application, 2019-2027
Figure 45: Middle East & Africa Market Value Share Analysis, by Country and Sub-region, 2018 and 2027
Copyright © Transparency Market Research, Inc. All Rights reserved
Trust Online

Phosphorus Trichloride Market