
Reports
Reports
There is a growing need to improve digital oilfield operations in the artificial lift systems market. Fortunately, new technologies are making it possible for manufacturers to meet specific requirements of stakeholders in the oil & gas industry.
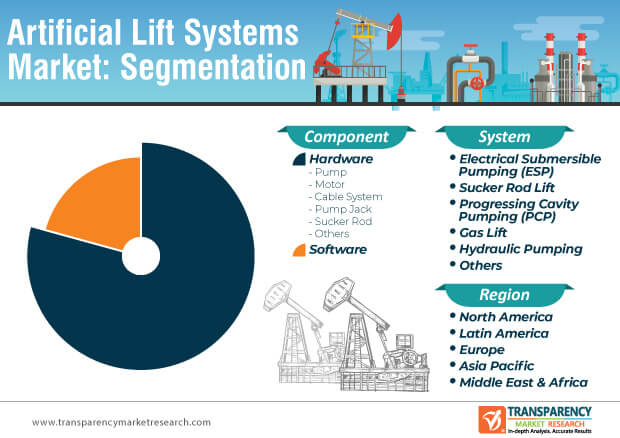
Since stakeholders in the oil & gas industry are constantly looking for options to optimize production costs, companies in the market for artificial lift systems are introducing business intelligence and analytics software. As such, software component segment of the artificial lift systems market is expected to reach a value of ~US$ 2.6 Bn by the end of 2027. Hence, companies in the market for artificial lift systems are collaborating with software engineers to develop advanced software systems.
Stakeholders in the oil & gas industry are increasingly benefitting from advanced business-intelligence software, since such software not only offer data on virtual flowmeters (VFMs), but also provide information across all inputs in an oilfield. Such operational practices are helping stakeholders to achieve high productivity levels.
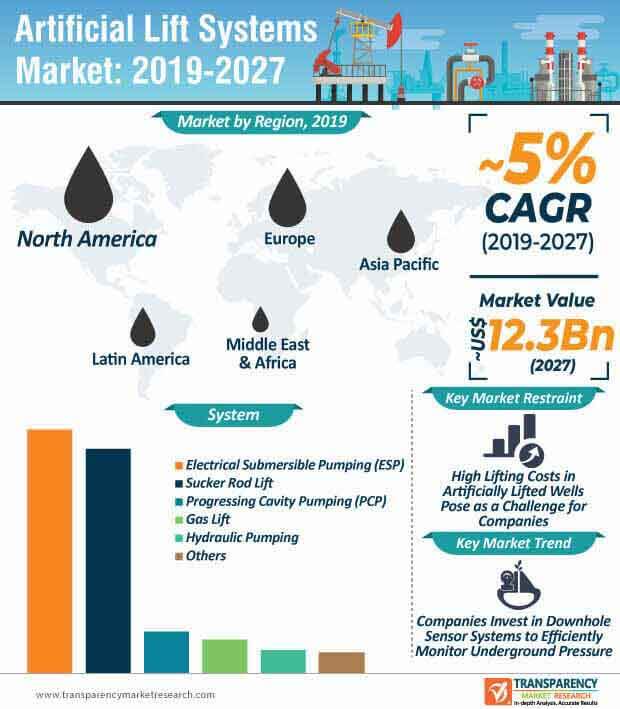
Workers in the oil & gas industry operate in high-risk environments. Hence, oil & gas companies are investing in technologically sound systems that ensure safety of workers. Likewise, end users in the market for artificial lift systems are increasingly investing in innovative sucker rod lift systems built with insert safety valves. This is evident as sucker rod lift system segment of the artificial lift systems market is anticipated to reach a value of ~US$ 5.1 Bn by 2027.
Sucker rod artificial lifts are being increasingly used to lift hydrocarbons from wells to the surface. Manufacturers in the market for artificial lift systems are increasing their production capacities to develop fail-safe designs of these artificial lifts in order to prevent uncontrolled blow out during phases of oil production. Insert safety valves are being interchangeably used with wireline surface valves. Since installation and retrieving procedures of the two valves collide, manufacturers in the artificial lift systems market are introducing novel insert rod pumps to support challenging oil production procedures. These hybrid pumps offer economic advantages to companies, since they serve as a new approach for retrofitting existing wells.
WRESP Technology Helps Overcome Barriers of Production Downtime
The artificial lift systems market is anticipated to grow at a favorable rate during the forecast period. However, certain hurdles act as barriers for manufacturers. For instance, the artificial lift systems market is consolidated with five major players accounting for a market share of ~65%. This poses as a hurdle for emerging players to compete with leading players in the artificial lift systems market, since the former lacks resources and capital to meet needs of end users.
On the other hand, there is a growing need to improve operational costs involving the electric submersible pumping (ESP) technology. Undesired impact from ESP and production downtime act as major barrier affecting productivity levels of workers in the oil & gas industry. Hence, companies in the market for artificial lift systems are introducing the innovative wireline rigless retrievable electric submersible pumping (WRESP) technology to overcome the limitations of the conventional ESP technology. End-use industries are increasingly benefitting from the WRESP technology since it extends the economic life of assets.
Companies Incorporate ML and AI Technologies in Everyday Workflow
There is a growing need to streamline oil production processes in wells involving sucker rod pump systems. Hence, manufacturers in the artificial lift systems market are leveraging opportunities in machine learning (ML) and AI to prevent incidence of destructive events that might endanger the life of workers. They are increasing R&D activities in low load anomaly characterization with ML and AI technologies using rod lift systems for deliquification purposes.
Software innovations are gaining popularity in the artificial lift systems market as a cost-efficient alternative to study low load anomaly characterization. Multiple analytical techniques using software are anticipated to become increasingly mainstream over the next few years. Software-based workflow is expected to lead the way for real-time alerts regarding production engineering at the time of anomaly detection and characterization.
Analysts’ Viewpoint
Manufacturers are strengthening their distribution channels, and are offering agile services to meet the requirements of stakeholders in onshore and offshore environments. They are bolstering the company’s credibility by innovating in new technologies that extend the runtime of artificial lift pumping systems.
Software is projected to lead to innovation in the artificial lift systems market, in terms of optimizing operational costs and boosting productivity levels. However, mid- and small-sized oil producers face budget constraints with upfront installation and maintenance costs of business-intelligence software. Thus, manufacturers should strategically market novel software at leading oil producers who have high capital spending and other resources to incorporate software in their production workflow.
Artificial Lift Systems: Overview
Increase in Production of Unconventional Resources to Drive Artificial Lift Systems Market
Volatility in Crude Oil Prices Likely to Restrain Artificial Lift Systems Market
Increase in Deep and Ultra-deep Water Activities to Present New Opportunities
Recent Developments, Expansions, Acquisitions, and New Contracts
North America Leads Artificial Lift Systems Market
International Players Dominate Artificial Lift Systems Market
Artificial Lift Systems Market is projected to reach US$ 12.3 Bn by the end of 2027
Artificial Lift Systems Market is expected to grow at a CAGR of 5% during 2019 – 2027
Rise in number of mature fields and aging oil & gas wells is estimated to boost the demand for artificial lift systems during the forecast period
North America is a more attractive region for vendors in the Artificial Lift Systems Market
Key vendors in the Artificial Lift Systems Market are Schlumberger Limited, Weatherford International Plc, Baker Hughes, a GE Company, Apergy Corporation, Borets International Limited, etc
1. Executive Summary
1.1. Market Outlook
1.2. Key Facts and Figures
1.3. Key Trends
1.4. TMR’s Growth Opportunity Wheel
2. Market Overview
2.1. Market Segmentation
2.2. Market Indicators
3. Market Dynamics
3.1. Drivers and Restraints Snapshot Analysis
3.1.1.1. Drivers
3.1.1.2. Restraints
3.1.1.3. Opportunities
3.2. Porter’s Five Forces Analysis
3.2.1. Threat of Substitutes
3.2.2. Bargaining Power of Buyers
3.2.3. Bargaining Power of Suppliers
3.2.4. Threat of New Entrants
3.2.5. Degree of Competition
3.3. Regulatory Scenario
3.4. Value Chain Analysis
3.5. List of Hardware Vendors – Artificial Lift Systems Market
3.6. List of Software Vendors – Artificial Lift Systems Market
3.7. Global Crude Oil Production Outlook, by Region, 2018
4. Digitalization in Artificial Lift Systems
4.1. Introduction
4.1.1. Strategic Investment
4.1.2. Joint Venture
4.1.3. New Product Development
4.2. Key Developments
4.3. Key Findings
4.4. Recent Developments and Successful Implementations
4.5. Comp Analysis, by Key Providers
5. Global Artificial Lift Systems Market Value (US$ Mn) Analysis, by Component
5.1. Key Findings and Introduction
5.2. Global Artificial Lift Systems Market Value (US$ Mn) Forecast, by Component, 2018–2027
5.2.1. Global Artificial Lift Systems Market Value (US$ Mn) Forecast, by Hardware, 2018–2027
5.2.1.1. Global Artificial Lift Systems Market Value (US$ Mn) Forecast, by Pump, 2018–2027
5.2.1.2. Global Artificial Lift Systems Market Value (US$ Mn) Forecast, by Motor, 2018–2027
5.2.1.3. Global Artificial Lift Systems Market Value (US$ Mn) Forecast, by Cable System, 2018–2027
5.2.1.4. Global Artificial Lift Systems Market Value (US$ Mn) Forecast, by Pump Jack, 2018–2027
5.2.1.5. Global Artificial Lift Systems Market Value (US$ Mn) Forecast, by Sucker Rod, 2018–2027
5.2.1.6. Global Artificial Lift Systems Market Value (US$ Mn) Forecast, by Others, 2018–2027
5.2.2. Global Artificial Lift Systems Market Value (US$ Mn) Forecast, by Software, 2018–2027
5.3. Global Artificial Lift Systems Market Attractiveness Analysis, by Component
6. Global Artificial Lift Systems Market Value (US$ Mn) Analysis, by System
6.1. Key Findings and Introduction
6.2. Global Artificial Lift Systems Market Value (US$ Mn) Forecast, by System, 2018–2027
6.2.1. Global Artificial Lift Systems Market Value (US$ Mn) Forecast, by Electrical Submersible Pumping (ESP), 2018–2027
6.2.2. Global Artificial Lift Systems Market Value (US$ Mn) Forecast, by Sucker Rod Lift, 2018–2027
6.2.3. Global Artificial Lift Systems Market Value (US$ Mn) Forecast, by Progressing Cavity Pumping (PCP), 2018–2027
6.2.4. Global Artificial Lift Systems Market Value (US$ Mn) Forecast, by Gas Lift, 2018–2027
6.2.5. Global Artificial Lift Systems Market Value (US$ Mn) Forecast, by Hydraulic Pumping, 2018–2027
6.2.6. Global Artificial Lift Systems Market Value (US$ Mn) Forecast, by Others, 2018–2027
6.3. Global Artificial Lift Systems Market Attractiveness Analysis, by System
7. Global Artificial Lift Systems Market Analysis, by Region
7.1. Key Findings
7.2. Global Artificial Lift Systems Market Value (US$ Mn) Forecast, by Region
7.2.1. North America
7.2.2. Europe
7.2.3. Asia Pacific
7.2.4. Latin America
7.2.5. Middle East & Africa
7.3. Global Artificial Lift Systems Market Attractiveness Analysis, by Region
8. North America Artificial Lift Systems Market Overview
8.1. Key Findings
8.2. North America Artificial Lift Systems Market Value (US$ Mn) Forecast, by Component, 2018–2027
8.3. North America Artificial Lift Systems Market Value (US$ Mn) Forecast, by System, 2018–2027
8.4. North America Artificial Lift Systems Market Value (US$ Mn) Forecast, by Country
8.4.1. U.S. Artificial Lift Systems Market Value (US$ Mn) Forecast, by Component, 2018–2027
8.4.2. U.S. Artificial Lift Systems Market Value (US$ Mn) Forecast, by System, 2018–2027
8.4.3. Canada Artificial Lift Systems Market Value (US$ Mn) Forecast, by Component, 2018–2027
8.4.4. Canada Artificial Lift Systems Market Value (US$ Mn) Forecast, by System, 2018–2027
8.5. North America Artificial Lift Systems Market Attractiveness Analysis, by Component
8.6. North America Artificial Lift Systems Market Attractiveness Analysis, by System
8.7. North America Artificial Lift Systems Market Attractiveness Analysis, by Country
9. Europe Artificial Lift Systems Market Overview
9.1. Key Findings
9.2. Europe Artificial Lift Systems Market Value (US$ Mn) Forecast, by Component, 2018–2027
9.3. Europe Artificial Lift Systems Market Value (US$ Mn) Forecast, by System, 2018–2027
9.4. Europe Artificial Lift Systems Market Value (US$ Mn) and Forecast, by Country and Sub-region
9.4.1. U.K. Artificial Lift Systems Market Value (US$ Mn) Forecast, by Component, 2018–2027
9.4.2. U.K. Artificial Lift Systems Market Value (US$ Mn) Forecast, by System, 2018–2027
9.4.3. Norway Artificial Lift Systems Market Value (US$ Mn) Forecast, by Component, 2018–2027
9.4.4. Norway Artificial Lift Systems Market Value (US$ Mn) Forecast, by System, 2018–2027
9.4.5. Russia & CIS Artificial Lift Systems Market Value (US$ Mn) Forecast, by Component, 2018–2027
9.4.6. Russia & CIS Artificial Lift Systems Market Value (US$ Mn) Forecast, by System, 2018–2027
9.4.7. Rest of Europe Artificial Lift Systems Market Value (US$ Mn) Forecast, by Component, 2018–2027
9.4.8. Rest of Europe Artificial Lift Systems Market Value (US$ Mn) Forecast, by System, 2018–2027
9.5. Europe Artificial Lift Systems Market Attractiveness Analysis, by Component
9.6. Europe Artificial Lift Systems Market Attractiveness Analysis, by System
9.7. Europe Artificial Lift Systems Market Attractiveness Analysis, by Country and Sub-region
10. Asia Pacific Artificial Lift Systems Market Overview
10.1. Key Findings
10.2. Asia Pacific Artificial Lift Systems Market Value (US$ Mn) Forecast, by Component, 2018–2027
10.3. Asia Pacific Artificial Lift Systems Market Value (US$ Mn) Forecast, by System, 2018–2027
10.4. Asia Pacific Artificial Lift Systems Market Value (US$ Mn) Forecast, by Country and Sub-region
10.4.1. China Artificial Lift Systems Market Value (US$ Mn) Forecast, by Component, 2018–2027
10.4.2. China Artificial Lift Systems Market Value (US$ Mn) Forecast, by System, 2018–2027
10.4.3. India Artificial Lift Systems Market Value (US$ Mn) Forecast, by Component
10.4.4. India Artificial Lift Systems Market Value (US$ Mn) Forecast, by System, 2018–2027
10.4.5. ASEAN Artificial Lift Systems Market Value (US$ Mn) Forecast, by Component
10.4.6. ASEAN Artificial Lift Systems Market Value (US$ Mn) Forecast, by System, 2018–2027
10.4.7. Rest of Asia Pacific Artificial Lift Systems Market Value (US$ Mn) Forecast, by Component
10.4.8. Rest of Asia Pacific Artificial Lift Systems Market Value (US$ Mn) Forecast, by System, 2018–2027
10.5. Asia Pacific Artificial Lift Systems Market Attractiveness Analysis, by Component
10.6. Asia Pacific Artificial Lift Systems Market Attractiveness Analysis, by System
10.7. Asia Pacific Artificial Lift Systems Market Attractiveness Analysis, by Country and Sub-region
11. Latin America Artificial Lift Systems Market Overview
11.1. Key Findings
11.2. Latin America Artificial Lift Systems Market Value (US$ Mn) Forecast, by Component, 2018–2027
11.3. Latin America Artificial Lift Systems Market Value (US$ Mn) Forecast, by System, 2018–2027
11.4. Latin America Artificial Lift Systems Market Value (US$ Mn) Forecast, by Country and Sub-region
11.4.1. Brazil Artificial Lift Systems Market Value (US$ Mn) Forecast, by Component, 2018–2027
11.4.2. Brazil Artificial Lift Systems Market Value (US$ Mn) Forecast, by System, 2018–2027
11.4.3. Mexico Artificial Lift Systems Market Value (US$ Mn) Forecast, by Component, 2018–2027
11.4.4. Mexico Artificial Lift Systems Market Value (US$ Mn) Forecast, by System, 2018–2027
11.4.5. Venezuela Artificial Lift Systems Market Value (US$ Mn) Forecast, by Component, 2018–2027
11.4.6. Venezuela Artificial Lift Systems Market Value (US$ Mn) Forecast, by System, 2018–2027
11.4.7. Rest of Latin America Artificial Lift Systems Market Value (US$ Mn) Forecast, by Component, 2018–2027
11.4.8. Rest of Latin America Artificial Lift Systems Market Value (US$ Mn) Forecast, by System, 2018–2027
11.5. Latin America Artificial Lift Systems Market Attractiveness Analysis, by Component
11.6. Latin America Artificial Lift Systems Market Attractiveness Analysis, by System
11.7. Latin America Artificial Lift Systems Market Attractiveness Analysis, by Country and Sub-region
12. Middle East & Africa Artificial Lift Systems Market Overview
12.1. Key Findings
12.2. Middle East & Africa Artificial Lift Systems Market Value (US$ Mn) Forecast, by Component, 2018–2027
12.3. Middle East & Africa Artificial Lift Systems Market Value (US$ Mn) Forecast, by System, 2018–2027
12.4. Middle East & Africa Artificial Lift Systems Market Value (US$ Mn) Forecast, by Country and Sub-region
12.4.1. GCC Artificial Lift Systems Market Value (US$ Mn) Forecast, by Component, 2018–2027
12.4.2. GCC Artificial Lift Systems Market Value (US$ Mn) Forecast, by System, 2018–2027
12.4.3. Nigeria Artificial Lift Systems Market Value (US$ Mn) Forecast, by Component, 2018–2027
12.4.4. Nigeria Artificial Lift Systems Market Value (US$ Mn) Forecast, by System, 2018–2027
12.4.5. Rest of Middle East & Africa Artificial Lift Systems Market Value (US$ Mn) Forecast, by Component, 2018–2027
12.4.6. Rest of Middle East & Africa Artificial Lift Systems Market Value (US$ Mn) Forecast, by System, 2018–2027
12.5. Middle East & Africa Artificial Lift Systems Market Attractiveness Analysis, by Component
12.6. Middle East & Africa Artificial Lift Systems Market Attractiveness Analysis, by System
12.7. Middle East & Africa Artificial Lift Systems Market Attractiveness Analysis, by Country and Sub-region
13. Competition Landscape
13.1. Competition Matrix
13.2. Global Artificial Lift Systems Market Share Analysis, by Company (2018)
13.3. Market Footprint Analysis
13.4. Company Profiles
13.4.1. Schlumberger Limited
13.4.1.1. Company Details
13.4.1.2. Company Description
13.4.1.3. Business Overview
13.4.1.4. Financial Details
13.4.1.5. Strategic Overview/Recent Developments
13.4.2. Superior Energy Services, Inc.
13.4.2.1. Company Details
13.4.2.2. Company Description
13.4.2.3. Business Overview
13.4.2.4. Financial Details
13.4.2.5. Strategic Overview/Recent Developments
13.4.3. National Oilwell Varco
13.4.3.1. Company Details
13.4.3.2. Company Description
13.4.3.3. Business Overview
13.4.3.4. Financial Details
13.4.3.5. Strategic Overview/Recent Developments
13.4.4. Baker Hughes, a GE Company (BHGE)
13.4.4.1. Company Details
13.4.4.2. Company Description
13.4.4.3. Business Overview
13.4.4.4. Financial Details
13.4.4.5. Strategic Overview/Recent Developments
13.4.5. Halliburton Inc.
13.4.5.1. Company Details
13.4.5.2. Company Description
13.4.5.3. Business Overview
13.4.5.4. Financial Details
13.4.5.5. Strategic Overview/Recent Developments
13.4.6. Weatherford International Plc.
13.4.6.1. Company Details
13.4.6.2. Company Description
13.4.6.3. Business Overview
13.4.6.4. Financial Details
13.4.6.5. Strategic Overview/Recent Developments
13.4.7. Borets International Limited
13.4.7.1. Company Details
13.4.7.2. Company Description
13.4.7.3. Business Overview
13.4.7.4. Financial Details
13.4.7.5. Strategic Overview/Recent Developments
13.4.8. Apergy Corporation
13.4.8.1. Company Details
13.4.8.2. Company Description
13.4.8.3. Business Overview
13.4.8.4. Financial Details
13.4.8.5. Strategic Overview/Recent Developments
13.4.9. Occidental Petroleum Corporation
13.4.9.1. Company Details
13.4.9.2. Company Description
13.4.9.3. Business Overview
13.4.9.4. Financial Details
13.4.9.5. Strategic Overview/Recent Developments
13.4.10. Flowco Production Solutions
13.4.10.1. Company Details
13.4.10.2. Company Description
13.4.10.3. .Business Overview
13.4.11. Novomet
13.4.11.1. Company Details
13.4.11.2. Company Description
13.4.11.3. Business Overview
13.4.12. OiLSERV
13.4.12.1. Company Details
13.4.12.2. Company Description
13.4.12.3. Business Overview
14. Primary Research – Key Insights
15. Appendix
15.1. Research Methodology and Assumptions
List of Tables
Table 01: Global Artificial Lift Systems Market Value (US$ Mn) Forecast, by Component, 2018–2027
Table 02: Global Artificial Lift Systems Market Value (US$ Mn) Forecast, by System, 2018–2027
Table 03: Global Artificial Lift Systems Market Value (US$ Mn) Forecast, by Region, 2018–2027
Table 04: North America Artificial Lift Systems Market Value (US$ Mn) Forecast, by Component, 2018–2027
Table 05: North America Artificial Lift Systems Market Value (US$ Mn) Forecast, by System, 2018–2027
Table 06: North America Artificial Lift Systems Market Value (US$ Mn) Forecast, by Country, 2018–2027
Table 07: U.S. Artificial Lift Systems Market Value (US$ Mn) Forecast, by Component, 2018–2027
Table 08: U.S. Artificial Lift Systems Market Value (US$ Mn) Forecast, by System, 2018–2027
Table 09: Canada Artificial Lift Systems Market Value (US$ Mn) Forecast, by Component, 2018–2027
Table 10: Canada Artificial Lift Systems Market Value (US$ Mn) Forecast, by System, 2018–2027
Table 11: Europe Artificial Lift Systems Market Value (US$ Mn) Forecast, by Component, 2018–2027
Table 12: Europe Artificial Lift Systems Market Value (US$ Mn) Forecast, by System, 2018–2027
Table 13: Europe Artificial Lift Systems Market Value (US$ Mn) Forecast, by Country and Sub-region, 2018–2027
Table 14: Norway Artificial Lift Systems Market Value (US$ Mn) Forecast, by Component, 2018–2027
Table 15: Norway Artificial Lift Systems Market Value (US$ Mn) Forecast, by System, 2018–2027
Table 16: U.K. Artificial Lift Systems Market Value (US$ Mn) Forecast, by Component, 2018–2027
Table 17: U.K. Artificial Lift Systems Market Value (US$ Mn) Forecast, by System, 2018–2027
Table 18: Russia & CIS Artificial Lift Systems Market Value (US$ Mn) Forecast, by Component, 2018–2027
Table 19: Russia & CIS Artificial Lift Systems Market Value (US$ Mn) Forecast, by System, 2018–2027
Table 20: Rest of Europe Artificial Lift Systems Market Value (US$ Mn) Forecast, by Component, 2018–2027
Table 21: Rest of Europe Artificial Lift Systems Market Value (US$ Mn) Forecast, by System, 2018–2027
Table 22: Asia Pacific Artificial Lift Systems Market Value (US$ Mn) Forecast, by Component, 2018–2027
Table 23: Asia Pacific Artificial Lift Systems Market Value (US$ Mn) Forecast, by System, 2018–2027
Table 24: Asia Pacific Artificial Lift Systems Market Value (US$ Mn) Forecast, by Country and Sub-region, 2018–2027
Table 25: China Artificial Lift Systems Market Value (US$ Mn) Forecast, by Component, 2018–2027
Table 26: China Artificial Lift Systems Market Value (US$ Mn) Forecast, by System, 2018–2027
Table 27: India Artificial Lift Systems Market Value (US$ Mn) Forecast, by Component, 2018–2027
Table 28: India Artificial Lift Systems Market Value (US$ Mn) Forecast, by System, 2018–2027
Table 29: ASEAN Artificial Lift Systems Market Value (US$ Mn) Forecast, by Component, 2018–2027
Table 30: ASEAN Artificial Lift Systems Market Value (US$ Mn) Forecast, by System, 2018–2027
Table 31: Rest of Asia Pacific Artificial Lift Systems Market Value (US$ Mn) Forecast, by Component, 2018–2027
Table 32: Rest of Asia Pacific Artificial Lift Systems Market Value (US$ Mn) Forecast, by System, 2018–2027
Table 33: Latin America Artificial Lift Systems Market Value (US$ Mn) Forecast, by Component, 2018–2027
Table 34: Latin America Artificial Lift Systems Market Value (US$ Mn) Forecast, by System, 2018–2027
Table 35: Latin America Artificial Lift Systems Market Value (US$ Mn) Forecast, by Country and Sub-region, 2018–2027
Table 36: Brazil Artificial Lift Systems Market Value (US$ Mn) Forecast, by Component, 2018–2027
Table 37: Brazil Artificial Lift Systems Market Value (US$ Mn) Forecast, by System, 2018–2027
Table 38: Mexico Artificial Lift Systems Market Value (US$ Mn) Forecast, by Component, 2018–2027
Table 39: Mexico Artificial Lift Systems Market Value (US$ Mn) Forecast, by System, 2018–2027
Table 40: Venezuela Artificial Lift Systems Market Value (US$ Mn) Forecast, by Component, 2018–2027
Table 41: Venezuela Artificial Lift Systems Market Value (US$ Mn) Forecast, by System, 2018–2027
Table 42: Rest of Latin America Artificial Lift Systems Market Value (US$ Mn) Forecast, by Component, 2018–2027
Table 43: Rest of Latin America Artificial Lift Systems Market Value (US$ Mn) Forecast, by System, 2018–2027
Table 44: Middle East & Africa Artificial Lift Systems Market Value (US$ Mn) Forecast, by Component, 2018–2027
Table 45: Middle East & Africa Artificial Lift Systems Market Value (US$ Mn) Forecast, by System, 2018–2027
Table 46: Middle East & Africa Artificial Lift Systems Market Value (US$ Mn) Forecast, by Country and Sub-region, 2018–2027
Table 47: GCC Artificial Lift Systems Market Value (US$ Mn) Forecast, by Component, 2018–2027
Table 48: GCC Artificial Lift Systems Market Value (US$ Mn) Forecast, by System, 2018–2027
Table 49: Nigeria Artificial Lift Systems Market Value (US$ Mn) Forecast, by Component, 2018–2027
Table 50: Nigeria Artificial Lift Systems Market Value (US$ Mn) Forecast, by System, 2018–2027
Table 51: Rest of Middle East & Africa Artificial Lift Systems Market Value (US$ Mn) Forecast, by Component, 2018–2027
Table 52: Rest of Middle East & Africa Artificial Lift Systems Market Value (US$ Mn) Forecast, by System, 2018–2027
List of Figures
Figure 01: Global Artificial Lift Systems Market Value Share Analysis, by Component
Figure 02: Global Artificial Lift Systems Market Attractiveness Analysis, by Component
Figure 03: Global Artificial Lift Systems Market Value Share Analysis, by System
Figure 04: Global Artificial Lift Systems Market Attractiveness Analysis, by System
Figure 05: Global Artificial Lift Systems Market Value Share Analysis, by Region
Figure 06: Global Artificial Lift Systems Market Attractiveness Analysis, by Region
Figure 07: North America Artificial Lift Systems Market Value (US$ Mn), 2018–2027
Figure 08: North America Artificial Lift Systems Market Value Share Analysis, by Country
Figure 09: North America Artificial Lift Systems Market Attractiveness Analysis, by Country
Figure 10: North America Artificial Lift Systems Market Value Share Analysis, by Component
Figure 11: North America Artificial Lift Systems Market Attractiveness Analysis, by Component
Figure 12: North America Artificial Lift Systems Market Value Share Analysis, by System
Figure 13: North America Artificial Lift Systems Market Attractiveness Analysis, by System
Figure 14: Europe Artificial Lift Systems Market Value (US$ Mn), 2018–2027
Figure 15: Europe Artificial Lift Systems Market Value Share Analysis, by Country and Sub-region
Figure 16: Europe Artificial Lift Systems Market Attractiveness Analysis, by Country and Sub-region
Figure 17: Europe Artificial Lift Systems Market Value Share Analysis, by Component
Figure 18: Europe Artificial Lift Systems Market Attractiveness Analysis, by Component
Figure 19: Europe Artificial Lift Systems Market Value Share Analysis, by System
Figure 20: Europe Artificial Lift Systems Market Attractiveness Analysis, by System
Figure 21: Asia Pacific Artificial Lift Systems Market Value (US$ Mn), 2018–2027
Figure 22: Asia Pacific Artificial Lift Systems Market Value Share Analysis, by Country and Sub-region
Figure 23: Asia Pacific Artificial Lift Systems Market Attractiveness Analysis, by Country and Sub-region
Figure 24: Asia Pacific Artificial Lift Systems Market Value Share Analysis, by Component
Figure 25: Asia Pacific Artificial Lift Systems Market Attractiveness Analysis, by Component
Figure 26: Asia Pacific Artificial Lift Systems Market Value Share Analysis, by System
Figure 27: Asia Pacific Artificial Lift Systems Market Attractiveness Analysis, by System
Figure 28: Latin America Artificial Lift Systems Market Value (US$ Mn), 2018–2027
Figure 29: Latin America Artificial Lift Systems Market Share Analysis, by Country and Sub-region
Figure 30: Latin America Artificial Lift Systems Market Attractiveness Analysis, by Country and Sub-region
Figure 31: Latin America Artificial Lift Systems Market Value Share Analysis, by Component
Figure 32: Latin America Artificial Lift Systems Market Attractiveness Analysis, by Component
Figure 33: Latin America Artificial Lift Systems Market Share Analysis, by System
Figure 34: Latin America Artificial Lift Systems Market Attractiveness Analysis, by System
Figure 35: Middle East & Africa Artificial Lift Systems Market Value (US$ Mn), 2018–2027
Figure 36: Middle East & Africa Artificial Lift Systems Market Value Share Analysis, by Country and Sub-region
Figure 37: Middle East & Africa Artificial Lift Systems Market Attractiveness Analysis, by Country and Sub-region
Figure 38: Middle East & Africa Artificial Lift Systems Market Value Share Analysis, by Component
Figure 39: Middle East & Africa Artificial Lift Systems Market Attractiveness Analysis, by Component
Figure 40: Middle East & Africa Artificial Lift Systems Market Value Share Analysis, by System
Figure 41: Middle East & Africa Artificial Lift Systems Market Attractiveness Analysis, by System
Figure 42: Global Artificial Lift Systems Market Share Analysis, by Company, 2018
Figure 43: Net Sales (US$ Mn) and Y-o-Y Growth (%), 2015–2018
Figure 44: Breakdown of Revenue, by Region, 2018
Figure 45: Breakdown of Revenue, by Business Segment, 2018
Figure 46: Net Sales (US$ Mn) and Y-o-Y Growth (%), 2015–2018
Figure 47: Breakdown of Revenue, by Region, 2018
Figure 48: Breakdown of Revenue, by Business Segment, 2018
Figure 49: Net Sales (US$ Mn) and Y-o-Y Growth (%), 2015–2018
Figure 50: Breakdown of Revenue, by Region, 2018
Figure 51: Breakdown of Revenue, by Business Segment, 2018
Figure 52: Net Sales (US$ Mn) and Y-o-Y Growth (%), 2015–2018
Figure 53: Breakdown of Revenue, by Region, 2018
Figure 54: Breakdown of Revenue, by Business Segment, 2018
Figure 55: Net Sales (US$ Mn) and Y-o-Y Growth (%), 2015–2018
Figure 56: Breakdown of Revenue, by Region, 2018
Figure 57: Breakdown of Revenue, by Business Segment, 2018
Figure 58: Net Sales (US$ Mn) and Y-o-Y Growth (%), 2015–2018
Figure 59: Breakdown of Revenue, by Region, 2018
Figure 60: Net Sales (US$ Mn) and Y-o-Y Growth (%), 2015–2018
Figure 61: Net Sales (US$ Mn) and Y-o-Y Growth (%), 2015–2018
Figure 62: Breakdown of Revenue, by Region, 2018
Figure 63: Net Sales (US$ Mn) and Y-o-Y Growth (%), 2015–2018
Figure 64: Breakdown of Revenue, by Region, 2018
Copyright © Transparency Market Research, Inc. All Rights reserved
Trust Online

Artificial Lift Systems Market