
Reports
Reports
Ginger is the underground stem of an herb named perennial, which is utilized as a flavoring agent and as an additive. Ginger is generally utilized as a zest, for pickles, confections and as a restorative or medicinal herb. It is manufactured in numerous economies, for example, India, China, Indonesia, Brazil and so on which have humid and tropical conditions. It is accessible in various types, for example, crude ginger, dry ginger, faded dry ginger, ginger powder, ginger oil, ginger oleoresin, ginger treats, ginger lager, brined ginger, ginger wine, ginger squash, ginger pieces and so forth. Gingerol is the dynamic constituent of ginger that is detached and different investigations are performed to think about the pharmacological and lethal impacts. Ginger has properties, for example, antiplatelet, antibacterial, antifungal, antiviral, calming and against oxidative.
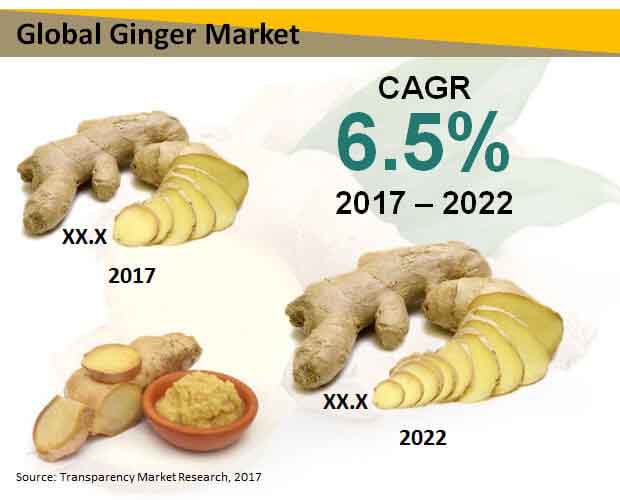
Furthermore, the extending application base of ginger, from meds to mixed refreshments, is foreseen to support the worldwide ginger market in the years to come. The market is anticipated to pick up US$3.06 bn by 2017 in incomes. The prospects in this market are anticipated to multiply at a CAGR of 6.50% somewhere in the range of 2017 and 2022, achieving an estimation of US$4.18 bn before the finish of 2022.
Generally, ginger is found in powdered, dried, fresh, preserved, pickled, and crystallized structures over the globe. The need for fresh ginger is a lot higher than its different types. Extending at a CAGR of 7.30% somewhere in the range of 2017 and 2022, this portion is foreseen to remain the most conspicuous one in the years to come.
Ginger finds extensive application in convenience food and snacks, culinary, bakery products, sauces and soups, alcoholic beverages, non-alcoholic beverages, and, confectionery and chocolate. The culinary category has surfaced as the primary application zone of ginger and is anticipated to remain so in the near future. Conventional staple retail, non-basic supply retail, and present day basic supply retail are the prime conveyance channels of ginger over the world.
North America, the Middle East and Africa (MEA), Asia Pacific, Europe, and Latin America have risen as the key provincial ginger market over the world. Of these, the Asia Pacific area has surfaced as the most alluring provincial market for ginger and gained the main position in the worldwide market. Advancing at a CAGR of 7.10% amid the period from 2017 to 2022, the Asia Pacific ginger market is anticipated to encounter a skyscraper in the forthcoming years, along these lines holding its authority on the global market.
The huge growth in Ayurveda industry in Asian Pacific, has affected the creation of therapeutic flavors in which ginger has a noteworthy fragment. Hence, the ginger market for ginger in Asia Pacific is positively driven. Scientists foresee the situation to continue as before throughout the following couple of years.
Among other local markets for ginger, the Middle East and Africa, Europe, and North America are required to enroll an enduring ascent in their individual ginger markets over the pending years. While the Middle East and Africa market will pick up from the expanding creation of flavors; the North America and Europe markets will profit by the rising attention to the therapeutic characteristics of ginger among buyers, together with increasing inclination for natural and bio-based solutions for sicknesses.
At the front line of the worldwide ginger market are Indian Organic Farmers Producer Co. Ltd, Archer-Daniels-Midland Co., Sun Impex International Foods L.L.C., Monterey Bay Spice Co. Inc., and Yummy Food Industrial Group.
Ayurvedic Properties of Ginger Market to Help Boost Market
Ginger is the underground stem of a spice named perpetual, which is used as a seasoning specialist and as an added substance. Ginger is by and large used for pickles, as a remedial or restorative spice, sugary treats and as a zing,. It is produced in various economies, for instance, India, China, Indonesia, Brazil, etc which have sticky and tropical conditions. It is open in different sorts, for instance, ginger oleoresin, ginger squash, blurred dry ginger, ginger ale, unrefined ginger, ginger treats, dry ginger, ginger pieces, ginger oil, ginger wine, tenderized ginger, ginger powder, and others. Gingerol is the powerful constituent of ginger that is disconnected and various examinations are performed to consider the pharmacological and deadly effects. Ginger has properties, for instance, antiplatelet, antibacterial, antifungal, antiviral, quieting and against oxidative.
Ginger finds broad application in comfort food and bites, culinary, bread shop items, sauces and soups, mixed refreshments, non-mixed drinks, and, candy store and chocolate. The culinary class has surfaced as the essential application zone of ginger and is expected to remain so soon. Traditional staple retail, non-essential stock retail, and present day fundamental stockpile retail are the excellent transport channels of ginger over the world.
The worldwide ginger market has acquired massive fame in the new years as the zest helps in relieving numerous infections like malignancy, sickness, cardiovascular illnesses and diabetes. Aside from being cure structure normal contaminations like cold and hack, it additionally helps in improving heartburn, joint pain, stiffness, hypertension, blockage, ulcers, and atherosclerosis. In this manner the worldwide ginger market is projected to appreciate the benefit of various positive elements to expand request within a reasonable time-frame. In the coming years, the ginger market is normal see a consistent development in its application base from medication to liquor and drinks, which will help the general utilization of ginger universally.
1. Global Ginger Market - Executive Summary
2. Global Ginger Market Overview
2.1. Introduction
2.1.1. Global Ginger Market Taxonomy
2.1.2. Global Ginger Market Definition
2.2. Global Ginger Market Size (US$ Mn) and Forecast, 2012-2022
2.2.1. Global Ginger Market Y-o-Y Growth
2.3. Global Ginger Market Dynamics
2.4. Supply Chain
2.5. Value Chain
2.6. Trade Analysis
2.7. Product Innovations
2.8. List of Distributors
2.9. Key Participants in the Market
3. Global Ginger Market Analysis and Forecast By Form
3.1. Global Ginger Market Size and Forecast By Form, 2012-2022
3.1.1. Fresh Market Size and Forecast, 2012-2022
3.1.1.1. Revenue (US$ Mn) Comparison, By Region
3.1.1.2. Market Share Comparison, By Region
3.1.1.3. Y-o-Y growth Comparison, By Region
3.1.2. Dried Market Size and Forecast, 2012-2022
3.1.2.1. Revenue (US$ Mn) Comparison, By Region
3.1.2.2. Market Share Comparison, By Region
3.1.2.3. Y-o-Y growth Comparison, By Region
3.1.3. Pickled Market Size and Forecast, 2012-2022
3.1.3.1. Revenue (US$ Mn) Comparison, By Region
3.1.3.2. Market Share Comparison, By Region
3.1.3.3. Y-o-Y growth Comparison, By Region
3.1.4. Preserved Market Size and Forecast, 2012-2022
3.1.4.1. Revenue (US$ Mn) Comparison, By Region
3.1.4.2. Market Share Comparison, By Region
3.1.4.3. Y-o-Y growth Comparison, By Region
3.1.5. Crystallized Market Size and Forecast, 2012-2022
3.1.5.1. Revenue (US$ Mn) Comparison, By Region
3.1.5.2. Market Share Comparison, By Region
3.1.5.3. Y-o-Y growth Comparison, By Region
3.1.6. Powdered Market Size and Forecast, 2012-2022
3.1.6.1. Revenue (US$ Mn) Comparison, By Region
3.1.6.2. Market Share Comparison, By Region
3.1.6.3. Y-o-Y growth Comparison, By Region
3.1.7. Other Forms Market Size and Forecast, 2012-2022
3.1.7.1. Revenue (US$ Mn) Comparison, By Region
3.1.7.2. Market Share Comparison, By Region
3.1.7.3. Y-o-Y growth Comparison, By Region
4. Global Ginger Market Analysis and Forecast By Distribution Channel
4.1. Global Ginger Market Size and Forecast By Distribution Channel, 2012-2022
4.1.1. Modern Grocery Retail Market Size and Forecast, 2012-2022
4.1.1.1. Revenue (US$ Mn) Comparison, By Region
4.1.1.2. Market Share Comparison, By Region
4.1.1.3. Y-o-Y growth Comparison, By Region
4.1.2. Traditional Grocery Retail Market Size and Forecast, 2012-2022
4.1.2.1. Revenue (US$ Mn) Comparison, By Region
4.1.2.2. Market Share Comparison, By Region
4.1.2.3. Y-o-Y growth Comparison, By Region
4.1.3. Non-Grocery Retail Market Size and Forecast, 2012-2022
4.1.3.1. Revenue (US$ Mn) Comparison, By Region
4.1.3.2. Market Share Comparison, By Region
4.1.3.3. Y-o-Y growth Comparison, By Region
4.1.4. Other channels Market Size and Forecast, 2012-2022
4.1.4.1. Revenue (US$ Mn) Comparison, By Region
4.1.4.2. Market Share Comparison, By Region
4.1.4.3. Y-o-Y growth Comparison, By Region
5. Global Ginger Market Analysis and Forecast By Application
5.1. Global Ginger Market Size and Forecast By Application, 2012-2022
5.1.1. Culinary Market Size and Forecast, 2012-2022
5.1.1.1. Revenue (US$ Mn) Comparison, By Region
5.1.1.2. Market Share Comparison, By Region
5.1.1.3. Y-o-Y growth Comparison, By Region
5.1.2. Soups and Sauces Market Size and Forecast, 2012-2022
5.1.2.1. Revenue (US$ Mn) Comparison, By Region
5.1.2.2. Market Share Comparison, By Region
5.1.2.3. Y-o-Y growth Comparison, By Region
5.1.3. Snacks & Convenience Food Market Size and Forecast, 2012-2022
5.1.3.1. Revenue (US$ Mn) Comparison, By Region
5.1.3.2. Market Share Comparison, By Region
5.1.3.3. Y-o-Y growth Comparison, By Region
5.1.4. Bakery Products Market Size and Forecast, 2012-2022
5.1.4.1. Revenue (US$ Mn) Comparison, By Region
5.1.4.2. Market Share Comparison, By Region
5.1.4.3. Y-o-Y growth Comparison, By Region
5.1.5. Alcoholic Beverages Market Size and Forecast, 2012-2022
5.1.5.1. Revenue (US$ Mn) Comparison, By Region
5.1.5.2. Market Share Comparison, By Region
5.1.5.3. Y-o-Y growth Comparison, By Region
5.1.6. Non-Alcoholic Beverages Market Size and Forecast, 2012-2022
5.1.6.1. Revenue (US$ Mn) Comparison, By Region
5.1.6.2. Market Share Comparison, By Region
5.1.6.3. Y-o-Y growth Comparison, By Region
5.1.7. Chocolate and Confectionery Market Size and Forecast, 2012-2022
5.1.7.1. Revenue (US$ Mn) Comparison, By Region
5.1.7.2. Market Share Comparison, By Region
5.1.7.3. Y-o-Y growth Comparison, By Region
5.1.8. Other Applications Market Size and Forecast, 2012-2022
5.1.8.1. Revenue (US$ Mn) Comparison, By Region
5.1.8.2. Market Share Comparison, By Region
5.1.8.3. Y-o-Y growth Comparison, By Region
6. Global Ginger Market Analysis and Forecast By Region
6.1. Global Ginger Market Size and Forecast, 2012-2022
6.1.1. North America Ginger Market Size and Forecast, 2012-2022
6.1.1.1. Revenue (US$ Mn) Comparison, By Form
6.1.1.2. Revenue (US$ Mn) Comparison, By Distribution Channel
6.1.1.3. Revenue (US$ Mn) Comparison, By Application
6.1.2. Latin America Ginger Market Size and Forecast, 2012-2022
6.1.2.1. Revenue (US$ Mn) Comparison, By Form
6.1.2.2. Revenue (US$ Mn) Comparison, By Distribution Channel
6.1.2.3. Revenue (US$ Mn) Comparison, By Application
6.1.3. Europe Ginger Market Size and Forecast, 2012-2022
6.1.3.1. Revenue (US$ Mn) Comparison, By Form
6.1.3.2. Revenue (US$ Mn) Comparison, By Distribution Channel
6.1.3.3. Revenue (US$ Mn) Comparison, By Application
6.1.4. Japan Ginger Market Size and Forecast, 2012-2022
6.1.4.1. Revenue (US$ Mn) Comparison, By Form
6.1.4.2. Revenue (US$ Mn) Comparison, By Distribution Channel
6.1.4.3. Revenue (US$ Mn) Comparison, By Application
6.1.5. APEJ Ginger Market Size and Forecast, 2012-2022
6.1.5.1. Revenue (US$ Mn) Comparison, By Form
6.1.5.2. Revenue (US$ Mn) Comparison, By Distribution Channel
6.1.5.3. Revenue (US$ Mn) Comparison, By Application
6.1.6. MEA Ginger Market Size and Forecast, 2012-2022
6.1.6.1. Revenue (US$ Mn) Comparison, By Form
6.1.6.2. Revenue (US$ Mn) Comparison, By Distribution Channel
6.1.6.3. Revenue (US$ Mn) Comparison, By Application
7. North America Ginger Market Analysis and Forecast, By Country, 2012-2022
7.1. US Ginger Market Size and Forecast, 2012-2022
7.1.1. Revenue (US$ Mn) Comparison, By Form
7.1.2. Revenue (US$ Mn) Comparison, By Distribution Channel
7.1.3. Revenue (US$ Mn) Comparison, By Application
7.2. Canada Ginger Market Size and Forecast, 2012-2022
7.2.1. Revenue (US$ Mn) Comparison, By Form
7.2.2. Revenue (US$ Mn) Comparison, By Distribution Channel
7.2.3. Revenue (US$ Mn) Comparison, By Application
8. Latin America Ginger Market Analysis and Forecast, By Country, 2012-2022
8.1. Brazil Ginger Market Size and Forecast, 2012-2022
8.1.1. Revenue (US$ Mn) Comparison, By Form
8.1.2. Revenue (US$ Mn) Comparison, By Distribution Channel
8.1.3. Revenue (US$ Mn) Comparison, By Application
8.2. Mexico Ginger Market Size and Forecast, 2012-2022
8.2.1. Revenue (US$ Mn) Comparison, By Form
8.2.2. Revenue (US$ Mn) Comparison, By Distribution Channel
8.2.3. Revenue (US$ Mn) Comparison, By Application
8.3. Argentina Ginger Market Size and Forecast, 2012-2022
8.3.1. Revenue (US$ Mn) Comparison, By Form
8.3.2. Revenue (US$ Mn) Comparison, By Distribution Channel
8.3.3. Revenue (US$ Mn) Comparison, By Application
9. Europe Ginger Market Analysis and Forecast, By Country, 2012-2022
9.1. Germany Ginger Market Size and Forecast, 2012-2022
9.1.1. Revenue (US$ Mn) Comparison, By Form
9.1.2. Revenue (US$ Mn) Comparison, By Distribution Channel
9.1.3. Revenue (US$ Mn) Comparison, By Application
9.2. UK Ginger Market Size and Forecast, 2012-2022
9.2.1. Revenue (US$ Mn) Comparison, By Form
9.2.2. Revenue (US$ Mn) Comparison, By Distribution Channel
9.2.3. Revenue (US$ Mn) Comparison, By Application
9.3. France Ginger Market Size and Forecast, 2012-2022
9.3.1. Revenue (US$ Mn) Comparison, By Form
9.3.2. Revenue (US$ Mn) Comparison, By Distribution Channel
9.3.3. Revenue (US$ Mn) Comparison, By Application
9.4. Spain Ginger Market Size and Forecast, 2012-2022
9.4.1. Revenue (US$ Mn) Comparison, By Form
9.4.2. Revenue (US$ Mn) Comparison, By Distribution Channel
9.4.3. Revenue (US$ Mn) Comparison, By Application
9.5. Italy Ginger Market Size and Forecast, 2012-2022
9.5.1. Revenue (US$ Mn) Comparison, By Form
9.5.2. Revenue (US$ Mn) Comparison, By Distribution Channel
9.5.3. Revenue (US$ Mn) Comparison, By Application
9.6. Nordic Ginger Market Size and Forecast, 2012-2022
9.6.1. Revenue (US$ Mn) Comparison, By Form
9.6.2. Revenue (US$ Mn) Comparison, By Distribution Channel
9.6.3. Revenue (US$ Mn) Comparison, By Application
10. Japan Ginger Market Analysis and Forecast, By Country, 2012-2022
10.1. Japan Ginger Market Size and Forecast, 2012-2022
10.1.1. Revenue (US$ Mn) Comparison, By Form
10.1.2. Revenue (US$ Mn) Comparison, By Distribution Channel
10.1.3. Revenue (US$ Mn) Comparison, By Application
11. APEJ Ginger Market Analysis and Forecast, By Country, 2012-2022
11.1. China Ginger Market Size and Forecast, 2012-2022
11.1.1. Revenue (US$ Mn) Comparison, By Form
11.1.2. Revenue (US$ Mn) Comparison, By Distribution Channel
11.1.3. Revenue (US$ Mn) Comparison, By Application
11.2. India Ginger Market Size and Forecast, 2012-2022
11.2.1. Revenue (US$ Mn) Comparison, By Form
11.2.2. Revenue (US$ Mn) Comparison, By Distribution Channel
11.2.3. Revenue (US$ Mn) Comparison, By Application
11.3. Malaysia Ginger Market Size and Forecast, 2012-2022
11.3.1. Revenue (US$ Mn) Comparison, By Form
11.3.2. Revenue (US$ Mn) Comparison, By Distribution Channel
11.3.3. Revenue (US$ Mn) Comparison, By Application
11.4. Thailand Ginger Market Size and Forecast, 2012-2022
11.4.1. Revenue (US$ Mn) Comparison, By Form
11.4.2. Revenue (US$ Mn) Comparison, By Distribution Channel
11.4.3. Revenue (US$ Mn) Comparison, By Application
11.5. Singapore Ginger Market Size and Forecast, 2012-2022
11.5.1. Revenue (US$ Mn) Comparison, By Form
11.5.2. Revenue (US$ Mn) Comparison, By Distribution Channel
11.5.3. Revenue (US$ Mn) Comparison, By Application
11.6. Australia Ginger Market Size and Forecast, 2012-2022
11.6.1. Revenue (US$ Mn) Comparison, By Form
11.6.2. Revenue (US$ Mn) Comparison, By Distribution Channel
11.6.3. Revenue (US$ Mn) Comparison, By Application
12. MEA Ginger Market Analysis and Forecast, By Country, 2012-2022
12.1. GCC Countries Ginger Market Size and Forecast, 2012-2022
12.1.1. Revenue (US$ Mn) Comparison, By Form
12.1.2. Revenue (US$ Mn) Comparison, By Distribution Channel
12.1.3. Revenue (US$ Mn) Comparison, By Application
12.2. South Africa Ginger Market Size and Forecast, 2012-2022
12.2.1. Revenue (US$ Mn) Comparison, By Form
12.2.2. Revenue (US$ Mn) Comparison, By Distribution Channel
12.2.3. Revenue (US$ Mn) Comparison, By Application
12.3. Nigeria Ginger Market Size and Forecast, 2012-2022
12.3.1. Revenue (US$ Mn) Comparison, By Form
12.3.2. Revenue (US$ Mn) Comparison, By Distribution Channel
12.3.3. Revenue (US$ Mn) Comparison, By Application
12.4. Israel Ginger Market Size and Forecast, 2012-2022
12.4.1. Revenue (US$ Mn) Comparison, By Form
12.4.2. Revenue (US$ Mn) Comparison, By Distribution Channel
12.4.3. Revenue (US$ Mn) Comparison, By Application
13. Global Ginger Market Company Share, Competition Landscape and Company Profiles
13.1. Company Share Analysis
13.2. Competition Landscape
13.3. Company Profiles
13.3.1. Indian Organic Farmers Producer Company Ltd.
13.3.2. Food Market Management Incorporated
13.3.3. Sun Impex International Foods L.L.C.
13.3.4. Sino-Nature International Co.Ltd
13.3.5. Yummy Food Industrial Group
13.3.6. SA Rawther Spices Pvt Ltd
13.3.7. Archer-Daniels-Midland Company
13.3.8. Buderim Group Limited,
13.3.9. Monterey Bay Spice Company Inc.
13.3.10. Atmiya International
14. Research Methodology
15. Secondary and Primary Sources
16. Assumptions and Acronyms
17. Disclaimer
List of Tables
TABLE 1 Global Ginger Market Value (US$ Mn), 2012-2016
TABLE 2 Global Ginger Market Value (US$ Mn), 2017-2022
TABLE 3 Global Ginger Market Value (US$ Mn) and Y-o-Y, 2015-2022
TABLE 4 Global Fresh Segment Value (US$ Mn), By Region 2012-2016
TABLE 5 Global Fresh Segment Value (US$ Mn), By Region 2017-2022
TABLE 6 Global Fresh Segment Market Share, By Region 2012-2016
TABLE 7 Global Fresh Segment Market Share, By Region 2017-2022
TABLE 8 Global Fresh Segment Y-o-Y, By Region 2015-2022
TABLE 9 Global Dried Segment Value (US$ Mn), By Region 2012-2016
TABLE 10 Global Dried Segment Value (US$ Mn), By Region 2017-2022
TABLE 11 Global Dried Segment Market Share, By Region 2012-2016
TABLE 12 Global Dried Segment Market Share, By Region 2017-2022
TABLE 13 Global Dried Segment Y-o-Y, By Region 2015-2022
TABLE 14 Global Pickled Segment Value (US$ Mn), By Region 2012-2016
TABLE 15 Global Pickled Segment Value (US$ Mn), By Region 2017-2022
TABLE 16 Global Pickled Segment Market Share, By Region 2012-2016
TABLE 17 Global Pickled Segment Market Share, By Region 2017-2022
TABLE 18 Global Pickled Segment Y-o-Y, By Region 2015-2022
TABLE 19 Global Preserved Segment Value (US$ Mn), By Region 2012-2016
TABLE 20 Global Preserved Segment Value (US$ Mn), By Region 2017-2022
TABLE 21 Global Preserved Segment Market Share, By Region 2012-2016
TABLE 22 Global Preserved Segment Market Share, By Region 2017-2022
TABLE 23 Global Preserved Segment Y-o-Y, By Region 2015-2022
TABLE 24 Global Crystallized Segment Value (US$ Mn), By Region 2012-2016
TABLE 25 Global Crystallized Segment Value (US$ Mn), By Region 2017-2022
TABLE 26 Global Crystallized Segment Market Share, By Region 2012-2016
TABLE 27 Global Crystallized Segment Market Share, By Region 2017-2022
TABLE 28 Global Crystallized Segment Y-o-Y, By Region 2015-2022
TABLE 29 Global Powdered Segment Value (US$ Mn), By Region 2012-2016
TABLE 30 Global Powdered Segment Value (US$ Mn), By Region 2017-2022
TABLE 31 Global Powdered Segment Market Share, By Region 2012-2016
TABLE 32 Global Powdered Segment Market Share, By Region 2017-2022
TABLE 33 Global Powdered Segment Y-o-Y, By Region 2015-2022
TABLE 34 Global Other Forms Segment Value (US$ Mn), By Region 2012-2016
TABLE 35 Global Other Forms Segment Value (US$ Mn), By Region 2017-2022
TABLE 36 Global Other Forms Segment Market Share, By Region 2012-2016
TABLE 37 Global Other Forms Segment Market Share, By Region 2017-2022
TABLE 38 Global Other Forms Segment Y-o-Y, By Region 2015-2022
TABLE 39 Global Modern Grocery Retail Segment Value (US$ Mn), By Region 2012-2016
TABLE 40 Global Modern Grocery Retail Segment Value (US$ Mn), By Region 2017-2022
TABLE 41 Global Modern Grocery Retail Segment Market Share, By Region 2012-2016
TABLE 42 Global Modern Grocery Retail Segment Market Share, By Region 2017-2022
TABLE 43 Global Modern Grocery Retail Segment Y-o-Y, By Region 2015-2022
TABLE 44 Global Traditional Grocery Retail Segment Value (US$ Mn), By Region 2012-2016
TABLE 45 Global Traditional Grocery Retail Segment Value (US$ Mn), By Region 2017-2022
TABLE 46 Global Traditional Grocery Retail Segment Market Share, By Region 2012-2016
TABLE 47 Global Traditional Grocery Retail Segment Market Share, By Region 2017-2022
TABLE 48 Global Traditional Grocery Retail Segment Y-o-Y, By Region 2015-2022
TABLE 49 Global Non-Grocery Retail Segment Value (US$ Mn), By Region 2012-2016
TABLE 50 Global Non-Grocery Retail Segment Value (US$ Mn), By Region 2017-2022
TABLE 51 Global Non-Grocery Retail Segment Market Share, By Region 2012-2016
TABLE 52 Global Non-Grocery Retail Segment Market Share, By Region 2017-2022
TABLE 53 Global Non-Grocery Retail Segment Y-o-Y, By Region 2015-2022
TABLE 54 Global Other channels Segment Value (US$ Mn), By Region 2012-2016
TABLE 55 Global Other channels Segment Value (US$ Mn), By Region 2017-2022
TABLE 56 Global Other channels Segment Market Share, By Region 2012-2016
TABLE 57 Global Other channels Segment Market Share, By Region 2017-2022
TABLE 58 Global Other channels Segment Y-o-Y, By Region 2015-2022
TABLE 59 Global Culinary Segment Value (US$ Mn), By Region 2012-2016
TABLE 60 Global Culinary Segment Value (US$ Mn), By Region 2017-2022
TABLE 61 Global Culinary Segment Market Share, By Region 2012-2016
TABLE 62 Global Culinary Segment Market Share, By Region 2017-2022
TABLE 63 Global Culinary Segment Y-o-Y, By Region 2015-2022
TABLE 64 Global Soups and Sauces Segment Value (US$ Mn), By Region 2012-2016
TABLE 65 Global Soups and Sauces Segment Value (US$ Mn), By Region 2017-2022
TABLE 66 Global Soups and Sauces Segment Market Share, By Region 2012-2016
TABLE 67 Global Soups and Sauces Segment Market Share, By Region 2017-2022
TABLE 68 Global Soups and Sauces Segment Y-o-Y, By Region 2015-2022
TABLE 69 Global Snacks & Convenience Food Segment Value (US$ Mn), By Region 2012-2016
TABLE 70 Global Snacks & Convenience Food Segment Value (US$ Mn), By Region 2017-2022
TABLE 71 Global Snacks & Convenience Food Segment Market Share, By Region 2012-2016
TABLE 72 Global Snacks & Convenience Food Segment Market Share, By Region 2017-2022
TABLE 73 Global Snacks & Convenience Food Segment Y-o-Y, By Region 2015-2022
TABLE 74 Global Bakery Products Segment Value (US$ Mn), By Region 2012-2016
TABLE 75 Global Bakery Products Segment Value (US$ Mn), By Region 2017-2022
TABLE 76 Global Bakery Products Segment Market Share, By Region 2012-2016
TABLE 77 Global Bakery Products Segment Market Share, By Region 2017-2022
TABLE 78 Global Bakery Products Segment Y-o-Y, By Region 2015-2022
TABLE 79 Global Alcoholic Beverages Segment Value (US$ Mn), By Region 2012-2016
TABLE 80 Global Alcoholic Beverages Segment Value (US$ Mn), By Region 2017-2022
TABLE 81 Global Alcoholic Beverages Segment Market Share, By Region 2012-2016
TABLE 82 Global Alcoholic Beverages Segment Market Share, By Region 2017-2022
TABLE 83 Global Alcoholic Beverages Segment Y-o-Y, By Region 2015-2022
TABLE 84 Global Non-Alcoholic Beverages Segment Value (US$ Mn), By Region 2012-2016
TABLE 85 Global Non-Alcoholic Beverages Segment Value (US$ Mn), By Region 2017-2022
TABLE 86 Global Non-Alcoholic Beverages Segment Market Share, By Region 2012-2016
TABLE 87 Global Non-Alcoholic Beverages Segment Market Share, By Region 2017-2022
TABLE 88 Global Non-Alcoholic Beverages Segment Y-o-Y, By Region 2015-2022
TABLE 89 Global Chocolate and Confectionery Segment Value (US$ Mn), By Region 2012-2016
TABLE 90 Global Chocolate and Confectionery Segment Value (US$ Mn), By Region 2017-2022
TABLE 91 Global Chocolate and Confectionery Segment Market Share, By Region 2012-2016
TABLE 92 Global Chocolate and Confectionery Segment Market Share, By Region 2017-2022
TABLE 93 Global Chocolate and Confectionery Segment Y-o-Y, By Region 2015-2022
TABLE 94 Global Other Applications Segment Value (US$ Mn), By Region 2012-2016
TABLE 95 Global Other Applications Segment Value (US$ Mn), By Region 2017-2022
TABLE 96 Global Other Applications Segment Market Share, By Region 2012-2016
TABLE 97 Global Other Applications Segment Market Share, By Region 2017-2022
TABLE 98 Global Other Applications Segment Y-o-Y, By Region 2015-2022
TABLE 99 North America Ginger Market Value (US$ Mn), By Form 2012-2016
TABLE 100 North America Ginger Market Value (US$ Mn), By Form 2017-2022
TABLE 101 North America Ginger Market Value (US$ Mn), By Distribution Channel 2012-2016
TABLE 102 North America Ginger Market Value (US$ Mn), By Distribution Channel 2017-2022
TABLE 103 North America Ginger Market Value (US$ Mn), By Application2012-2016
TABLE 104 North America Ginger Market Value (US$ Mn), By Application2017-2022
TABLE 105 Latin America Ginger Market Value (US$ Mn), By Form 2012-2016
TABLE 106 Latin America Ginger Market Value (US$ Mn), By Form 2017-2022
TABLE 107 Latin America Ginger Market Value (US$ Mn), By Distribution Channel 2012-2016
TABLE 108 Latin America Ginger Market Value (US$ Mn), By Distribution Channel 2017-2022
TABLE 109 Latin America Ginger Market Value (US$ Mn), By Application2012-2016
TABLE 110 Latin America Ginger Market Value (US$ Mn), By Application2017-2022
TABLE 111 Europe Ginger Market Value (US$ Mn), By Form 2012-2016
TABLE 112 Europe Ginger Market Value (US$ Mn), By Form 2017-2022
TABLE 113 Europe Ginger Market Value (US$ Mn), By Distribution Channel 2012-2016
TABLE 114 Europe Ginger Market Value (US$ Mn), By Distribution Channel 2017-2022
TABLE 115 Europe Ginger Market Value (US$ Mn), By Application2012-2016
TABLE 116 Europe Ginger Market Value (US$ Mn), By Application2017-2022
TABLE 117 Japan Ginger Market Value (US$ Mn), By Form 2012-2016
TABLE 118 Japan Ginger Market Value (US$ Mn), By Form 2017-2022
TABLE 119 Japan Ginger Market Value (US$ Mn), By Distribution Channel 2012-2016
TABLE 120 Japan Ginger Market Value (US$ Mn), By Distribution Channel 2017-2022
TABLE 121 Japan Ginger Market Value (US$ Mn), By Application2012-2016
TABLE 122 Japan Ginger Market Value (US$ Mn), By Application2017-2022
TABLE 123 APEJ Ginger Market Value (US$ Mn), By Form 2012-2016
TABLE 124 APEJ Ginger Market Value (US$ Mn), By Form 2017-2022
TABLE 125 APEJ Ginger Market Value (US$ Mn), By Distribution Channel 2012-2016
TABLE 126 APEJ Ginger Market Value (US$ Mn), By Distribution Channel 2017-2022
TABLE 127 APEJ Ginger Market Value (US$ Mn), By Application2012-2016
TABLE 128 APEJ Ginger Market Value (US$ Mn), By Application2017-2022
TABLE 129 MEA Ginger Market Value (US$ Mn), By Form 2012-2016
TABLE 130 MEA Ginger Market Value (US$ Mn), By Form 2017-2022
TABLE 131 MEA Ginger Market Value (US$ Mn), By Distribution Channel 2012-2016
TABLE 132 MEA Ginger Market Value (US$ Mn), By Distribution Channel 2017-2022
TABLE 133 MEA Ginger Market Value (US$ Mn), By Application2012-2016
TABLE 134 MEA Ginger Market Value (US$ Mn), By Application2017-2022
TABLE 135 US Ginger Market Value (US$ Mn), By Form 2012-2016
TABLE 136 US Ginger Market Value (US$ Mn), By Form 2017-2022
TABLE 137 US Ginger Market Value (US$ Mn), By Distribution Channel 2012-2016
TABLE 138 US Ginger Market Value (US$ Mn), By Distribution Channel 2017-2022
TABLE 139 US Ginger Market Value (US$ Mn), By Application2012-2016
TABLE 140 US Ginger Market Value (US$ Mn), By Application2017-2022
TABLE 141 Canada Ginger Market Value (US$ Mn), By Form 2012-2016
TABLE 142 Canada Ginger Market Value (US$ Mn), By Form 2017-2022
TABLE 143 Canada Ginger Market Value (US$ Mn), By Distribution Channel 2012-2016
TABLE 144 Canada Ginger Market Value (US$ Mn), By Distribution Channel 2017-2022
TABLE 145 Canada Ginger Market Value (US$ Mn), By Application2012-2016
TABLE 146 Canada Ginger Market Value (US$ Mn), By Application2017-2022
TABLE 147 Brazil Ginger Market Value (US$ Mn), By Form 2012-2016
TABLE 148 Brazil Ginger Market Value (US$ Mn), By Form 2017-2022
TABLE 149 Brazil Ginger Market Value (US$ Mn), By Distribution Channel 2012-2016
TABLE 150 Brazil Ginger Market Value (US$ Mn), By Distribution Channel 2017-2022
TABLE 151 Brazil Ginger Market Value (US$ Mn), By Application2012-2016
TABLE 152 Brazil Ginger Market Value (US$ Mn), By Application2017-2022
TABLE 153 Mexico Ginger Market Value (US$ Mn), By Form 2012-2016
TABLE 154 Mexico Ginger Market Value (US$ Mn), By Form 2017-2022
TABLE 155 Mexico Ginger Market Value (US$ Mn), By Distribution Channel 2012-2016
TABLE 156 Mexico Ginger Market Value (US$ Mn), By Distribution Channel 2017-2022
TABLE 157 Mexico Ginger Market Value (US$ Mn), By Application2012-2016
TABLE 158 Mexico Ginger Market Value (US$ Mn), By Application2017-2022
TABLE 159 Argentina Ginger Market Value (US$ Mn), By Form 2012-2016
TABLE 160 Argentina Ginger Market Value (US$ Mn), By Form 2017-2022
TABLE 161 Argentina Ginger Market Value (US$ Mn), By Distribution Channel 2012-2016
TABLE 162 Argentina Ginger Market Value (US$ Mn), By Distribution Channel 2017-2022
TABLE 163 Argentina Ginger Market Value (US$ Mn), By Application2012-2016
TABLE 164 Argentina Ginger Market Value (US$ Mn), By Application2017-2022
TABLE 165 Germany Ginger Market Value (US$ Mn), By Form 2012-2016
TABLE 166 Germany Ginger Market Value (US$ Mn), By Form 2017-2022
TABLE 167 Germany Ginger Market Value (US$ Mn), By Distribution Channel 2012-2016
TABLE 168 Germany Ginger Market Value (US$ Mn), By Distribution Channel 2017-2022
TABLE 169 Germany Ginger Market Value (US$ Mn), By Application2012-2016
TABLE 170 Germany Ginger Market Value (US$ Mn), By Application2017-2022
TABLE 171 UK Ginger Market Value (US$ Mn), By Form 2012-2016
TABLE 172 UK Ginger Market Value (US$ Mn), By Form 2017-2022
TABLE 173 UK Ginger Market Value (US$ Mn), By Distribution Channel 2012-2016
TABLE 174 UK Ginger Market Value (US$ Mn), By Distribution Channel 2017-2022
TABLE 175 UK Ginger Market Value (US$ Mn), By Application2012-2016
TABLE 176 UK Ginger Market Value (US$ Mn), By Application2017-2022
TABLE 177 France Ginger Market Value (US$ Mn), By Form 2012-2016
TABLE 178 France Ginger Market Value (US$ Mn), By Form 2017-2022
TABLE 179 France Ginger Market Value (US$ Mn), By Distribution Channel 2012-2016
TABLE 180 France Ginger Market Value (US$ Mn), By Distribution Channel 2017-2022
TABLE 181 France Ginger Market Value (US$ Mn), By Application2012-2016
TABLE 182 France Ginger Market Value (US$ Mn), By Application2017-2022
TABLE 183 Spain Ginger Market Value (US$ Mn), By Form 2012-2016
TABLE 184 Spain Ginger Market Value (US$ Mn), By Form 2017-2022
TABLE 185 Spain Ginger Market Value (US$ Mn), By Distribution Channel 2012-2016
TABLE 186 Spain Ginger Market Value (US$ Mn), By Distribution Channel 2017-2022
TABLE 187 Spain Ginger Market Value (US$ Mn), By Application2012-2016
TABLE 188 Spain Ginger Market Value (US$ Mn), By Application2017-2022
TABLE 189 Italy Ginger Market Value (US$ Mn), By Form 2012-2016
TABLE 190 Italy Ginger Market Value (US$ Mn), By Form 2017-2022
TABLE 191 Italy Ginger Market Value (US$ Mn), By Distribution Channel 2012-2016
TABLE 192 Italy Ginger Market Value (US$ Mn), By Distribution Channel 2017-2022
TABLE 193 Italy Ginger Market Value (US$ Mn), By Application2012-2016
TABLE 194 Italy Ginger Market Value (US$ Mn), By Application2017-2022
TABLE 195 Nordic Ginger Market Value (US$ Mn), By Form 2012-2016
TABLE 196 Nordic Ginger Market Value (US$ Mn), By Form 2017-2022
TABLE 197 Nordic Ginger Market Value (US$ Mn), By Distribution Channel 2012-2016
TABLE 198 Nordic Ginger Market Value (US$ Mn), By Distribution Channel 2017-2022
TABLE 199 Nordic Ginger Market Value (US$ Mn), By Application2012-2016
TABLE 200 Nordic Ginger Market Value (US$ Mn), By Application2017-2022
TABLE 201 Japan Ginger Market Value (US$ Mn), By Form 2012-2016
TABLE 202 Japan Ginger Market Value (US$ Mn), By Form 2017-2022
TABLE 203 Japan Ginger Market Value (US$ Mn), By Distribution Channel 2012-2016
TABLE 204 Japan Ginger Market Value (US$ Mn), By Distribution Channel 2017-2022
TABLE 205 Japan Ginger Market Value (US$ Mn), By Application2012-2016
TABLE 206 Japan Ginger Market Value (US$ Mn), By Application2017-2022
TABLE 207 China Ginger Market Value (US$ Mn), By Form 2012-2016
TABLE 208 China Ginger Market Value (US$ Mn), By Form 2017-2022
TABLE 209 China Ginger Market Value (US$ Mn), By Distribution Channel 2012-2016
TABLE 210 China Ginger Market Value (US$ Mn), By Distribution Channel 2017-2022
TABLE 211 China Ginger Market Value (US$ Mn), By Application2012-2016
TABLE 212 China Ginger Market Value (US$ Mn), By Application2017-2022
TABLE 213 India Ginger Market Value (US$ Mn), By Form 2012-2016
TABLE 214 India Ginger Market Value (US$ Mn), By Form 2017-2022
TABLE 215 India Ginger Market Value (US$ Mn), By Distribution Channel 2012-2016
TABLE 216 India Ginger Market Value (US$ Mn), By Distribution Channel 2017-2022
TABLE 217 India Ginger Market Value (US$ Mn), By Application2012-2016
TABLE 218 India Ginger Market Value (US$ Mn), By Application2017-2022
TABLE 219 Malaysia Ginger Market Value (US$ Mn), By Form 2012-2016
TABLE 220 Malaysia Ginger Market Value (US$ Mn), By Form 2017-2022
TABLE 221 Malaysia Ginger Market Value (US$ Mn), By Distribution Channel 2012-2016
TABLE 222 Malaysia Ginger Market Value (US$ Mn), By Distribution Channel 2017-2022
TABLE 223 Malaysia Ginger Market Value (US$ Mn), By Application2012-2016
TABLE 224 Malaysia Ginger Market Value (US$ Mn), By Application2017-2022
TABLE 225 Thailand Ginger Market Value (US$ Mn), By Form 2012-2016
TABLE 226 Thailand Ginger Market Value (US$ Mn), By Form 2017-2022
TABLE 227 Thailand Ginger Market Value (US$ Mn), By Distribution Channel 2012-2016
TABLE 228 Thailand Ginger Market Value (US$ Mn), By Distribution Channel 2017-2022
TABLE 229 Thailand Ginger Market Value (US$ Mn), By Application2012-2016
TABLE 230 Thailand Ginger Market Value (US$ Mn), By Application2017-2022
TABLE 231 Singapore Ginger Market Value (US$ Mn), By Form 2012-2016
TABLE 232 Singapore Ginger Market Value (US$ Mn), By Form 2017-2022
TABLE 233 Singapore Ginger Market Value (US$ Mn), By Distribution Channel 2012-2016
TABLE 234 Singapore Ginger Market Value (US$ Mn), By Distribution Channel 2017-2022
TABLE 235 Singapore Ginger Market Value (US$ Mn), By Application2012-2016
TABLE 236 Singapore Ginger Market Value (US$ Mn), By Application2017-2022
TABLE 237 Australia Ginger Market Value (US$ Mn), By Form 2012-2016
TABLE 238 Australia Ginger Market Value (US$ Mn), By Form 2017-2022
TABLE 239 Australia Ginger Market Value (US$ Mn), By Distribution Channel 2012-2016
TABLE 240 Australia Ginger Market Value (US$ Mn), By Distribution Channel 2017-2022
TABLE 241 Australia Ginger Market Value (US$ Mn), By Application2012-2016
TABLE 242 Australia Ginger Market Value (US$ Mn), By Application2017-2022
TABLE 243 GCC Countries Ginger Market Value (US$ Mn), By Form 2012-2016
TABLE 244 GCC Countries Ginger Market Value (US$ Mn), By Form 2017-2022
TABLE 245 GCC Countries Ginger Market Value (US$ Mn), By Distribution Channel 2012-2016
TABLE 246 GCC Countries Ginger Market Value (US$ Mn), By Distribution Channel 2017-2022
TABLE 247 GCC Countries Ginger Market Value (US$ Mn), By Application2012-2016
TABLE 248 GCC Countries Ginger Market Value (US$ Mn), By Application2017-2022
TABLE 249 South Africa Ginger Market Value (US$ Mn), By Form 2012-2016
TABLE 250 South Africa Ginger Market Value (US$ Mn), By Form 2017-2022
TABLE 251 South Africa Ginger Market Value (US$ Mn), By Distribution Channel 2012-2016
TABLE 252 South Africa Ginger Market Value (US$ Mn), By Distribution Channel 2017-2022
TABLE 253 South Africa Ginger Market Value (US$ Mn), By Application2012-2016
TABLE 254 South Africa Ginger Market Value (US$ Mn), By Application2017-2022
TABLE 255 Nigeria Ginger Market Value (US$ Mn), By Form 2012-2016
TABLE 256 Nigeria Ginger Market Value (US$ Mn), By Form 2017-2022
TABLE 257 Nigeria Ginger Market Value (US$ Mn), By Distribution Channel 2012-2016
TABLE 258 Nigeria Ginger Market Value (US$ Mn), By Distribution Channel 2017-2022
TABLE 259 Nigeria Ginger Market Value (US$ Mn), By Application2012-2016
TABLE 260 Nigeria Ginger Market Value (US$ Mn), By Application2017-2022
TABLE 261 Israel Ginger Market Value (US$ Mn), By Form 2012-2016
TABLE 262 Israel Ginger Market Value (US$ Mn), By Form 2017-2022
TABLE 263 Israel Ginger Market Value (US$ Mn), By Distribution Channel 2012-2016
TABLE 264 Israel Ginger Market Value (US$ Mn), By Distribution Channel 2017-2022
TABLE 265 Israel Ginger Market Value (US$ Mn), By Application2012-2016
TABLE 266 Israel Ginger Market Value (US$ Mn), By Application2017-2022
List of Figures
FIG. 1 Global Ginger Market Value (US$ Mn), 2012-2016
FIG. 2 Global Ginger Market Value (US$ Mn) Forecast, 2017-2022
FIG. 3 Global Ginger Market Value (US$ Mn) and Y-o-Y, 2015-2022
FIG. 4 Global Fresh Segment Market Value (US$ Mn) By Region, 2012-2016
FIG. 5 Global Fresh Segment Market Value (US$ Mn) By Region, 2017-2022
FIG. 6 Global Fresh Segment Y-o-Y Growth Rate, By Region, 2015-2022
FIG. 7 Global Dried Segment Market Value (US$ Mn) By Region, 2012-2016
FIG. 8 Global Dried Segment Market Value (US$ Mn) By Region, 2017-2022
FIG. 9 Global Dried Segment Y-o-Y Growth Rate, By Region, 2015-2022
FIG. 10 Global Pickled Segment Market Value (US$ Mn) By Region, 2012-2016
FIG. 11 Global Pickled Segment Market Value (US$ Mn) By Region, 2017-2022
FIG. 12 Global Pickled Segment Y-o-Y Growth Rate, By Region, 2015-2022
FIG. 13 Global Preserved Segment Market Value (US$ Mn) By Region, 2012-2016
FIG. 14 Global Preserved Segment Market Value (US$ Mn) By Region, 2017-2022
FIG. 15 Global Preserved Segment Y-o-Y Growth Rate, By Region, 2015-2022
FIG. 16 Global Crystallized Segment Market Value (US$ Mn) By Region, 2012-2016
FIG. 17 Global Crystallized Segment Market Value (US$ Mn) By Region, 2017-2022
FIG. 18 Global Crystallized Segment Y-o-Y Growth Rate, By Region, 2015-2022
FIG. 19 Global Powdered Segment Market Value (US$ Mn) By Region, 2012-2016
FIG. 20 Global Powdered Segment Market Value (US$ Mn) By Region, 2017-2022
FIG. 21 Global Powdered Segment Y-o-Y Growth Rate, By Region, 2015-2022
FIG. 22 Global Other Forms Segment Market Value (US$ Mn) By Region, 2012-2016
FIG. 23 Global Other Forms Segment Market Value (US$ Mn) By Region, 2017-2022
FIG. 24 Global Other Forms Segment Y-o-Y Growth Rate, By Region, 2015-2022
FIG. 25 Global Modern Grocery Retail Segment Market Value (US$ Mn) By Region, 2012-2016
FIG. 26 Global Modern Grocery Retail Segment Market Value (US$ Mn) By Region, 2017-2022
FIG. 27 Global Modern Grocery Retail Segment Y-o-Y Growth Rate, By Region, 2015-2022
FIG. 28 Global Traditional Grocery Retail Segment Market Value (US$ Mn) By Region, 2012-2016
FIG. 29 Global Traditional Grocery Retail Segment Market Value (US$ Mn) By Region, 2017-2022
FIG. 30 Global Traditional Grocery Retail Segment Y-o-Y Growth Rate, By Region, 2015-2022
FIG. 31 Global Non-Grocery Retail Segment Market Value (US$ Mn) By Region, 2012-2016
FIG. 32 Global Non-Grocery Retail Segment Market Value (US$ Mn) By Region, 2017-2022
FIG. 33 Global Non-Grocery Retail Segment Y-o-Y Growth Rate, By Region, 2015-2022
FIG. 34 Global Other channels Segment Market Value (US$ Mn) By Region, 2012-2016
FIG. 35 Global Other channels Segment Market Value (US$ Mn) By Region, 2017-2022
FIG. 36 Global Other channels Segment Y-o-Y Growth Rate, By Region, 2015-2022
FIG. 37 Global Culinary Segment Market Value (US$ Mn) By Region, 2012-2016
FIG. 38 Global Culinary Segment Market Value (US$ Mn) By Region, 2017-2022
FIG. 39 Global Culinary Segment Y-o-Y Growth Rate, By Region, 2015-2022
FIG. 40 Global Soups and Sauces Segment Market Value (US$ Mn) By Region, 2012-2016
FIG. 41 Global Soups and Sauces Segment Market Value (US$ Mn) By Region, 2017-2022
FIG. 42 Global Soups and Sauces Segment Y-o-Y Growth Rate, By Region, 2015-2022
FIG. 43 Global Snacks & Convenience Food Segment Market Value (US$ Mn) By Region, 2012-2016
FIG. 44 Global Snacks & Convenience Food Segment Market Value (US$ Mn) By Region, 2017-2022
FIG. 45 Global Snacks & Convenience Food Segment Y-o-Y Growth Rate, By Region, 2015-2022
FIG. 46 Global Bakery Products Segment Market Value (US$ Mn) By Region, 2012-2016
FIG. 47 Global Bakery Products Segment Market Value (US$ Mn) By Region, 2017-2022
FIG. 48 Global Bakery Products Segment Y-o-Y Growth Rate, By Region, 2015-2022
FIG. 49 Global Alcoholic Beverages Segment Market Value (US$ Mn) By Region, 2012-2016
FIG. 50 Global Alcoholic Beverages Segment Market Value (US$ Mn) By Region, 2017-2022
FIG. 51 Global Alcoholic Beverages Segment Y-o-Y Growth Rate, By Region, 2015-2022
FIG. 52 Global Non-Alcoholic Beverages Segment Market Value (US$ Mn) By Region, 2012-2016
FIG. 53 Global Non-Alcoholic Beverages Segment Market Value (US$ Mn) By Region, 2017-2022
FIG. 54 Global Non-Alcoholic Beverages Segment Y-o-Y Growth Rate, By Region, 2015-2022
FIG. 55 Global Chocolate and Confectionery Segment Market Value (US$ Mn) By Region, 2012-2016
FIG. 56 Global Chocolate and Confectionery Segment Market Value (US$ Mn) By Region, 2017-2022
FIG. 57 Global Chocolate and Confectionery Segment Y-o-Y Growth Rate, By Region, 2015-2022
FIG. 58 Global Other Applications Segment Market Value (US$ Mn) By Region, 2012-2016
FIG. 59 Global Other Applications Segment Market Value (US$ Mn) By Region, 2017-2022
FIG. 60 Global Other Applications Segment Y-o-Y Growth Rate, By Region, 2015-2022
FIG. 61 North America Ginger Market Value (US$ Mn), By Form 2012-2016
FIG. 62 North America Ginger Market Value (US$ Mn), By Form 2017-2022
FIG. 63 North America Ginger Market Value (US$ Mn), By Distribution Channel 2012-2016
FIG. 64 North America Ginger Market Value (US$ Mn), By Distribution Channel 2017-2022
FIG. 65 North America Ginger Market Value (US$ Mn), By Application2012-2016
FIG. 66 North America Ginger Market Value (US$ Mn), By Application2017-2022
FIG. 67 Latin America Ginger Market Value (US$ Mn), By Form 2012-2016
FIG. 68 Latin America Ginger Market Value (US$ Mn), By Form 2017-2022
FIG. 69 Latin America Ginger Market Value (US$ Mn), By Distribution Channel 2012-2016
FIG. 70 Latin America Ginger Market Value (US$ Mn), By Distribution Channel 2017-2022
FIG. 71 Latin America Ginger Market Value (US$ Mn), By Application2012-2016
FIG. 72 Latin America Ginger Market Value (US$ Mn), By Application2017-2022
FIG. 73 Europe Ginger Market Value (US$ Mn), By Form 2012-2016
FIG. 74 Europe Ginger Market Value (US$ Mn), By Form 2017-2022
FIG. 75 Europe Ginger Market Value (US$ Mn), By Distribution Channel 2012-2016
FIG. 76 Europe Ginger Market Value (US$ Mn), By Distribution Channel 2017-2022
FIG. 77 Europe Ginger Market Value (US$ Mn), By Application2012-2016
FIG. 78 Europe Ginger Market Value (US$ Mn), By Application2017-2022
FIG. 79 Japan Ginger Market Value (US$ Mn), By Form 2012-2016
FIG. 80 Japan Ginger Market Value (US$ Mn), By Form 2017-2022
FIG. 81 Japan Ginger Market Value (US$ Mn), By Distribution Channel 2012-2016
FIG. 82 Japan Ginger Market Value (US$ Mn), By Distribution Channel 2017-2022
FIG. 83 Japan Ginger Market Value (US$ Mn), By Application2012-2016
FIG. 84 Japan Ginger Market Value (US$ Mn), By Application2017-2022
FIG. 85 APEJ Ginger Market Value (US$ Mn), By Form 2012-2016
FIG. 86 APEJ Ginger Market Value (US$ Mn), By Form 2017-2022
FIG. 87 APEJ Ginger Market Value (US$ Mn), By Distribution Channel 2012-2016
FIG. 88 APEJ Ginger Market Value (US$ Mn), By Distribution Channel 2017-2022
FIG. 89 APEJ Ginger Market Value (US$ Mn), By Application2012-2016
FIG. 90 APEJ Ginger Market Value (US$ Mn), By Application2017-2022
FIG. 91 MEA Ginger Market Value (US$ Mn), By Form 2012-2016
FIG. 92 MEA Ginger Market Value (US$ Mn), By Form 2017-2022
FIG. 93 MEA Ginger Market Value (US$ Mn), By Distribution Channel 2012-2016
FIG. 94 MEA Ginger Market Value (US$ Mn), By Distribution Channel 2017-2022
FIG. 95 MEA Ginger Market Value (US$ Mn), By Application2012-2016
FIG. 96 MEA Ginger Market Value (US$ Mn), By Application2017-2022
Copyright © Transparency Market Research, Inc. All Rights reserved
Trust Online

Ginger Market