
Reports
Reports
The year 2020 is being known as the year of GaN-based adapters and chargers. Work-from-home protocols have created revenue streams for companies in the GaN-based power supply adapter market. Manufacturers are seen to create new models of adapters and chargers for handheld gaming devices, tablets, and phones. It is expected that 2021 will witness the rise of multi-port adapters.
GaN semiconductors are gaining prominence in consumer electronics. Stakeholders in the GaN-based power supply adapter market are witnessing a renewed and reenergized need for GaN (gallium nitride) technology in electric vehicle (EV) design labs. Support from the European Union (EU) for policy standards pertaining to energy efficiency in data centers is translating into revenue opportunities for stakeholders.
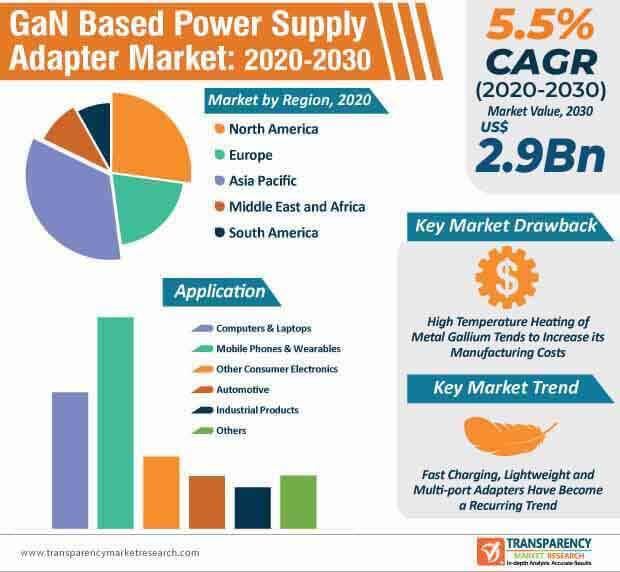
The GaN-based power supply adapter market is predicted to reach the value of US$ 3 Bn by 2030. However, technology concerns in GaN chargers are inhibiting market growth. For instance, the 65W GaN charger by Chinese tech giant Xiomi has been suspended from online and offline stores due to security vulnerability, since the chip is unencrypted and potentially open to attackers. Companies in the GaN-based power supply adapter market are taking cues from such companies to increase R&D for reliable and encrypted chargers.
The high cost of GaN chargers is another disadvantage for consumer, which is affecting the growth of the GaN-based power supply adapter market. Processes such as high temperature heating of metal gallium and other specific processing conditions tend to increase its manufacturing cost, resulting in an expensive final product. Hence, tech providers are increasing awareness about the small size, safety, and high efficiency of GaN chargers as compared to other chargers including silicon to offset the former’s disadvantages.
Companies in the GaN-based power supply adapter market are increasing the availability of lightweight adapters. The Philips 65W-USB charger is gaining popularity for replacing big, chunky, and heavy adapters, and flexibility in a mobile society. Manufacturers in the GaN-based power supply adapter market are increasing efforts to meet fast charging requirements of consumers. Such trends are expected to drive the market at the modest CAGR of 5.5% during the forecast period.
Stakeholders in the GaN-based power supply adapter market, such as Navitas Semiconductor has announced that Dell Technologies has adopted its GaN technology to enable fast laptop charging. Manufacturers are increasing their production capabilities in the 90W adapter series with dual ports that simultaneously charge a laptop and a smartphone. Such trends are publicizing GaN as a next-gen power semiconductor technology that facilitates dramatic improvements in energy savings and power density.
The increasing number of consumers are expecting innovation, performance, and quality from fast charging GaN-based power supply adapters. Hence, manufacturers are increasing the availability of low weight, compact, and cool operations in adapters.
Unique adapter designs and technologies are storming the GaN-based power supply adapter market. The ADG 100W GaN 9-in-1 power hub with fast charging capabilities and USB-C hub functions are creating revenue opportunities for manufacturers. Companies are investing in R&D to develop multi-port adapters that can charge several electronic devices simultaneously such as keyboards, laptops, flash drives, and other devices.
Companies in the GaN-based power supply adapter market are innovating in foldable US plugs compatible with AU, EU, and the U.K. universal travel adapters, which contribute toward a global mobile society. They are conducting rigorous technology, performance, and reliability reviews to ensure safe and successful adapter launches. C-end consumer electronics and the influx of 5G hold promising potentials for market growth.
Analysts’ Viewpoint
Stakeholders in EV design labs are expecting a long-term growth of the GaN technology, since the global economy is still emerging from the COVID-19 challenges during 2021. Fast charging, lightweight, and multi-port adapters have become a recurring trend in the GaN-based power supply adapter market. However, security vulnerabilities and high cost manufacturing of GaN adapters are affecting market growth. Hence, mobile phone brands and third-party accessory manufacturers should increase their research spending and collaborate with think tanks and researchers from universities to improve technologies in GaN adapters. CCC certification, CB certification, and KC certification in chargers and aftersales service from professional engineers are bolstering the credibility of companies.
GaN-based Power Supply Adapter Market Predicted to 5.5% CAGR during the Forecast Period.
GaN-based Power Supply Adapter Market Forecast Till 2030
The Players involved in the ADG, AsusTek Computer Inc., Anker Innovations Limited, Belkin International, Inc. and others.
Europe and North America Highly Lucrative Markets
The GaN-based Power Supply Adapter Market Would be US$ 3BN by the end of 2030
1. Global GaN Based Power Supply Adapter Market - Executive Summary
1.1. Global GaN Based Power Supply Adapter Market Country Analysis
1.2. Vertical Specific Market Penetration
1.3. Type – Product Mapping
1.4. Competition Blueprint
1.5. Technology Time Line Mapping
1.6. TMR Analysis and Recommendations
2. Market Overview
2.1. Market Introduction
2.2. Market Definition
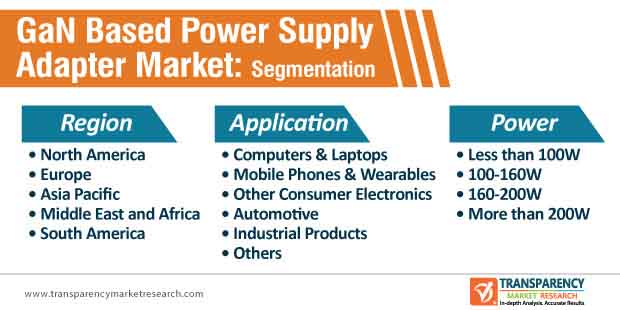
2.3. Market Taxonomy
3. Market Dynamics
3.1. Macroeconomic Factors
3.2. Drivers
3.2.1. Economic Drivers
3.2.2. Supply Side Drivers
3.2.3. Demand Side Drivers
3.3. Market Restraints
3.4. Market Trends
3.5. Trend Analysis- Impact on Time Line (2020-2028)
3.6. Key Regulations By Regions
4. Associated Industry and Key Indicator Assessment
4.1. Parent Industry Overview
4.2. Supply Chain Analysis
4.2.1. Profitability and Gross Margin Analysis By Competition
4.2.2. List of Active Participants- By Region
4.2.2.1. Raw Material Suppliers
4.2.2.2. Key Manufacturers
4.2.2.3. Integrators
4.2.2.4. Key Distributor/Retailers
4.3. Technology Roadmap Analysis
4.4. Porter’s Five Forces Analysis
5. Global GaN Based Power Supply Adapter Market Pricing Analysis
5.1. Price Point Assessment by Product Type
5.2. Regional Average Pricing Analysis
5.2.1. North America
5.2.2. Europe
5.2.3. Asia Pacific
5.2.4. Middle East & Africa
5.2.5. South America
5.3. Price Forecast till 2028
5.4. Factors Influencing Pricing
6. Global GaN Based Power Supply Adapter Market Analysis and Forecast
6.1. Market Size Analysis (2018-2019) and Forecast (2020-2028)
6.1.1. Market Value (US$ Mn) and Y-o-Y Growth
6.2. Global GaN Based Power Supply Adapter Market Analysis and Forecast, By Wired Charger, 2018-2028
6.3. CoolMOS Technology – Information, Supplier and Application
6.4. Comparison of CoolMOS vs GaN Solutions for Power Devices
6.5. Global GaN Based Power Supply Adapter Market Scenario Forecast (Optimistic, Likely and Conservative Market Conditions)
6.5.1. Forecast Factors and Relevance of Impact
6.5.2. Regional GaN Based Power Supply Adapter Market Business Performance Summary
7. Global AC-DC Power Supply Adapter Market Analysis
7.1. AC-DC Power Supply Adapter Market Size (US$ Mn) Analysis & Forecast, 2018 – 2028
7.1.1. Wired Chargers
7.1.1.1. North America
7.1.1.2. Europe
7.1.1.3. Asia Pacific
7.1.1.4. Middle East & Africa
7.1.1.5. South America
7.1.2. Wireless Chargers
7.1.2.1. North America
7.1.2.2. Europe
7.1.2.3. Asia Pacific
7.1.2.4. Middle East & Africa
7.1.2.5. South America
8. Global GaN Based Power Supply Adapter Market Analysis By Power
8.1. Introduction
8.1.1. Y-o-Y Growth Comparison By Power
8.2. GaN Based Power Supply Adapter Market Size (US$ Mn) Analysis & Forecast, By Power, 2018 – 2028
8.2.1. Less than 100W
8.2.2. 100-160W
8.2.3. 160-200W
8.2.4. More than 200W
8.3. Market Attractiveness Analysis By Power
9. Global GaN Based Power Supply Adapter Market Analysis By Application
9.1. Introduction
9.1.1. Y-o-Y Growth Comparison By Application
9.2. GaN Based Power Supply Adapter Market Size (US$ Mn) Analysis & Forecast, By Application, 2018 – 2028
9.2.1. Computers & Laptops
9.2.2. Mobile Phones & Wearables
9.2.3. Consumer Electronics
9.2.4. Automotive
9.2.5. Industrial Products
9.2.6. Others
9.3. Market Attractiveness Analysis By Application
10. Global GaN Based Power Supply Adapter Market Analysis and Forecast, By Region
10.1. Introduction
10.1.1. Basis Point Share (BPS) Analysis By Region
10.2. GaN Based Power Supply Adapter Market Size (US$ Mn) and Volume (Million Units) Analysis & Forecast, By Region, 2018 – 2028
10.2.1. North America
10.2.2. Europe
10.2.3. Asia Pacific
10.2.4. Middle East & Africa
10.2.5. South America
10.3. Market Attractiveness Analysis By Region
11. North America GaN Based Power Supply Adapter Market Analysis and Forecast
11.1. Introduction
11.2. Drivers and Restraints: Impact Analysis
11.3. GaN Based Power Supply Adapter Market Size (US$ Mn) Analysis & Forecast, By Power, 2018 – 2028
11.3.1. Less than 100W
11.3.2. 100-160W
11.3.3. 160-200W
11.3.4. More than 200W
11.4. GaN Based Power Supply Adapter Market Size (US$ Mn) Analysis & Forecast, By Application, 2018 – 2028
11.4.1. Computers & Laptops
11.4.2. Mobile Phones & Wearables
11.4.3. Consumer Electronics
11.4.4. Automotive
11.4.5. Industrial Products
11.4.6. Others
11.5. GaN Based Power Supply Adapter Market Size (US$ Mn) and Volume (Million Units) Analysis & Forecast, By Country, 2018 – 2028
11.5.1. U.S.
11.5.2. Canada
11.5.3. Mexico
11.6. Market Attractiveness Analysis
11.6.1. Power
11.6.2. Application
11.6.3. Country
12. Europe GaN Based Power Supply Adapter Market Analysis and Forecast
12.1. Introduction
12.2. Drivers and Restraints: Impact Analysis
12.3. ACGaN Based Power Supply Adapter Market Size (US$ Mn) Analysis & Forecast, By Power, 2018 – 2028
12.3.1. Less than 100W
12.3.2. 100-160W
12.3.3. 160-200W
12.3.4. More than 200W
12.4. GaN Based Power Supply Adapter Market Size (US$ Mn) Analysis & Forecast, By Application, 2018 – 2028
12.4.1. Computers & Laptops
12.4.2. Mobile Phones & Wearables
12.4.3. Consumer Electronics
12.4.4. Automotive
12.4.5. Industrial Products
12.4.6. Others
12.5. GaN Based Power Supply Adapter Market Size (US$ Mn) and Volume (Million Units) Analysis & Forecast, By Country & Sub-region, 2018 - 2028
12.5.1. U.K.
12.5.2. Germany
12.5.3. France
12.5.4. Italy
12.5.5. Russia
12.5.6. Rest of Europe
12.6. Market Attractiveness Analysis
12.6.1. Power
12.6.2. Application
12.6.3. Country
13. Asia Pacific GaN Based Power Supply Adapter Market Analysis and Forecast
13.1. Introduction
13.2. Drivers and Restraints: Impact Analysis
13.3. GaN Based Power Supply Adapter Market Size (US$ Mn) Analysis & Forecast, By Power, 2018 - 2028
13.3.1. Less than 100W
13.3.2. 100-160W
13.3.3. 160-200W
13.3.4. More than 200W
13.4. GaN Based Power Supply Adapter Market Size (US$ Mn) Analysis & Forecast, By Application, 2018 - 2028
13.4.1. Computers & Laptops
13.4.2. Mobile Phones & Wearables
13.4.3. Consumer Electronics
13.4.4. Automotive
13.4.5. Industrial Products
13.4.6. Others
13.5. GaN Based Power Supply Adapter Market Size (US$ Mn) and Volume (Million Units) Analysis & Forecast, By Country & Sub-region, 2018 - 2028
13.5.1. China
13.5.2. India
13.5.3. Japan
13.5.4. South Korea
13.5.5. ASEAN
13.5.6. Rest of Asia Pacific
13.6. Market Attractiveness Analysis
13.6.1. Power
13.6.2. Application
13.6.3. Country
14. Middle East & Africa (MEA) GaN Based Power Supply Adapter Market Analysis and Forecast
14.1. Introduction
14.2. Drivers and Restraints: Impact Analysis
14.3. GaN Based Power Supply Adapter Market Size (US$ Mn) Analysis & Forecast, By Power, 2018 - 2028
14.3.1. Less than 100W
14.3.2. 100-160W
14.3.3. 160-200W
14.3.4. More than 200W
14.4. GaN Based Power Supply Adapter Market Size (US$ Mn) Analysis & Forecast, By Application, 2018 - 2028
14.4.1. Computers & Laptops
14.4.2. Mobile Phones & Wearables
14.4.3. Consumer Electronics
14.4.4. Automotive
14.4.5. Industrial Products
14.4.6. Others
14.5. GaN Based Power Supply Adapter Market Size (US$ Mn) and Volume (Million Units) Analysis & Forecast, By Country & Sub-region, 2018 – 2028
14.5.1. GCC
14.5.2. South Africa
14.5.3. North Africa
14.5.4. Rest of Middle East & Africa
14.6. Market Attractiveness Analysis
14.6.1. Power
14.6.2. Application
14.6.3. Country
15. South America GaN Based Power Supply Adapter Market Analysis and Forecast
15.1. Introduction
15.2. Drivers and Restraints: Impact Analysis
15.3. GaN Based Power Supply Adapter Market Size (US$ Mn) Analysis & Forecast, By Power, 2018 – 2028
15.3.1. Less than 100W
15.3.2. 100-160W
15.3.3. 160-200W
15.3.4. More than 200W
15.4. GaN Based Power Supply Adapter Market Size (US$ Mn) Analysis & Forecast, By Application, 2018 – 2028
15.4.1. Computers & Laptops
15.4.2. Mobile Phones & Wearables
15.4.3. Consumer Electronics
15.4.4. Automotive
15.4.5. Industrial Products
15.4.6. Others
15.5. GaN Based Power Supply Adapter Market Size (US$ Mn) and Volume (Million Units) Analysis & Forecast, By Country & Sub-region, 2018 - 2028
15.5.1. Brazil
15.5.2. Argentina
15.5.3. Rest of South America
15.6. Market Attractiveness Analysis
15.6.1. Power
15.6.2. Application
15.6.3. Country
16. Competition Assessment
16.1. Global GaN Based Power Supply Adapter Market Competition - a Dashboard View
16.2. Global GaN Based Power Supply Adapter Market Structure Analysis
16.3. Global GaN Based Power Supply Adapter Market Company Share Analysis, by Value (2019)
16.4. Key Participants Market Presence (Intensity Mapping) by Region
17. Competition Deep-dive (Manufacturers/Suppliers)
17.1. Advantech Co., Ltd.
17.1.1. Overview
17.1.2. Product Portfolio
17.1.3. Sales Footprint
17.1.4. Channel Footprint
17.1.4.1. Distributors List
17.1.5. Strategy Overview
17.1.5.1. Marketing Strategy
17.1.5.2. Culture Strategy
17.1.5.3. Channel Strategy
17.1.6. SWOT Analysis
17.1.7. Financial Analysis
17.1.8. Revenue Share
17.1.8.1. By Region
17.1.9. Key Clients
17.1.10. Analyst Comments
17.2. ADG
17.2.1. Overview
17.2.2. Product Portfolio
17.2.3. Sales Footprint
17.2.4. Channel Footprint
17.2.4.1. Distributors List
17.2.5. Strategy Overview
17.2.5.1. Marketing Strategy
17.2.5.2. Culture Strategy
17.2.5.3. Channel Strategy
17.2.6. SWOT Analysis
17.2.7. Financial Analysis
17.2.8. Revenue Share
17.2.8.1. By Region
17.2.9. Key Clients
17.2.10. Analyst Comments
17.3. AsusTek Computer Inc.
17.3.1. Overview
17.3.2. Product Portfolio
17.3.3. Sales Footprint
17.3.4. Channel Footprint
17.3.4.1. Distributors List
17.3.5. Strategy Overview
17.3.5.1. Marketing Strategy
17.3.5.2. Culture Strategy
17.3.5.3. Channel Strategy
17.3.6. SWOT Analysis
17.3.7. Financial Analysis
17.3.8. Revenue Share
17.3.8.1. By Region
17.3.9. Key Clients
17.3.10. Analyst Comments
17.4. Anker Innovations Limited
17.4.1. Overview
17.4.2. Product Portfolio
17.4.3. Sales Footprint
17.4.4. Channel Footprint
17.4.4.1. Distributors List
17.4.5. Strategy Overview
17.4.5.1. Marketing Strategy
17.4.5.2. Culture Strategy
17.4.5.3. Channel Strategy
17.4.6. SWOT Analysis
17.4.7. Financial Analysis
17.4.8. Revenue Share
17.4.8.1. By Region
17.4.9. Key Clients
17.4.10. Analyst Comments
17.5. Belkin International, Inc.
17.5.1. Overview
17.5.2. Product Portfolio
17.5.3. Sales Footprint
17.5.4. Channel Footprint
17.5.4.1. Distributors List
17.5.5. Strategy Overview
17.5.5.1. Marketing Strategy
17.5.5.2. Culture Strategy
17.5.5.3. Channel Strategy
17.5.6. SWOT Analysis
17.5.7. Financial Analysis
17.5.8. Revenue Share
17.5.8.1. By Region
17.5.9. Key Clients
17.5.10. Analyst Comments
17.6. CUI Inc
17.6.1. Overview
17.6.2. Product Portfolio
17.6.3. Sales Footprint
17.6.4. Channel Footprint
17.6.4..1. Distributors List
17.6.5. Strategy Overview
17.6.5.1. Marketing Strategy
17.6.5.2. Culture Strategy
17.6.5.3. Channel Strategy
17.6.6. SWOT Analysis
17.6.7. Financial Analysis
17.6.8. Revenue Share
17.6.8.1. By Region
17.6.9. Key Clients
17.6.10. Analyst Comments
17.7. Finepower GmbH
17.7.1. Overview
17.7.2. Product Portfolio
17.7.3. Sales Footprint
17.7.4. Channel Footprint
17.7.4.1. Distributors List
17.7.5. Strategy Overview
17.7.5.1. Marketing Strategy
17.7.5.2. Culture Strategy
17.7.5.3. Channel Strategy
17.7.6. SWOT Analysis
17.7.7. Financial Analysis
17.7.8. Revenue Share
17.7.8.1. By Region
17.7.9. Key Clients
17.7.10. Analyst Comments
17.8. GaN Systems
17.8.1. Overview
17.8.2. Product Portfolio
17.8.3. Sales Footprint
17.8.4. Channel Footprint
17.8.4.1. Distributors List
17.8.5. Strategy Overview
17.8.5.1. Marketing Strategy
17.8.5.2. Culture Strategy
17.8.5.3. Channel Strategy
17.8.6. SWOT Analysis
17.8.7. Financial Analysis
17.8.8. Revenue Share
17.8.8.1. By Region
17.8.9. Key Clients
17.8.10. Analyst Comments
17.9. Baseus
17.9.1. Overview
17.9.2. Product Portfolio
17.9.3. Sales Footprint
17.9.4. Channel Footprint
17.9.4.1. Distributors List
17.9.5. Strategy Overview
17.9.5.1. Marketing Strategy
17.9.5.2. Culture Strategy
17.9.5.3. Channel Strategy
17.9.6. SWOT Analysis
17.9.7. Financial Analysis
17.9.8. Revenue Share
17.9.8.1. By Region
17.9.9. Key Clients
17.9.10. Analyst Comments
17.10. CHARGEASAP
17.10.1. Overview
17.10.2. Product Portfolio
17.10.3. Sales Footprint
17.10.4. Channel Footprint
17.10.4.1. Distributors List
17.10.5. Strategy Overview
17.10.5.1. Marketing Strategy
17.10.5.2. Culture Strategy
17.10.5.3. Channel Strategy
17.10.6. SWOT Analysis
17.10.7. Financial Analysis
17.10.8. Revenue Share
17.10.8.1. By Region
17.10.9. Key Clients
17.10.10. Analyst Comments
17.11. G-Power Technology Co., Ltd
17.11.1. Overview
17.11.2. Product Portfolio
17.11.3. Sales Footprint
17.11.4. Channel Footprint
17.11.4.1. Distributors List
17.11.5. Strategy Overview
17.11.5.1. Marketing Strategy
17.11.5.2. Culture Strategy
17.11.5.3. Channel Strategy
17.11.6. SWOT Analysis
17.11.7. Financial Analysis
17.11.8. Revenue Share
17.11.8.1. By Region
17.11.9. Key Clients
17.11.10. Analyst Comments
17.12. Verizon
17.12.1. Overview
17.12.2. Product Portfolio
17.12.3. Sales Footprint
17.12.4. Channel Footprint
17.12.4.1. Distributors List
17.12.5. Strategy Overview
17.12.5.1. Marketing Strategy
17.12.5.2. Culture Strategy
17.12.5.3. Channel Strategy
17.12.6. SWOT Analysis
17.12.7. Financial Analysis
17.12.8. Revenue Share
17.12.8.1. By Region
17.12.9. Key Clients
17.12.10. Analyst Comments
17.13. RAVPower.
17.13.1. Overview
17.13.2. Product Portfolio
17.13.3. Sales Footprint
17.13.4. Channel Footprint
17.13.4.1. Distributors List
17.13.5. Strategy Overview
17.13.5.1. Marketing Strategy
17.13.5.2. Culture Strategy
17.13.5.3. Channel Strategy
17.13.6. SWOT Analysis
17.13.7. Financial Analysis
17.13.8. Revenue Share
17.13.8.1. By Region
17.13.9. Key Clients
17.13.10. Analyst Comments
17.14. Xiomi
17.14.1. Overview
17.14.2. Product Portfolio
17.14.3. Sales Footprint
17.14.4. Channel Footprint
17.14.4.1. Distributors List
17.14.5. Strategy Overview
17.14.5.1. Marketing Strategy
17.14.5.2. Culture Strategy
17.14.5.3. Channel Strategy
17.14.6. SWOT Analysis
17.14.7. Financial Analysis
17.14.8. Revenue Share
17.14.8.1. By Region
17.14.9. Key Clients
17.14.10. Analyst Comments
17.15. Others (On additional request)
18. Recommendation- Critical Success Factors (ODM &OEM)
19. Research Methodology
20. Assumptions & Acronyms Used
List of Tables
Table 1: GaN Based Power Supply Adapter Market Size (US$ Mn) Analysis & Forecast, Wired Chargers, 2018 - 2030
Table 2: GaN Based Power Supply Adapter Market Size (US$ Mn) Analysis & Forecast, Wireless Chargers, 2018 - 2030
Table 3: Global GaN Based Power Supply Adapter Market Revenue (US$ Mn), By Power, 2018–2030
Table 4: Global GaN Based Power Supply Adapter Market Revenue (US$ Mn), By Application, 2018–2030
Table 5: Global GaN Based Power Supply Adapter Market Revenue (US$ Mn), by Region, 2018–2030
Table 6: Global GaN Based Power Supply Adapter Market Volume (Thousand Units), by Region, 2018–2030
Table 7: North America GaN Based Power Supply Adapter Market Revenue (US$ Mn), By Power, 2018–2030
Table 8: North America GaN Based Power Supply Adapter Market Revenue (US$ Mn), By Application, 2018–2030
Table 9: North America GaN Based Power Supply Adapter Market Revenue (US$ Mn), by Country, 2018–2030
Table 10: North America GaN Based Power Supply Adapter Market Volume (Thousand Units), by Country, 2018–2030
Table 11: Europe GaN Based Power Supply Adapter Market Revenue (US$ Mn), By Power, 2018–2030
Table 12: Europe GaN Based Power Supply Adapter Market Revenue (US$ Mn), By Application, 2018–2030
Table 13: Europe GaN Based Power Supply Adapter Market Revenue (US$ Mn), by Country, 2018–2030
Table 14: Europe GaN Based Power Supply Adapter Market Volume (Thousand Units), by Country, 2018–2030
Table 15: Asia Pacific GaN Based Power Supply Adapter Market Revenue (US$ Mn), By Application, 2018–2030
Table 16: Asia Pacific GaN Based Power Supply Adapter Market Revenue (US$ Mn), By Power, 2018–2030
Table 17: Asia Pacific GaN Based Power Supply Adapter Market Revenue (US$ Mn), by Country, 2018–2030
Table 18: Asia Pacific GaN Based Power Supply Adapter Market Volume (Thousand Units), by Country, 2018–2030
Table 19: Middle East & Africa GaN Based Power Supply Adapter Market Revenue (US$ Mn), By Power, 2018–2030
Table 20: Middle East & Africa GaN Based Power Supply Adapter Market Revenue (US$ Mn), By Application, 2018–2030
Table 21: Middle East & Africa GaN Based Power Supply Adapter Market Revenue (US$ Mn), by Country, 2018–2030
Table 22: Middle East & Africa GaN Based Power Supply Adapter Market Volume (Thousand Units), by Country, 2018–2030
Table 23: South America GaN Based Power Supply Adapter Market Revenue (US$ Mn), By Power, 2018–2030
Table 24: South America GaN Based Power Supply Adapter Market Revenue (US$ Mn), By Application, 2018–2030
Table 25: South America GaN Based Power Supply Adapter Market Revenue (US$ Mn), by Country, 2018–2030
Table 26: South America GaN Based Power Supply Adapter Market Volume (Thousand Units), by Country, 2018–2030
List of Figures
Figure 1: GaN Based Power Supply Adapter Market Size (US$ Mn) Analysis & Forecast, Wired Chargers, 2018 - 2030
Figure 2: GaN Based Power Supply Adapter Market Size (US$ Mn) Analysis & Forecast, Wireless Chargers, 2018 - 2030
Figure 3: Global GaN Based Power Supply Adapter Market Revenue, by Value, 2018 - 2030
Figure 4: Global GaN Based Power Supply Adapter Market Volume, by Volume, 2018 - 2030
Figure 5: Global GaN Based Power Supply Adapter Market Analysis and Forecast, By Wired Charger, 2018-2030
Figure 6: GaN Based Power Supply Adapter Market Size (US$ Mn) Analysis & Forecast, Wired Chargers, 2018 - 2030
Figure 7: GaN Based Power Supply Adapter Market Size (US$ Mn) Analysis & Forecast, Wireless Chargers, 2018 - 2030
Figure 8: Global GaN Based Power Supply Adapter Market, by Less than 100W
Figure 9: Global GaN Based Power Supply Adapter Market, by 100-160W
Figure 10: Global GaN Based Power Supply Adapter Market, by 160-200W
Figure 11: Global GaN Based Power Supply Adapter Market, by More than 200W
Figure 12: Global GaN Based Power Supply Adapter Market Comparison Matrix, By Power
Figure 13: Global GaN Based Power Supply Adapter Market Attractiveness Analysis, By Power
Figure 14: Global GaN Based Power Supply Adapter Market, by Computers & Laptops
Figure 15: Global GaN Based Power Supply Adapter Market, by Mobile Phones & Wearables
Figure 16: Global GaN Based Power Supply Adapter Market, by Consumer Electronics
Figure 17: Global GaN Based Power Supply Adapter Market, by Automotive
Figure 18: Global GaN Based Power Supply Adapter Market, by Industrial Products
Figure 19: Global GaN Based Power Supply Adapter Market, by Others
Figure 20: Global GaN Based Power Supply Adapter Market Comparison Matrix, By Application
Figure 21: Global GaN Based Power Supply Adapter Market Attractiveness Analysis, By Application
Figure 22: Global GaN Based Power Supply Adapter Market Value Share Analysis, by Region (2020E)
Figure 23: Global GaN Based Power Supply Adapter Market Value Share Analysis, by Region (2030F)
Figure 24: Global GaN Based Power Supply Adapter Market Volume Share Analysis, by Region (2020E)
Figure 25: Global GaN Based Power Supply Adapter Market Volume Share Analysis, by Region (2030F)
Figure 26: Global GaN Based Power Supply Adapter Market Attractiveness Analysis, by Region
Figure 27: North America GaN Based Power Supply Adapter Market Revenue (US$ Mn) Forecast, 2018–2030
Figure 28: North America GaN Based Power Supply Adapter Market Volume (Thousand Units) Forecast, 2018–2030
Figure 29: North America GaN Based Power Supply Adapter Market Value Share Analysis, By Power (2020)
Figure 30: North America GaN Based Power Supply Adapter Market Value Share Analysis, By Power (2030)
Figure 31: North America GaN Based Power Supply Adapter Market Value Share Analysis, By Application (2020)
Figure 32: North America GaN Based Power Supply Adapter Market Value Share Analysis, By Application (2030)
Figure 33: North America GaN Based Power Supply Adapter Market Value Share Analysis, by Country (2020)
Figure 34: North America GaN Based Power Supply Adapter Market Attractiveness Analysis, By Power
Figure 35: North America GaN Based Power Supply Adapter Market Attractiveness Analysis, By Application
Figure 36: North America GaN Based Power Supply Adapter Market Attractiveness Analysis, by Country
Figure 37: Europe GaN Based Power Supply Adapter Market Revenue (US$ Mn) Forecast, 2018–2030
Figure 38: Europe GaN Based Power Supply Adapter Market Y-o-Y Growth Projection, 2018–2030
Figure 39: Europe GaN Based Power Supply Adapter Market Volume (Thousand Units) Forecast, 2018–2030
Figure 40: Europe GaN Based Power Supply Adapter Market Y-o-Y Growth Projection, 2018–2030
Figure 41: Europe GaN Based Power Supply Adapter Market Value Share Analysis, By Power (2020)
Figure 42: Europe GaN Based Power Supply Adapter Market Value Share Analysis, By Power (2030)
Figure 43: Europe GaN Based Power Supply Adapter Market Value Share Analysis, By Application (2020)
Figure 44: Europe GaN Based Power Supply Adapter Market Value Share Analysis, By Application (2030)
Figure 45: Europe GaN Based Power Supply Adapter Market Value Share Analysis, by Country (2020)
Figure 46: Europe GaN Based Power Supply Adapter Market Value Share Analysis, by Country (2030)
Figure 47: Europe GaN Based Power Supply Adapter Market Attractiveness Analysis, By Power
Figure 48: Europe GaN Based Power Supply Adapter Market Attractiveness Analysis, By Application
Figure 49: Europe GaN Based Power Supply Adapter Market Attractiveness Analysis, by Country
Figure 50: Asia Pacific GaN Based Power Supply Adapter Market Revenue (US$ Mn) Forecast, 2018–2030
Figure 51: Asia Pacific GaN Based Power Supply Adapter Market Y-o-Y Growth Projection, 2018–2030
Figure 52: Asia Pacific GaN Based Power Supply Adapter Market Volume (Thousand Units) Forecast, 2018–2030
Figure 53: North America GaN Based Power Supply Adapter Market Y-o-Y Growth Projection, 2018–2030
Figure 54: Asia Pacific GaN Based Power Supply Adapter Market Value Share Analysis, By Power (2020)
Figure 55: Asia Pacific GaN Based Power Supply Adapter Market Value Share Analysis, By Power (2030)
Figure 56: Asia Pacific GaN Based Power Supply Adapter Market Value Share Analysis, By Application (2020)
Figure 57: Asia Pacific GaN Based Power Supply Adapter Market Value Share Analysis, By Application (2030)
Figure 58: Asia Pacific GaN Based Power Supply Adapter Market Value Share Analysis, by Country (2020)
Figure 59: Asia Pacific GaN Based Power Supply Adapter Market Value Share Analysis, by Country (2030)
Figure 60: Asia Pacific GaN Based Power Supply Adapter Market Attractiveness Analysis, By Power
Figure 61: Asia Pacific GaN Based Power Supply Adapter Market Attractiveness Analysis, By Application
Figure 62: Asia Pacific GaN Based Power Supply Adapter Market Attractiveness Analysis, by Country
Figure 63: Middle East & Africa GaN Based Power Supply Adapter Market Revenue (US$ Mn) Forecast, 2018–2030
Figure 64: Middle East & Africa GaN Based Power Supply Adapter Market Y-o-Y Growth Projection, 2018–2030
Figure 65: Middle East & Africa GaN Based Power Supply Adapter Market Volume (Thousand Units) Forecast, 2018–2030
Figure 66: Middle East & Africa GaN Based Power Supply Adapter Market Y-o-Y Growth Projection, 2018–2030
Figure 67: Middle East & Africa GaN Based Power Supply Adapter Market Value Share Analysis, By Power (2020)
Figure 68: Middle East & Africa GaN Based Power Supply Adapter Market Value Share Analysis, By Power (2030)
Figure 69: Middle East & Africa GaN Based Power Supply Adapter Market Value Share Analysis, By Application (2020)
Figure 70: Middle East & Africa GaN Based Power Supply Adapter Market Value Share Analysis, By Application (2030)
Figure 71: Middle East & Africa GaN Based Power Supply Adapter Market Value Share Analysis, by Country (2020)
Figure 72: Middle East & Africa GaN Based Power Supply Adapter Market Value Share Analysis, by Country (2030)
Figure 73: Middle East & Africa GaN Based Power Supply Adapter Market Attractiveness Analysis, By Power
Figure 74: Middle East & Africa GaN Based Power Supply Adapter Market Attractiveness Analysis, By Application
Figure 75: Middle East & Africa GaN Based Power Supply Adapter Market Attractiveness Analysis, by Country
Figure 76: South America GaN Based Power Supply Adapter Market Revenue (US$ Mn) Forecast, 2018–2030
Figure 77: South America GaN Based Power Supply Adapter Market Y-o-Y Growth Projection, 2018–2030
Figure 78: South America GaN Based Power Supply Adapter Market Volume (Thousand Units) Forecast, 2018–2030
Figure 79: South America GaN Based Power Supply Adapter Market Y-o-Y Growth Projection, 2018–2030
Figure 80: South America GaN Based Power Supply Adapter Market Value Share Analysis, By Power (2020)
Figure 81: South America GaN Based Power Supply Adapter Market Value Share Analysis, By Power (2030)
Figure 82: South America GaN Based Power Supply Adapter Market Value Share Analysis, By Application (2020)
Figure 83: South America GaN Based Power Supply Adapter Market Value Share Analysis, By Application (2030)
Figure 84: South America GaN Based Power Supply Adapter Market Value Share Analysis, by Country (2020)
Figure 85: South America GaN Based Power Supply Adapter Market Value Share Analysis, by Country (2030)
Figure 86: South America GaN Based Power Supply Adapter Market Attractiveness Analysis, By Power
Figure 87: South America GaN Based Power Supply Adapter Market Attractiveness Analysis, By Application
Figure 88: South America GaN Based Power Supply Adapter Market Attractiveness Analysis, by Country
Copyright © Transparency Market Research, Inc. All Rights reserved
Trust Online

GaN-based Power Supply Adapter Market