
Reports
Reports
Analysts’ Viewpoint on GaN Substrate Market Scenario
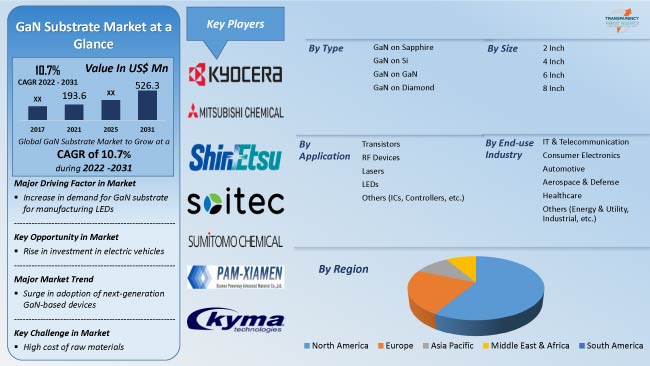
Rise in demand for power switching devices and LEDs is driving the global GaN substrate market. Gallium nitride substrate operates at higher temperatures and can withstand higher voltages compared to silicon. These benefits prompt the usage of GaN substrate in consumer electronic devices and electric vehicles. Thus, expansion in the electronics sector and increase in adoption of electric vehicles are expected to augment the global market during the forecast period. Manufacturers are expanding their production capabilities to increase their GaN substrate market share. They are also focusing on high-growth applications such as transistors, RF devices, ICs, and light-emitting diodes (LEDs) to broaden their revenue streams.
Gallium nitride (GaN) is a semiconductor that is used in high-power, high-frequency applications. The semiconductor has several properties that make it superior to gallium arsenide (GaAs) and silicon (Si) for a variety of high-power components. Higher breakdown voltage and higher electrical resistivity are two of these characteristics. GaN facilitates the manufacture of energy-efficient white LEDs and energy-efficient power electronic devices. It improves device performance by eliminating structural defects and providing better vertical electrical and thermal conductivity. GaN substrate on GaN finds application in high-electron-mobility transistors. Laser slicing techniques are employed to manufacture these transistors. GaN on diamond semiconductor substrate is used to fabricate high-electron-mobility transistors with high thermal efficiencies.
GaN is a widely used substrate for manufacturing LEDs (blue, violet, ultraviolet, and white color) and blue-violet laser diodes for blue rays. GaN substrates meet the high brightness LED requirements, which emphasize output and durability. The solid-state lighting technology based on GaN substrate has transformed the semiconductor industry. Adoption of GaN technology can significantly reduce the global demand for energy, thereby mitigating carbon emission. According to the U.S. Department of Energy, bright white LED lighting sources could reduce energy consumption by 29.0% by 2025.
Gallium nitride-based LEDs are primarily used for Solid-state Lighting (SSL) applications around the world due to their high efficiency, low power consumption, and longer lifetime than fluorescent and incandescent bulbs. GaN applications are shifting to more modern industries such as automotive and smart lighting as a result of the advantageous properties of GaN such as higher reliability and efficiency.
GaN is a very hard, mechanically stable wide bandgap semiconductor. Power devices based on GaN outperform silicon-based devices in terms of breakdown strength, switching speed, thermal conductivity, and on-resistance. GaN semiconductor devices are gaining traction in various industry verticals. This can be ascribed to their capability to achieve high Breakdown Voltage (BV) and current levels without increasing the chip size. Additionally, GaN-based devices are ideal for various power applications such as switching functions and inverters, as they help save a significant amount of energy.
Demand for GaN transistors is rising significantly in the power electronics industry. GaN transistor is a prominent substitute for silicon-based FETs due to characteristics such as high electron mobility. GaN transistors are also used in various other applications including power chargers, automobiles, and audio amplifiers. GaN devices ensure higher operational frequency and power density (10 times greater) than silicon. Hence, GaN devices are gaining traction in applications such as LED and laser diodes.
In terms of type, the global GaN substrate market has been segregated into GaN on sapphire, GaN on Si, GaN on GaN, and GaN on diamond. The GaN on sapphire segment held the largest share of nearly 60.0% of the market in 2021. GaN is the most commonly used material for blue-light/green-light LEDs due to its ability to combine electrical and optical components, and increase the efficiency of LED products. GaN substrate on sapphire offers insulating properties. Thus, GaN LEDs grown on sapphire substrates have current transport along the lateral direction.
According to the latest GaN substrate market forecast study, GaN on Si is one of the fastest-emerging segments in the market. GaN substrate on Si is widely used in devices similar to high-electron-mobility transistors and field-effect transistors. GaN substrate on SiC has three times the thermal conductivity of GaN on Si. Silicon carbide has a closely matching lattice to GaN, a simpler nucleation layer structure, and excellent thermal properties. This makes it an ideal substrate candidate for power devices.
Based on end-use industry, the global GaN substrate market has been classified into IT & telecommunication, consumer electronics, automotive, aerospace & defense, healthcare, and others (energy & utility, industrial, etc.). The consumer electronics segment accounted for the largest share of 36.0% of the global market in 2021. Increase in usage of GaN components in electronic devices such as smartphones, wearables, laptops, and lighting solutions for fast charging and power supply applications is driving the segment. Expansion in the consumer electronics sector is also propelling the segment. According to the India Brand Equity Foundation (IBEF), India is one of the most lucrative smartphone markets. The market has grown 10-fold, from 14.5 million shipments in 2011 to 150 million in 2020.
Asia Pacific held major share of 38.0% of the global GaN substrate market in 2021. Growth of the market in the region can be ascribed to the presence of leading electronics manufacturers in Japan, South Korea, and China. Additionally, surge in adoption of smartphones, computers, tablets, and desktop PCs is anticipated to contribute to the GaN substrate market growth in the region.
North America accounted for 27.0% share of the global GaN substrate market in 2021. Rise in demand for GaN substrates in automotive, aerospace, and defense industries; and increase in adoption of electric and hybrid vehicles are driving the market in the region.
The global GaN substrate market is consolidated, with a limited number of large-scale vendors controlling the maximum share. Expansion of product portfolios, partnerships, and mergers & acquisitions are key strategies adopted by leading manufacturers. Kyma Technologies, Inc., Kyocera Corporation, Mitsubishi Chemical Corporation, MTI Corporation, NGK Insulators, Ltd., Shin-Etsu Chemical Co., Ltd., SOITEC, Sumitomo Chemical Co., Ltd., Toyoda Gosei Co., Ltd., and Xiamen Powerway Advanced Material Co., Ltd. are prominent players operating in the global GaN substrate market.
Each of these players has been profiled in the GaN substrate market report based on parameters such as company overview, financial overview, business strategies, product portfolio, business segments, and recent developments.
|
Attribute |
Detail |
|
Market Size Value in 2021 |
US$ 193.6 Mn |
|
Market Forecast Value in 2031 |
US$ 526.3 Mn |
|
Growth Rate (CAGR) |
10.7% |
|
Forecast Period |
2022–2031 |
|
Historical Data Available for |
2017–2020 |
|
Quantitative Units |
US$ Mn for Value and Million Units for Volume |
|
Market Analysis |
It includes cross segment analysis at global as well as regional level. Furthermore, qualitative analysis includes drivers, restraints, opportunities, key trends, Porter’s Five Forces analysis, value chain analysis, and key trend analysis. |
|
Competition Landscape |
|
|
Format |
Electronic (PDF) + Excel |
|
Market Segmentation |
|
|
Regions Covered |
|
|
Countries Covered |
|
|
Companies Profiled |
|
|
Customization Scope |
Available upon request |
|
Pricing |
Available upon request |
The global GaN substrate market value stood at US$ 193.6 Mn in 2021.
The GaN substrate market is expected to grow at a CAGR of 10.7% during the forecast period.
The market size for GaN substrate is expected to reach US$ 526.3 Mn in 2031.
The U.S. accounted for around 18% share of the GaN substrate market in 2021.
The GaN on sapphire segment is expected to hold approximately 60.0% share of the GaN substrate market during the forecast period.
Increase in demand for GaN substrates in LED manufacturing and rise in adoption of GaN industrial devices.
Asia Pacific is a more lucrative region in the GaN substrate market.
Kyma Technologies, Inc., Kyocera Corporation, Mitsubishi Chemical Corporation, MTI Corporation, NGK Insulators, Ltd., Shin-Etsu Chemical Co., Ltd., SOITEC, Sumitomo Chemical Co., Ltd., Toyoda Gosei Co., Ltd., and Xiamen Powerway Advanced Material Co., Ltd.
1. Preface
1.1. Market Introduction
1.2. Market and Segments Definition
1.3. Market Taxonomy
1.4. Research Methodology
1.5. Assumption and Acronyms
2. Executive Summary
2.1. GaN Substrate Market Overview
2.2. Regional Outline
2.3. Industry Outline
2.4. Market Dynamics Snapshot
2.5. Competition Blueprint
3. Market Dynamics
3.1. Macro-economic Factors
3.2. Drivers
3.3. Restraints
3.4. Opportunities
3.5. Key Trends
3.6. Regulatory Scenario
4. Associated Industry and Key Indicator Assessment
4.1. Parent Industry Overview – Global GaN Technology Industry Overview
4.2. Supply Chain Analysis
4.3. Pricing Analysis
4.4. Technology Roadmap Analysis
4.5. Industry SWOT Analysis
4.6. Porter Five Forces Analysis
4.7. Covid-19 Impact and Recovery Analysis
5. GaN Substrate Market Analysis, By Type
5.1. GaN Substrate Market Value (US$ Mn) and Volume (Million Units) Analysis & Forecast, By Type, 2017–2031
5.1.1. GaN on Sapphire
5.1.2. GaN on Si
5.1.3. GaN on GaN
5.1.4. GaN on Diamond
5.2. Market Attractiveness Analysis, By Type
6. GaN Substrate Market Analysis, By Size
6.1. GaN Substrate Market Value (US$ Mn) Analysis & Forecast, By Size, 2017–2031
6.1.1. 2 Inch
6.1.2. 4 Inch
6.1.3. 6 Inch
6.1.4. 8 Inch
6.2. Market Attractiveness Analysis, By Size
7. GaN Substrate Market Analysis, By Application
7.1. GaN Substrate Market Value (US$ Mn) Analysis & Forecast, By Application, 2017–2031
7.1.1. Transistors
7.1.2. RF Devices
7.1.3. Lasers
7.1.4. LEDs
7.1.5. Others (ICs, Controllers, etc.)
7.2. Market Attractiveness Analysis, By Application
8. GaN Substrate Market Analysis, By End-use Industry
8.1. GaN Substrate Market Value (US$ Mn) Analysis & Forecast, By End-use Industry, 2017–2031
8.1.1. IT & Telecommunication
8.1.2. Consumer Electronics
8.1.3. Automotive
8.1.4. Aerospace & Defense
8.1.5. Healthcare
8.1.6. Others (Energy & Utility, Industrial, etc.)
8.2. Market Attractiveness Analysis, By End-use Industry
9. GaN Substrate Market Analysis and Forecast, By Region
9.1. GaN Substrate Market Value (US$ Mn) and Volume (Million Units) Analysis & Forecast, By Region, 2017–2031
9.1.1. North America
9.1.2. Europe
9.1.3. Asia Pacific
9.1.4. Middle East & Africa
9.1.5. South America
9.2. Market Attractiveness Analysis, By Region
10. North America GaN Substrate Market Analysis and Forecast
10.1. Market Snapshot
10.2. Drivers and Restraints: Impact Analysis
10.3. GaN Substrate Market Value (US$ Mn) and Volume (Million Units) Analysis & Forecast, By Type, 2017–2031
10.3.1. GaN on Sapphire
10.3.2. GaN on Si
10.3.3. GaN on GaN
10.3.4. GaN on Diamond
10.4. GaN Substrate Market Value (US$ Mn) Analysis & Forecast, By Size, 2017–2031
10.4.1. 2 Inch
10.4.2. 4 Inch
10.4.3. 6 Inch
10.4.4. 8 Inch
10.5. GaN Substrate Market Value (US$ Mn) Analysis & Forecast, By Application, 2017–2031
10.5.1. Transistors
10.5.2. RF Devices
10.5.3. Lasers
10.5.4. LEDs
10.5.5. Others (ICs, Controllers, etc.)
10.6. GaN Substrate Market Value (US$ Mn) Analysis & Forecast, By End-use Industry, 2017–2031
10.6.1. IT & Telecommunication
10.6.2. Consumer Electronics
10.6.3. Automotive
10.6.4. Aerospace & Defense
10.6.5. Healthcare
10.6.6. Others (Energy & Utility, Industrial, etc.)
10.7. GaN Substrate Market Value (US$ Mn) and Volume (Million Units) Analysis & Forecast, By Country and Sub-region, 2017–2031
10.7.1. The U.S.
10.7.2. Canada
10.7.3. Rest of North America
10.8. Market Attractiveness Analysis
10.8.1. By Type
10.8.2. By Size
10.8.3. By Application
10.8.4. By End-use Industry
10.8.5. By Country/Sub-region
11. Europe GaN Substrate Market Analysis and Forecast
11.1. Market Snapshot
11.2. Drivers and Restraints: Impact Analysis
11.3. GaN Substrate Market Value (US$ Mn) and Volume (Million Units) Analysis & Forecast, By Type, 2017–2031
11.3.1. GaN on Sapphire
11.3.2. GaN on Si
11.3.3. GaN on GaN
11.3.4. GaN on Diamond
11.4. GaN Substrate Market Value (US$ Mn) Analysis & Forecast, By Size, 2017–2031
11.4.1. 2 Inch
11.4.2. 4 Inch
11.4.3. 6 Inch
11.4.4. 8 Inch
11.5. GaN Substrate Market Value (US$ Mn) Analysis & Forecast, By Application, 2017–2031
11.5.1. Transistors
11.5.2. RF Devices
11.5.3. Lasers
11.5.4. LEDs
11.5.5. Others (ICs, Controllers, etc.)
11.6. GaN Substrate Market Value (US$ Mn) Analysis & Forecast, By End-use Industry, 2017–2031
11.6.1. IT & Telecommunication
11.6.2. Consumer Electronics
11.6.3. Automotive
11.6.4. Aerospace & Defense
11.6.5. Healthcare
11.6.6. Others (Energy & Utility, Industrial, etc.)
11.7. GaN Substrate Market Value (US$ Mn) and Volume (Million Units) Analysis & Forecast, By Country and Sub-region, 2017–2031
11.7.1. The U.K.
11.7.2. Germany
11.7.3. France
11.7.4. Rest of Europe
11.8. Market Attractiveness Analysis
11.8.1. By Type
11.8.2. By Size
11.8.3. By Application
11.8.4. By End-use Industry
11.8.5. By Country/Sub-region
12. Asia Pacific GaN Substrate Market Analysis and Forecast
12.1. Market Snapshot
12.2. Drivers and Restraints: Impact Analysis
12.3. GaN Substrate Market Value (US$ Mn) and Volume (Million Units) Analysis & Forecast, By Type, 2017–2031
12.3.1. GaN on Sapphire
12.3.2. GaN on Si
12.3.3. GaN on GaN
12.3.4. GaN on Diamond
12.4. GaN Substrate Market Value (US$ Mn) Analysis & Forecast, By Size, 2017–2031
12.4.1. 2 Inch
12.4.2. 4 Inch
12.4.3. 6 Inch
12.4.4. 8 Inch
12.5. GaN Substrate Market Value (US$ Mn) Analysis & Forecast, By Application, 2017–2031
12.5.1. Transistors
12.5.2. RF Devices
12.5.3. Lasers
12.5.4. LEDs
12.5.5. Others (ICs, Controllers, etc.)
12.6. GaN Substrate Market Value (US$ Mn) Analysis & Forecast, By End-use Industry, 2017–2031
12.6.1. IT & Telecommunication
12.6.2. Consumer Electronics
12.6.3. Automotive
12.6.4. Aerospace & Defense
12.6.5. Healthcare
12.6.6. Others (Energy & Utility, Industrial, etc.)
12.7. GaN Substrate Market Value (US$ Mn) and Volume (Million Units) Analysis & Forecast, By Country and Sub-region, 2017–2031
12.7.1. China
12.7.2. India
12.7.3. Japan
12.7.4. South Korea
12.7.5. ASEAN
12.7.6. Rest of Asia Pacific
12.8. Market Attractiveness Analysis
12.8.1. By Type
12.8.2. By Size
12.8.3. By Application
12.8.4. By End-use Industry
12.8.5. By Country/Sub-region
13. Middle East & Africa GaN Substrate Market Analysis and Forecast
13.1. Market Snapshot
13.2. Drivers and Restraints: Impact Analysis
13.3. GaN Substrate Market Value (US$ Mn) and Volume (Million Units) Analysis & Forecast, By Type, 2017–2031
13.3.1. GaN on Sapphire
13.3.2. GaN on Si
13.3.3. GaN on GaN
13.3.4. GaN on Diamond
13.4. GaN Substrate Market Value (US$ Mn) Analysis & Forecast, By Size, 2017–2031
13.4.1. 2 Inch
13.4.2. 4 Inch
13.4.3. 6 Inch
13.4.4. 8 Inch
13.5. GaN Substrate Market Value (US$ Mn) Analysis & Forecast, By Application, 2017–2031
13.5.1. Transistors
13.5.2. RF Devices
13.5.3. Lasers
13.5.4. LEDs
13.5.5. Others (ICs, Controllers, etc.)
13.6. GaN Substrate Market Value (US$ Mn) Analysis & Forecast, By End-use Industry, 2017–2031
13.6.1. IT & Telecommunication
13.6.2. Consumer Electronics
13.6.3. Automotive
13.6.4. Aerospace & Defense
13.6.5. Healthcare
13.6.6. Others (Energy & Utility, Industrial, etc.)
13.7. GaN Substrate Market Value (US$ Mn) and Volume (Million Units) Analysis & Forecast, By Country and Sub-region, 2017–2031
13.7.1. GCC
13.7.2. South Africa
13.7.3. Rest of the Middle East & Africa
13.8. Market Attractiveness Analysis
13.8.1. By Type
13.8.2. By Size
13.8.3. By Application
13.8.4. By End-use Industry
13.8.5. By Country/Sub-region
14. South America GaN Substrate Market Analysis and Forecast
14.1. Market Snapshot
14.2. Drivers and Restraints: Impact Analysis
14.3. GaN Substrate Market Value (US$ Mn) and Volume (Million Units) Analysis & Forecast, By Type, 2017–2031
14.3.1. GaN on Sapphire
14.3.2. GaN on Si
14.3.3. GaN on GaN
14.3.4. GaN on Diamond
14.4. GaN Substrate Market Value (US$ Mn) Analysis & Forecast, By Size, 2017–2031
14.4.1. 2 Inch
14.4.2. 4 Inch
14.4.3. 6 Inch
14.4.4. 8 Inch
14.5. GaN Substrate Market Value (US$ Mn) Analysis & Forecast, By Application, 2017–2031
14.5.1. Transistors
14.5.2. RF Devices
14.5.3. Lasers
14.5.4. LEDs
14.5.5. Others (ICs, Controllers, etc.)
14.6. GaN Substrate Market Value (US$ Mn) Analysis & Forecast, By End-use Industry, 2017–2031
14.6.1. IT & Telecommunication
14.6.2. Consumer Electronics
14.6.3. Automotive
14.6.4. Aerospace & Defense
14.6.5. Healthcare
14.6.6. Others (Energy & Utility, Industrial, etc.)
14.7. GaN Substrate Market Value (US$ Mn) and Volume (Million Units) Analysis & Forecast, By Country and Sub-region, 2017–2031
14.7.1. Brazil
14.7.2. Rest of South America
14.8. Market Attractiveness Analysis
14.8.1. By Type
14.8.2. By Size
14.8.3. By Application
14.8.4. By End-use Industry
14.8.5. By Country/Sub-region
15. Competition Assessment
15.1. Global GaN Substrate Market Competition Matrix - a Dashboard View
15.1.1. Global GaN Substrate Market Company Share Analysis, by Value (2021)
15.1.2. Technological Differentiator
16. Company Profiles (Global Manufacturers/Suppliers)
16.1. Kyma Technologies, Inc.
16.1.1. Overview
16.1.2. Product Portfolio
16.1.3. Sales Footprint
16.1.4. Key Subsidiaries or Distributors
16.1.5. Strategy and Recent Developments
16.1.6. Key Financials
16.2. Kyocera Corporation
16.2.1. Overview
16.2.2. Product Portfolio
16.2.3. Sales Footprint
16.2.4. Key Subsidiaries or Distributors
16.2.5. Strategy and Recent Developments
16.2.6. Key Financials
16.3. Mitsubishi Chemical Corporation
16.3.1. Overview
16.3.2. Product Portfolio
16.3.3. Sales Footprint
16.3.4. Key Subsidiaries or Distributors
16.3.5. Strategy and Recent Developments
16.3.6. Key Financials
16.4. MTI Corporation
16.4.1. Overview
16.4.2. Product Portfolio
16.4.3. Sales Footprint
16.4.4. Key Subsidiaries or Distributors
16.4.5. Strategy and Recent Developments
16.4.6. Key Financials
16.5. NGK Insulators, Ltd.
16.5.1. Overview
16.5.2. Product Portfolio
16.5.3. Sales Footprint
16.5.4. Key Subsidiaries or Distributors
16.5.5. Strategy and Recent Developments
16.5.6. Key Financials
16.6. Shin-Etsu Chemical Co., Ltd.
16.6.1. Overview
16.6.2. Product Portfolio
16.6.3. Sales Footprint
16.6.4. Key Subsidiaries or Distributors
16.6.5. Strategy and Recent Developments
16.6.6. Key Financials
16.7. SOITEC
16.7.1. Overview
16.7.2. Product Portfolio
16.7.3. Sales Footprint
16.7.4. Key Subsidiaries or Distributors
16.7.5. Strategy and Recent Developments
16.7.6. Key Financials
16.8. Sumitomo Chemical Co., Ltd.
16.8.1. Overview
16.8.2. Product Portfolio
16.8.3. Sales Footprint
16.8.4. Key Subsidiaries or Distributors
16.8.5. Strategy and Recent Developments
16.8.6. Key Financials
16.9. Toyoda Gosei Co., Ltd.
16.9.1. Overview
16.9.2. Product Portfolio
16.9.3. Sales Footprint
16.9.4. Key Subsidiaries or Distributors
16.9.5. Strategy and Recent Developments
16.9.6. Key Financials
16.10. Xiamen Powerway Advanced Material Co., Ltd.
16.10.1. Overview
16.10.2. Product Portfolio
16.10.3. Sales Footprint
16.10.4. Key Subsidiaries or Distributors
16.10.5. Strategy and Recent Developments
16.10.6. Key Financials
17. Recommendation
17.1. Opportunity Assessment
17.1.1. By Type
17.1.2. By Size
17.1.3. By Application
17.1.4. By End-use Industry
17.1.5. By Region
List of Tables
Table 01: Global GaN Substrate Market Size & Forecast, By Type, Value (US$ Mn), 2017-2031
Table 02: Global GaN Substrate Market Size & Forecast, By Type, Volume (Million Units), 2017-2031
Table 03: Global GaN Substrate Market Size & Forecast, By Size, Value (US$ Mn), 2017-2031
Table 04: Global GaN Substrate Market Size & Forecast, By Application, Value (US$ Mn), 2017-2031
Table 05: Global GaN Substrate Market Size & Forecast, By End-use Industry, Value (US$ Mn), 2017-2031
Table 06: Global GaN Substrate Market Size & Forecast, By Region, Value (US$ Mn), 2017-2031
Table 07: Global GaN Substrate Market Size & Forecast, By Region, Volume (Million Units), 2017-2031
Table 08: North America GaN Substrate Market Size & Forecast, By Type, Value (US$ Mn), 2017-2031
Table 09: North America GaN Substrate Market Size & Forecast, By Type, Volume (Million Units), 2017-2031
Table 10: North America GaN Substrate Market Size & Forecast, By Size, Value (US$ Mn), 2017-2031
Table 11: North America GaN Substrate Market Size & Forecast, By Application, Value (US$ Mn), 2017-2031
Table 12: North America GaN Substrate Market Size & Forecast, By End-use Industry, Value (US$ Mn), 2017-2031
Table 13: North America GaN Substrate Market Size & Forecast, By Country, Value (US$ Mn), 2017-2031
Table 14: North America GaN Substrate Market Size & Forecast, By Country, Volume (Million Units), 2017-2031
Table 15: Europe GaN Substrate Market Size & Forecast, By Type, Value (US$ Mn), 2017-2031
Table 16: Europe GaN Substrate Market Size & Forecast, By Type, Volume (Million Units), 2017-2031
Table 17: Europe GaN Substrate Market Size & Forecast, By Size, Value (US$ Mn), 2017-2031
Table 18: Europe GaN Substrate Market Size & Forecast, By Application, Value (US$ Mn), 2017-2031
Table 19: Europe GaN Substrate Market Size & Forecast, By End-use Industry, Value (US$ Mn), 2017-2031
Table 20: Europe GaN Substrate Market Size & Forecast, By Country, Value (US$ Mn), 2017-2031
Table 21: Europe GaN Substrate Market Size & Forecast, By Country, Volume (Million Units), 2017-2031
Table 22: Asia Pacific GaN Substrate Market Size & Forecast, By Type, Value (US$ Mn), 2017-2031
Table 23: Asia Pacific GaN Substrate Market Size & Forecast, By Type, Volume (Million Units), 2017-2031
Table 24: Asia Pacific GaN Substrate Market Size & Forecast, By Size, Value (US$ Mn), 2017-2031
Table 25: Asia Pacific GaN Substrate Market Size & Forecast, By Application, Value (US$ Mn), 2017-2031
Table 26: Asia Pacific GaN Substrate Market Size & Forecast, By End-use Industry, Value (US$ Mn), 2017-2031
Table 27: Asia Pacific GaN Substrate Market Size & Forecast, By Country, Value (US$ Mn), 2017-2031
Table 28: Asia Pacific GaN Substrate Market Size & Forecast, By Country, Volume (Million Units), 2017-2031
Table 29: Middle East & Africa GaN Substrate Market Size & Forecast, By Type, Value (US$ Mn), 2017-2031
Table 30: Middle East & Africa GaN Substrate Market Size & Forecast, By Type, Volume (Million Units), 2017-2031
Table 31: Middle East & Africa GaN Substrate Market Size & Forecast, By Size, Value (US$ Mn), 2017-2031
Table 32: Middle East & Africa GaN Substrate Market Size & Forecast, By Application, Value (US$ Mn), 2017-2031
Table 33: Middle East & Africa GaN Substrate Market Size & Forecast, By End-use Industry, Value (US$ Mn), 2017-2031
Table 34: Middle East & Africa GaN Substrate Market Size & Forecast, By Country, Value (US$ Mn), 2017-2031
Table 35: Middle East & Africa GaN Substrate Market Size & Forecast, By Country, Volume (Million Units), 2017-2031
Table 36: South America GaN Substrate Market Size & Forecast, By Type, Value (US$ Mn), 2017-2031
Table 37: South America GaN Substrate Market Size & Forecast, By Type, Volume (Million Units), 2017-2031
Table 38: South America GaN Substrate Market Size & Forecast, By Size, Value (US$ Mn), 2017-2031
Table 39: South America GaN Substrate Market Size & Forecast, By Application, Value (US$ Mn), 2017-2031
Table 40: South America GaN Substrate Market Size & Forecast, By End-use Industry, Value (US$ Mn), 2017-2031
Table 41: South America GaN Substrate Market Size & Forecast, By Country, Value (US$ Mn), 2017-2031
Table 42: South America GaN Substrate Market Size & Forecast, By Country, Volume (Million Units), 2017-2031
List of Figures
Figure 01: Global GaN Substrate Market Share Analysis, by Region
Figure 02: Global GaN Substrate Price Trend Analysis (Average Price, US$)
Figure 03: Global GaN Substrate Market, Value (US$ Mn), 2017-2031
Figure 04: Global GaN Substrate Market, Volume (Million Units), 2017-2031
Figure 05: Global GaN Substrate Market Size & Forecast, By Type, Revenue (US$ Mn), 2017-2031
Figure 06: Global GaN Substrate Market Attractiveness, By Type, Value (US$ Mn), 2022-2031
Figure 07: Global GaN Substrate Market Size & Forecast, By Type, Value (US$ Mn), 2022-2031
Figure 08: Global GaN Substrate Market Size & Forecast, By Size, Revenue (US$ Mn), 2017-2031
Figure 09: Global GaN Substrate Market Attractiveness, By Size, Value (US$ Mn), 2022-2031
Figure 10: Global GaN Substrate Market Size & Forecast, By Size, Value (US$ Mn), 2022-2031
Figure 11: Global GaN Substrate Market Size & Forecast, By Application, Revenue (US$ Mn), 2017-2031
Figure 12: Global GaN Substrate Market Attractiveness, By Application, Value (US$ Mn), 2022-2031
Figure 13: Global GaN Substrate Market Size & Forecast, By Application, Value (US$ Mn), 2022-2031
Figure 14: Global GaN Substrate Market Size & Forecast, By End-use Industry, Revenue (US$ Mn), 2017-2031
Figure 15: Global GaN Substrate Market Attractiveness, By End-use Industry, Value (US$ Mn), 2022-2031
Figure 16: Global GaN Substrate Market Size & Forecast, By End-use Industry, Value (US$ Mn), 2022-2031
Figure 17: Global GaN Substrate Market Size & Forecast, By Region, Revenue (US$ Mn), 2017-2031
Figure 18: Global GaN Substrate Market Attractiveness, By Region, Value (US$ Mn), 2022-2031
Figure 19: Global GaN Substrate Market Size & Forecast, By Region, Value (US$ Mn), 2022-2031
Figure 20: North America GaN Substrate Market, Value (US$ Mn), 2017-2031
Figure 21: North America GaN Substrate Market, Volume (Million Units), 2017-2031
Figure 22: North America GaN Substrate Market Size & Forecast, By Type, Revenue (US$ Mn), 2017-2031
Figure 23: North America GaN Substrate Market Attractiveness, By Type, Value (US$ Mn), 2022-2031
Figure 24: North America GaN Substrate Market Size & Forecast, By Type, Value (US$ Mn), 2022-2031
Figure 25: North America GaN Substrate Market Size & Forecast, By Size, Revenue (US$ Mn), 2017-2031
Figure 26: North America GaN Substrate Market Attractiveness, By Size, Value (US$ Mn), 2022-2031
Figure 27: North America GaN Substrate Market Size & Forecast, By Size, Value (US$ Mn), 2022-2031
Figure 28: North America GaN Substrate Market Size & Forecast, By Application, Revenue (US$ Mn), 2017-2031
Figure 29: North America GaN Substrate Market Attractiveness, By Application, Value (US$ Mn), 2022-2031
Figure 30: North America GaN Substrate Market Size & Forecast, By Application, Value (US$ Mn), 2022-2031
Figure 31: North America GaN Substrate Market Size & Forecast, By End-use Industry, Revenue (US$ Mn), 2017-2031
Figure 32: North America GaN Substrate Market Attractiveness, By End-use Industry, Value (US$ Mn), 2022-2031
Figure 33: North America GaN Substrate Market Size & Forecast, By End-use Industry, Value (US$ Mn), 2022-2031
Figure 34: North America GaN Substrate Market Size & Forecast, By Country, Revenue (US$ Mn), 2017-2031
Figure 35: North America GaN Substrate Market Attractiveness, By Country, Value (US$ Mn), 2022-2031
Figure 36: North America GaN Substrate Market Size & Forecast, By Country, Value (US$ Mn), 2022-2031
Figure 37: Europe GaN Substrate Market, Value (US$ Mn), 2017-2031
Figure 38: Europe GaN Substrate Market, Volume (Million Units), 2017-2031
Figure 39: Europe GaN Substrate Market Size & Forecast, By Type, Revenue (US$ Mn), 2017-2031
Figure 40: Europe GaN Substrate Market Attractiveness, By Type, Value (US$ Mn), 2022-2031
Figure 41: Europe GaN Substrate Market Size & Forecast, By Type, Value (US$ Mn), 2022-2031
Figure 42: Europe GaN Substrate Market Size & Forecast, By Size, Revenue (US$ Mn), 2017-2031
Figure 43: Europe GaN Substrate Market Attractiveness, By Size, Value (US$ Mn), 2022-2031
Figure 44: Europe GaN Substrate Market Size & Forecast, By Size, Value (US$ Mn), 2022-2031
Figure 45: Europe GaN Substrate Market Size & Forecast, By Application, Revenue (US$ Mn), 2017-2031
Figure 46: Europe GaN Substrate Market Attractiveness, By Application, Value (US$ Mn), 2022-2031
Figure 47: Europe GaN Substrate Market Size & Forecast, By Application, Value (US$ Mn), 2022-2031
Figure 48: Europe GaN Substrate Market Size & Forecast, By End-use Industry, Revenue (US$ Mn), 2017-2031
Figure 49: Europe GaN Substrate Market Attractiveness, By End-use Industry, Value (US$ Mn), 2022-2031
Figure 50: Europe GaN Substrate Market Size & Forecast, By End-use Industry, Value (US$ Mn), 2022-2031
Figure 51: Europe GaN Substrate Market Size & Forecast, By Country, Revenue (US$ Mn), 2017-2031
Figure 52: Europe GaN Substrate Market Attractiveness, By Country, Value (US$ Mn), 2022-2031
Figure 53: Europe GaN Substrate Market Size & Forecast, By Country, Value (US$ Mn), 2022-2031
Figure 54: Asia Pacific GaN Substrate Market, Value (US$ Mn), 2017-2031
Figure 55: Asia Pacific GaN Substrate Market, Volume (Million Units), 2017-2031
Figure 56: Asia Pacific GaN Substrate Market Size & Forecast, By Type, Revenue (US$ Mn), 2017-2031
Figure 57: Asia Pacific GaN Substrate Market Attractiveness, By Type, Value (US$ Mn), 2022-2031
Figure 58: Asia Pacific GaN Substrate Market Size & Forecast, By Type, Value (US$ Mn), 2022-2031
Figure 59: Asia Pacific GaN Substrate Market Size & Forecast, By Size, Revenue (US$ Mn), 2017-2031
Figure 60: Asia Pacific GaN Substrate Market Attractiveness, By Size, Value (US$ Mn), 2022-2031
Figure 61: Asia Pacific GaN Substrate Market Size & Forecast, By Size, Value (US$ Mn), 2022-2031
Figure 62: Asia Pacific GaN Substrate Market Size & Forecast, By Application, Revenue (US$ Mn), 2017-2031
Figure 63: Asia Pacific GaN Substrate Market Attractiveness, By Application, Value (US$ Mn), 2022-2031
Figure 64: Asia Pacific GaN Substrate Market Size & Forecast, By Application, Value (US$ Mn), 2022-2031
Figure 65: Asia Pacific GaN Substrate Market Size & Forecast, By End-use Industry, Revenue (US$ Mn), 2017-2031
Figure 66: Asia Pacific GaN Substrate Market Attractiveness, By End-use Industry, Value (US$ Mn), 2022-2031
Figure 67: Asia Pacific GaN Substrate Market Size & Forecast, By End-use Industry, Value (US$ Mn), 2022-2031
Figure 68: Asia Pacific GaN Substrate Market Size & Forecast, By Country, Revenue (US$ Mn), 2017-2031
Figure 69: Asia Pacific GaN Substrate Market Attractiveness, By Country, Value (US$ Mn), 2022-2031
Figure 70: Asia Pacific GaN Substrate Market Size & Forecast, By Country, Value (US$ Mn), 2022-2031
Figure 71: Middle East & Africa GaN Substrate Market, Value (US$ Mn), 2017-2031
Figure 72: Middle East & Africa GaN Substrate Market, Volume (Million Units), 2017-2031
Figure 73: Middle East & Africa GaN Substrate Market Size & Forecast, By Type, Revenue (US$ Mn), 2017-2031
Figure 74: Middle East & Africa GaN Substrate Market Attractiveness, By Type, Value (US$ Mn), 2022-2031
Figure 75: Middle East & Africa GaN Substrate Market Size & Forecast, By Type, Value (US$ Mn), 2022-2031
Figure 76: Middle East & Africa GaN Substrate Market Size & Forecast, By Size, Revenue (US$ Mn), 2017-2031
Figure 77: Middle East & Africa GaN Substrate Market Attractiveness, By Size, Value (US$ Mn), 2022-2031
Figure 78: Middle East & Africa GaN Substrate Market Size & Forecast, By Size, Value (US$ Mn), 2022-2031
Figure 79: Middle East & Africa GaN Substrate Market Size & Forecast, By Application, Revenue (US$ Mn), 2017-2031
Figure 80: Middle East & Africa GaN Substrate Market Attractiveness, By Application , Value (US$ Mn), 2022-2031
Figure 81: Middle East & Africa GaN Substrate Market Size & Forecast, By Application, Value (US$ Mn), 2022-2031
Figure 82: Middle East & Africa GaN Substrate Market Size & Forecast, By End-use Industry, Revenue (US$ Mn), 2017-2031
Figure 83: Middle East & Africa GaN Substrate Market Attractiveness, By End-use Industry, Value (US$ Mn), 2022-2031
Figure 84: Middle East & Africa GaN Substrate Market Size & Forecast, By End-use Industry, Value (US$ Mn), 2022-2031
Figure 85: Middle East & Africa GaN Substrate Market Size & Forecast, By Country, Revenue (US$ Mn), 2017-2031
Figure 86: Middle East & Africa GaN Substrate Market Attractiveness, By Country, Value (US$ Mn), 2022-2031
Figure 87: Middle East & Africa GaN Substrate Market Size & Forecast, By Country, Value (US$ Mn), 2022-2031
Figure 88: South America GaN Substrate Market, Value (US$ Mn), 2017-2031
Figure 89: South America GaN Substrate Market, Volume (Million Units), 2017-2031
Figure 90: South America GaN Substrate Market Size & Forecast, By Type, Revenue (US$ Mn), 2017-2031
Figure 91: South America GaN Substrate Market Attractiveness, By Type, Value (US$ Mn), 2022-2031
Figure 92: South America GaN Substrate Market Size & Forecast, By Type, Value (US$ Mn), 2022-2031
Figure 93: South America GaN Substrate Market Size & Forecast, By Size, Revenue (US$ Mn), 2017-2031
Figure 94: South America GaN Substrate Market Attractiveness, By Size, Value (US$ Mn), 2022-2031
Figure 95: South America GaN Substrate Market Size & Forecast, By Size, Value (US$ Mn), 2022-2031
Figure 96: South America GaN Substrate Market Size & Forecast, By Application, Revenue (US$ Mn), 2017-2031
Figure 97: South America GaN Substrate Market Attractiveness, By Application, Value (US$ Mn), 2022-2031
Figure 98: South America GaN Substrate Market Size & Forecast, By Application, Value (US$ Mn), 2022-2031
Figure 99: South America GaN Substrate Market Size & Forecast, By End-use Industry, Revenue (US$ Mn), 2017-2031
Figure 100: South America GaN Substrate Market Attractiveness, By End-use Industry, Value (US$ Mn), 2022-2031
Figure 101: South America GaN Substrate Market Size & Forecast, By End-use Industry, Value (US$ Mn), 2022-2031
Figure 102: South America GaN Substrate Market Size & Forecast, By Country, Revenue (US$ Mn), 2017-2031
Figure 103: South America GaN Substrate Market Attractiveness, By Country, Value (US$ Mn), 2022-2031
Figure 104: South America GaN Substrate Market Size & Forecast, By Country, Value (US$ Mn), 2022-2031
Figure 105: Global GaN Substrate Market Share Analysis, by Company
Copyright © Transparency Market Research, Inc. All Rights reserved
Trust Online

GaN Substrate Market