
Reports
Reports
Analysts’ Viewpoint on Fuel Card Market Scenario
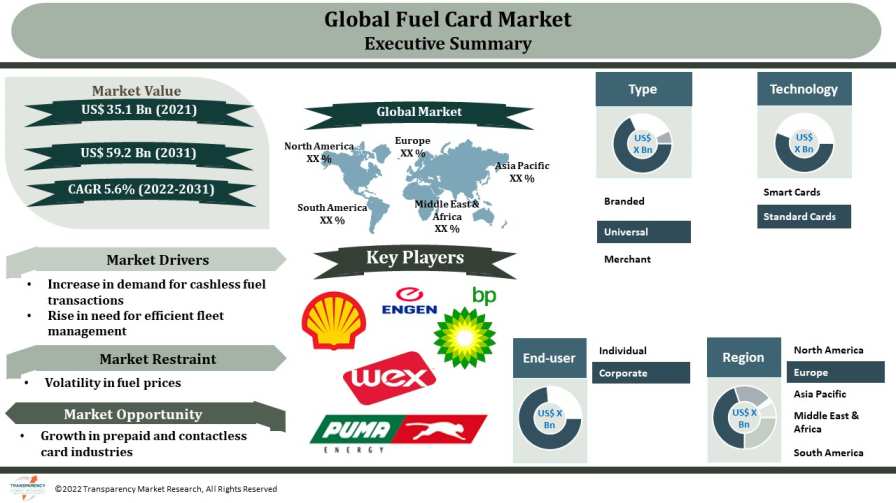
Increase in demand for cashless fuel transactions and widespread adoption of new technologies are driving the global fuel card market.
Rise in adoption of contactless and prepaid cards; and advancements in fuel card services are projected to offer lucrative opportunities to the global market during the forecast period. Fuel cards are convenient to use and offer various benefits to consumers. Smart cards let consumers and fleet owners make quick payments without the hassle of paying in cash.
Key players operating in the global fuel card market are focusing on R&D in advanced technologies such as telematics interfaces, mobile applications, tokenization, and cardholder verification methods to enhance their market share. They are also emphasizing on re-examining payment and system processes according to changing customer preferences.
Fuel card, also known as fleet card, is a mode of cashless payment commonly used for gasoline, diesel, and other fuels at gas stations. Fuel cards and fleet management are gaining traction among customers and fleet owners, as they offer significant cost savings and boost fleet management.
Fuel card companies are simplifying the work of fleet owners by offering them reward points, merchant fuel cards, discounts, and other lucrative incentives. The number of cars has increased as a result of ride-hailing and sharing apps. This trend has placed an added responsibility on owners to manage their fleets cost-effectively.
Contactless and prepaid technologies are comparatively new. According to a study, Canada, Sweden, the U.K., France, and the U.S. are the top five cashless economies in the world. Rapid urbanization and industrialization in developing countries such as China, India, Mexico, South Africa, and Brazil is offering promising opportunities for players in the market. According to SABRIC (The South African Banking Risk Information Center), contactless payment cards are a very secure option akin to traditional cards.
Adoption of fleet management software is rising in transportation and logistics sectors. Key players are making efforts to elevate the personalized experience of customers using analytics. They are adopting the omnichannel experience approach to make customer experience more seamless. This approach is complemented with online channels to make customer acquisition easier, time saving, and cost efficient.
Players in the fuel card market are developing mobile applications to enhance customer service. These apps help customers locate the nearest fuel station.
Volatility in fuel prices is likely to be one of the major restraints of the market. It is difficult to plan and budget fuel expenses, as fuel prices continue to fluctuate. Fuel prices vary between countries. These issues are likely to adversely impact the growth of the market. Measures such as switching to more fuel-efficient vehicles, eliminating idle time, reducing fleet size, and timely maintenance can help decrease fuel consumption. However, managing the budget considering the volatility in fuel prices remains a serious challenge.
In terms of type, the global fuel card market has been segmented into branded, universal, and merchant. The universal segment dominated the market in 2021. The segment is expected to maintain its dominance during the forecast period. Universal fuel cards provide optimized fuel data management service with broad station access. The cards are used exclusively for fuel payments. Universal cards cost lower than other cards.
Merchant and branded segments are also expected to grow significantly during the forecast period. Merchant cards are the best fuel cards for small businesses. Various fuel companies such as Shell, BP, and ExxonMobil offer branded fuel cards. These companies are gradually opting for third-party cards to increase their customer base.
Based on technology, the global fuel card market has been classified into smart cards and standard cards. The standard cards segment held the largest share of 83% of the global fuel card market in 2021. Standard fuel cards offer various benefits such as discounts on fuel expenditure and utility bills.
The smart cards segment is also expected to grow significantly during the forecast period. Demand for smart cards is increasing consistently due to the rise in preference for hassle-free payments among customers. Companies are also providing various value-added services in smart cards.
Europe accounted for the prominent share of the global fuel card market in 2021. Companies in the region are adopting advanced features that benefit consumers. Expansion of the corporate sector coupled with the large number of fleet management companies across Europe is augmenting the corporate end-user segment in the region.
The market in Asia Pacific is driven by the rise in adoption of prepaid and contactless technologies in the region. India and China are the fastest-growing economies, where demand for fuel cards is expected to surge in the next few years.
The global fuel card market is consolidated, with large presence of global players. Market players are offering the best fuel cards to enhance their market share. Strategies followed by key players in the market include business expansion through mergers and acquisitions, product launches, collaborations, and alliances. Shell Group, BP plc., Total Fuel Card, WEX Inc., Caltex, Puma Energy, Engen Petroleum Ltd, Absa Bank Limited, Standard Bank, and First National Bank (FNB) are prominent entities operating in this market.
Each of these players has been profiled in the global fuel card market report based on parameters such as company overview, financial overview, business strategies, product portfolio, business segments, and recent developments.
|
Attribute |
Detail |
|
Market Size Value in 2021 |
US$ 35.1 Bn |
|
Market Forecast Value in 2031 |
US$ 59.2 Bn |
|
Growth Rate (CAGR) |
5.6% |
|
Forecast Period |
2022–2031 |
|
Historical Data Available for |
2017–2020 |
|
Quantitative Units |
US$ Bn for Value & Million Units for Volume |
|
Market Analysis |
Includes cross-segment analysis at the global as well as regional level. Furthermore, qualitative analysis includes drivers, restraints, opportunities, key trends, Porter’s Five Forces analysis, ecosystem analysis, and price trend analysis. |
|
Competition Landscape |
|
|
Format |
Electronic (PDF) + Excel |
|
Market Segmentation |
|
|
Regions Covered |
|
|
Countries Covered |
|
|
Companies Profiled |
|
|
Customization Scope |
Available upon request |
|
Pricing |
Available upon request |
The market stood at US$ 35.1 Bn in 2021
The market is estimated to grow at a CAGR of 5.6% during 2022-2031
Increase in demand for cashless fuel transactions and rise in need for efficient fleet management
The universal segment accounted for maximum share of the market in 2021
Europe held the largest share of the global fuel card market in 2021
Shell Group, BP plc., Total Fuel Card, WEX Inc., Caltex, Puma Energy, Engen Petroleum Ltd., Absa Bank Limited, Standard Bank, and First National Bank (FNB)
1. Preface
1.1. Market Definitions and Scope
1.2. Market Segmentation
1.3. Key Research Objectives
1.4. Research Highlights
2. Assumptions
3. Research Methodology
4. Executive Summary
5. Market Overview
5.1. Market Dynamics
5.1.1. Drivers
5.1.2. Restraints
5.1.3. Opportunities
5.2. Key Trends Analysis
5.2.1. Supply Side
5.2.2. Demand Side
5.3. Key Market Indicators
5.3.1. Advanced and Connected Fleets Market Overview
5.4. Porter’s Five Forces Analysis
5.5. Ecosystem Analysis
5.6. Industry SWOT Analysis
5.7. Covid-19 Impact Analysis
5.8. Technological Overview
5.9. Global Fuel Card Market Analysis and Forecast, 2017 - 2031
5.9.1. Market Value Projections (US$ Mn)
5.9.2. Market Volume Projections (Million Units)
6. Global Fuel Card Market Analysis and Forecast, by Type
6.1. Fuel Card Market (US$ Mn and Million Units), by Type, 2017 - 2031
6.1.1. Branded
6.1.2. Universal
6.1.3. Merchant
6.2. Incremental Opportunity, by Type
7. Global Fuel Card Market Analysis and Forecast, by Technology
7.1. Fuel Card Market (US$ Mn and Million Units), by Technology, 2017 - 2031
7.1.1. Smart Cards
7.1.2. Standard Cards
7.2. Incremental Opportunity, by Technology
8. Global Fuel Card Market Analysis and Forecast, by End-User
8.1. Fuel Card Market (US$ Mn and Million Units), by End-User, 2017 - 2031
8.1.1. Individual
8.1.2. Corporate
8.2. Incremental Opportunity, by End-user
9. Global Fuel Card Market Analysis and Forecast, by Region
9.1. Fuel Card Market (US$ Mn and Million Units), by Region, 2017 - 2031
9.1.1. North America
9.1.2. Europe
9.1.3. Asia Pacific
9.1.4. Middle East & Africa
9.1.5. South America
9.2. Incremental Opportunity, by Region
10. North America Fuel Card Market Analysis and Forecast
10.1. Regional Snapshot
10.2. Key Supplier Analysis
10.3. Key Trend Analysis
10.4. Price Trend Analysis
10.4.1. Weighted Average Selling Price (US$)
10.5. Fuel Card Market (US$ Mn and Million Units), by Type, 2017 - 2031
10.5.1. Branded
10.5.2. Universal
10.5.3. Merchant
10.6. Fuel Card Market (US$ Mn and Million Units), by Technology, 2017 - 2031
10.6.1. Smart Cards
10.6.2. Standard Cards
10.7. Fuel Card Market (US$ Mn and Million Units), by End-user, 2017 - 2031
10.7.1. Individual
10.7.2. Corporate
10.8. Fuel Card Market (US$ Mn and Million Units) Forecast, By Country & Sub-region, 2017 - 2031
10.8.1. U.S.
10.8.2. Canada
10.8.3. Rest of North America
10.9. Incremental Opportunity Analysis
11. Europe Fuel Card Market Analysis and Forecast
11.1. Regional Snapshot
11.2. Key Supplier Analysis
11.3. Key Trend Analysis
11.4. Price Trend Analysis
11.4.1. Weighted Average Selling Price (US$)
11.5. Fuel Card Market (US$ Mn and Million Units), by Type, 2017 - 2031
11.5.1. Branded
11.5.2. Universal
11.5.3. Merchant
11.6. Fuel Card Market (US$ Mn and Million Units), by Technology, 2017 - 2031
11.6.1. Smart Cards
11.6.2. Standard Cards
11.7. Fuel Card Market (US$ Mn and Million Units), by End-user, 2017 - 2031
11.7.1. Individual
11.7.2. Corporate
11.8. Fuel Card Market (US$ Mn and Million Units) Forecast, By Country & Sub-region, 2017 - 2031
11.8.1. U.K.
11.8.2. Germany
11.8.3. France
11.8.4. Rest of Europe
11.9. Incremental Opportunity Analysis
12. Asia Pacific Fuel Card Market Analysis and Forecast
12.1. Regional Snapshot
12.2. Key Supplier Analysis
12.3. Key Trend Analysis
12.4. Price Trend Analysis
12.4.1. Weighted Average Selling Price (US$)
12.5. Fuel Card Market (US$ Mn and Million Units), by Type, 2017 - 2031
12.5.1. Branded
12.5.2. Universal
12.5.3. Merchant
12.6. Fuel Card Market (US$ Mn and Million Units), by Technology, 2017 - 2031
12.6.1. Smart Cards
12.6.2. Standard Cards
12.7. Fuel Card Market (US$ Mn and Million Units), by End-user, 2017 - 2031
12.7.1. Individual
12.7.2. Corporate
12.8. Fuel Card Market (US$ Mn and Million Units) Forecast, By Country & Sub-region, 2017 - 2031
12.8.1. China
12.8.2. India
12.8.3. Japan
12.8.4. Rest of Asia Pacific
12.9. Incremental Opportunity Analysis
13. Middle East & Africa Fuel Card Market Analysis and Forecast
13.1. Regional Snapshot
13.2. Key Supplier Analysis
13.3. Key Trend Analysis
13.4. Price Trend Analysis
13.4.1. Weighted Average Selling Price (US$)
13.5. Fuel Card Market (US$ Mn and Million Units), by Type, 2017 - 2031
13.5.1. Branded
13.5.2. Universal
13.5.3. Merchant
13.6. Fuel Card Market (US$ Mn and Million Units), by Technology, 2017 - 2031
13.6.1. Smart Cards
13.6.2. Standard Cards
13.7. Fuel Card Market (US$ Mn and Million Units), by End-user, 2017 - 2031
13.7.1. Individual
13.7.2. Corporate
13.8. Fuel Card Market (US$ Mn and Million Units) Forecast, By Country & Sub-region, 2017 - 2031
13.8.1. GCC
13.8.2. South Africa
13.8.3. Rest of Middle East & Africa
13.9. Incremental Opportunity Analysis
14. South America Fuel Card Market Analysis and Forecast
14.1. Regional Snapshot
14.2. Key Supplier Analysis
14.3. Key Trend Analysis
14.4. Price Trend Analysis
14.4.1. Weighted Average Selling Price (US$)
14.5. Fuel Card Market (US$ Mn and Million Units), by Type, 2017 - 2031
14.5.1. Branded
14.5.2. Universal
14.5.3. Merchant
14.6. Fuel Card Market (US$ Mn and Million Units), by Technology, 2017 - 2031
14.6.1. Smart Cards
14.6.2. Standard Cards
14.7. Fuel Card Market (US$ Mn and Million Units), by End-user, 2017 - 2031
14.7.1. Individual
14.7.2. Corporate
14.8. Fuel Card Market (US$ Mn and Million Units) Forecast, By Country & Sub-region, 2017 - 2031
14.8.1. Brazil
14.8.2. Rest of South America
14.9. Incremental Opportunity Analysis
15. Competition Landscape
15.1. Market Player – Competition Dashboard
15.2. Market Revenue Share Analysis (%), (2021)
15.3. Company Profiles (Details – Company Overview, Sales Area/Geographical Presence, Revenue, Strategy & Business Overview)
15.3.1. Absa Bank Limited
15.3.1.1. Company Overview
15.3.1.2. Sales Area/Geographical Presence
15.3.1.3. Revenue
15.3.1.4. Strategy & Business Overview
15.3.2. BP plc.
15.3.2.1. Company Overview
15.3.2.2. Sales Area/Geographical Presence
15.3.2.3. Revenue
15.3.2.4. Strategy & Business Overview
15.3.3. Caltex
15.3.3.1. Company Overview
15.3.3.2. Sales Area/Geographical Presence
15.3.3.3. Revenue
15.3.3.4. Strategy & Business Overview
15.3.4. Engen Petroleum Ltd
15.3.4.1. Company Overview
15.3.4.2. Sales Area/Geographical Presence
15.3.4.3. Revenue
15.3.4.4. Strategy & Business Overview
15.3.5. First National Bank (FNB)
15.3.5.1. Company Overview
15.3.5.2. Sales Area/Geographical Presence
15.3.5.3. Revenue
15.3.5.4. Strategy & Business Overview
15.3.6. Puma Energy
15.3.6.1. Company Overview
15.3.6.2. Sales Area/Geographical Presence
15.3.6.3. Revenue
15.3.6.4. Strategy & Business Overview
15.3.7. Shell Group
15.3.7.1. Company Overview
15.3.7.2. Sales Area/Geographical Presence
15.3.7.3. Revenue
15.3.7.4. Strategy & Business Overview
15.3.8. Standard Bank
15.3.8.1. Company Overview
15.3.8.2. Sales Area/Geographical Presence
15.3.8.3. Revenue
15.3.8.4. Strategy & Business Overview
15.3.9. Total Fuel Card
15.3.9.1. Company Overview
15.3.9.2. Sales Area/Geographical Presence
15.3.9.3. Revenue
15.3.9.4. Strategy & Business Overview
15.3.10. WEX Inc.
15.3.10.1. Company Overview
15.3.10.2. Sales Area/Geographical Presence
15.3.10.3. Revenue
15.3.10.4. Strategy & Business Overview
16. Key Takeaways
16.1. Identification of Potential Market Spaces
16.1.1. By Type
16.1.2. By Technology
16.1.3. By End-user
16.1.4. By Region
16.2. Prevailing Market Risks
16.3. Preferred Sales & Marketing Strategy
List of Tables
Table 1: Global Fuel Card Market Volume (Million Units), by Type, 2017 - 2031
Table 2: Global Fuel Card Market Value (US$ Mn), by Type, 2017 - 2031
Table 3: Global Fuel Card Market Volume (Million Units), by Technology, 2017 - 2031
Table 4: Global Fuel Card Market Value (US$ Mn), by Technology, 2017 - 2031
Table 5: Global Fuel Card Market Volume (Million Units), by End-user, 2017 - 2031
Table 6: Global Fuel Card Market Value (US$ Mn), by End-user, 2017 - 2031
Table 7: Global Fuel Card Market Volume (Million Units), by Region, 2017 - 2031
Table 8: Global Fuel Card Market Value (US$ Mn), by Region, 2017 - 2031
Table 9: North America Fuel Card Market Volume (Million Units), by Type, 2017 - 2031
Table 10: North America Fuel Card Market Value (US$ Mn), by Type, 2017 - 2031
Table 11: North America Fuel Card Market Volume (Million Units), by Technology, 2017 - 2031
Table 12: North America Fuel Card Market Value (US$ Mn), by Technology, 2017 - 2031
Table 13: North America Fuel Card Market Volume (Million Units), by End-user, 2017 - 2031
Table 14: North America Fuel Card Market Value (US$ Mn), by End-user, 2017 - 2031
Table 15: North America Fuel Card Market Volume (Million Units), by Country, 2017 - 2031
Table 16: North America Fuel Card Market Value (US$ Mn), by Country, 2017 - 2031
Table 17: Europe Fuel Card Market Volume (Million Units), by Type, 2017 - 2031
Table 18: Europe Fuel Card Market Value (US$ Mn), by Type, 2017 - 2031
Table 19: Europe Fuel Card Market Volume (Million Units), by Technology, 2017 - 2031
Table 20: Europe Fuel Card Market Value (US$ Mn), by Technology, 2017 - 2031
Table 21: Europe Fuel Card Market Volume (Million Units), by End-user, 2017 - 2031
Table 22: Europe Fuel Card Market Value (US$ Mn), by End-user, 2017 - 2031
Table 23: Europe Fuel Card Market Volume (Million Units), by Country, 2017 - 2031
Table 24: Europe Fuel Card Market Value (US$ Mn), by Country, 2017 - 2031
Table 25: Asia Pacific Fuel Card Market Volume (Million Units), by Type, 2017 - 2031
Table 26: Asia Pacific Fuel Card Market Value (US$ Mn), by Type, 2017 - 2031
Table 27: Asia Pacific Fuel Card Market Volume (Million Units), by Technology, 2017 - 2031
Table 28: Asia Pacific Fuel Card Market Value (US$ Mn), by Technology, 2017 - 2031
Table 29: Asia Pacific Fuel Card Market Volume (Million Units), by End-user, 2017 - 2031
Table 30: Asia Pacific Fuel Card Market Value (US$ Mn), by End-user, 2017 - 2031
Table 31: Asia Pacific Fuel Card Market Volume (Million Units), by Country, 2017 - 2031
Table 32: Asia Pacific Fuel Card Market Value (US$ Mn), by Country, 2017 - 2031
Table 33: Middle East & Africa Fuel Card Market Volume (Million Units), by Type, 2017 - 2031
Table 34: Middle East & Africa Fuel Card Market Value (US$ Mn), by Type, 2017 - 2031
Table 35: Middle East & Africa Fuel Card Market Volume (Million Units), by Technology, 2017 - 2031
Table 36: Middle East & Africa Fuel Card Market Value (US$ Mn), by Technology, 2017 - 2031
Table 37: Middle East & Africa Fuel Card Market Volume (Million Units), by End-user, 2017 - 2031
Table 38: Middle East & Africa Fuel Card Market Value (US$ Mn), by End-user, 2017 - 2031
Table 39: Middle East & Africa Fuel Card Market Volume (Million Units), by Country, 2017 - 2031
Table 40: Middle East & Africa Fuel Card Market Value (US$ Mn), by Country, 2017 - 2031
Table 41: South America Fuel Card Market Volume (Million Units), by Type, 2017 - 2031
Table 42: South America Fuel Card Market Value (US$ Mn), by Type, 2017 - 2031
Table 43: South America Fuel Card Market Volume (Million Units), by Technology, 2017 - 2031
Table 44: South America Fuel Card Market Value (US$ Mn), by Technology, 2017 - 2031
Table 45: South America Fuel Card Market Volume (Million Units), by End-user, 2017 - 2031
Table 46: South America Fuel Card Market Value (US$ Mn), by End-user, 2017 - 2031
Table 47: South America Fuel Card Market Volume (Million Units), by Country, 2017 - 2031
Table 48: South America Fuel Card Market Value (US$ Mn), by Country, 2017 - 2031
List of Figures
Figure 1: Global Fuel Card Market Volume (Million Units), by Type, 2017 - 2031
Figure 2: Global Fuel Card Market Value (US$ Mn), by Type, 2017 - 2031
Figure 3: Global Fuel Card Market Incremental Opportunity (US$ Mn), Forecast, by Type, 2022 - 2031
Figure 4: Global Fuel Card Market Volume (Million Units), by Technology, 2017 - 2031
Figure 5: Global Fuel Card Market Value (US$ Mn), by Technology, 2017 - 2031
Figure 6: Global Fuel Card Market Incremental Opportunity (US$ Mn), Forecast, by Technology, 2022 - 2031
Figure 7: Global Fuel Card Market Volume (Million Units), by End-user, 2017 - 2031
Figure 8: Global Fuel Card Market Value (US$ Mn), by End-user, 2017 - 2031
Figure 9: Global Fuel Card Market Incremental Opportunity (US$ Mn), Forecast, by End-user, 2022 - 2031
Figure 10: Global Fuel Card Market Volume (Million Units), by Region, 2017 - 2031
Figure 11: Global Fuel Card Market Value (US$ Mn), by Region, 2017 - 2031
Figure 12: Global Fuel Card Market Incremental Opportunity (US$ Mn), Forecast, by Region, 2022 - 2031
Figure 13: North America Fuel Card Market Volume (Million Units), by Type, 2017 - 2031
Figure 14: North America Fuel Card Market Value (US$ Mn), by Type, 2017 - 2031
Figure 15: North America Fuel Card Market Incremental Opportunity (US$ Mn), Forecast, by Type, 2022 - 2031
Figure 16: North America Fuel Card Market Volume (Million Units), by Technology, 2017 - 2031
Figure 17: North America Fuel Card Market Value (US$ Mn), by Technology, 2017 - 2031
Figure 18: North America Fuel Card Market Incremental Opportunity (US$ Mn), Forecast, by Technology, 2022 - 2031
Figure 19: North America Fuel Card Market Volume (Million Units), by End-user, 2017 - 2031
Figure 20: North America Fuel Card Market Value (US$ Mn), by End-user, 2017 - 2031
Figure 21: North America Fuel Card Market Incremental Opportunity (US$ Mn), Forecast, by End-user, 2022 - 2031
Figure 22: North America Fuel Card Market Volume (Million Units), by Country, 2017 - 2031
Figure 23: North America Fuel Card Market Value (US$ Mn), by Country, 2017 - 2031
Figure 24: North America Fuel Card Market Incremental Opportunity (US$ Mn), Forecast, by Country, 2022 - 2031
Figure 25: Europe Fuel Card Market Volume (Million Units), by Type, 2017 - 2031
Figure 26: Europe Fuel Card Market Value (US$ Mn), by Type, 2017 - 2031
Figure 27: Europe Fuel Card Market Incremental Opportunity (US$ Mn), Forecast, by Type, 2022 - 2031
Figure 28: Europe Fuel Card Market Volume (Million Units), by Technology, 2017 - 2031
Figure 29: Europe Fuel Card Market Value (US$ Mn), by Technology, 2017 - 2031
Figure 30: Europe Fuel Card Market Incremental Opportunity (US$ Mn), Forecast, by Technology, 2022 - 2031
Figure 31: Europe Fuel Card Market Volume (Million Units), by End-user, 2017 - 2031
Figure 32: Europe Fuel Card Market Value (US$ Mn), by End-user, 2017 - 2031
Figure 33: Europe Fuel Card Market Incremental Opportunity (US$ Mn), Forecast, by End-user, 2022 - 2031
Figure 34: Europe Fuel Card Market Volume (Million Units), by Country, 2017 - 2031
Figure 35: Europe Fuel Card Market Value (US$ Mn), by Country, 2017 - 2031
Figure 36: Europe Fuel Card Market Incremental Opportunity (US$ Mn), Forecast, by Country, 2022 - 2031
Figure 37: Asia Pacific Fuel Card Market Volume (Million Units), by Type, 2017 - 2031
Figure 38: Asia Pacific Fuel Card Market Value (US$ Mn), by Type, 2017 - 2031
Figure 39: Asia Pacific Fuel Card Market Incremental Opportunity (US$ Mn), Forecast, by Type, 2022 - 2031
Figure 40: Asia Pacific Fuel Card Market Volume (Million Units), by Technology, 2017 - 2031
Figure 41: Asia Pacific Fuel Card Market Value (US$ Mn), by Technology, 2017 - 2031
Figure 42: Asia Pacific Fuel Card Market Incremental Opportunity (US$ Mn), Forecast, by Technology, 2022 - 2031
Figure 43: Asia Pacific Fuel Card Market Volume (Million Units), by End-user, 2017 - 2031
Figure 44: Asia Pacific Fuel Card Market Value (US$ Mn), by End-user, 2017 - 2031
Figure 45: Asia Pacific Fuel Card Market Incremental Opportunity (US$ Mn), Forecast, by End-user, 2022 - 2031
Figure 46: Asia Pacific Fuel Card Market Volume (Million Units), by Country, 2017 - 2031
Figure 47: Asia Pacific Fuel Card Market Value (US$ Mn), by Country, 2017 - 2031
Figure 48: Asia Pacific Fuel Card Market Incremental Opportunity (US$ Mn), Forecast, by Country, 2022 - 2031
Figure 49: Middle East & Africa Fuel Card Market Volume (Million Units), by Type, 2017 - 2031
Figure 50: Middle East & Africa Fuel Card Market Value (US$ Mn), by Type, 2017 - 2031
Figure 51: Middle East & Africa Fuel Card Market Incremental Opportunity (US$ Mn), Forecast, by Type, 2022 - 2031
Figure 52: Middle East & Africa Fuel Card Market Volume (Million Units), by Technology, 2017 - 2031
Figure 53: Middle East & Africa Fuel Card Market Value (US$ Mn), by Technology, 2017 - 2031
Figure 54: Middle East & Africa Fuel Card Market Incremental Opportunity (US$ Mn), Forecast, by Technology, 2022 - 2031
Figure 55: Middle East & Africa Fuel Card Market Volume (Million Units), by End-user, 2017 - 2031
Figure 56: Middle East & Africa Fuel Card Market Value (US$ Mn), by End-user, 2017 - 2031
Figure 57: Middle East & Africa Fuel Card Market Incremental Opportunity (US$ Mn), Forecast, by End-user, 2022 - 2031
Figure 58: Middle East & Africa Fuel Card Market Volume (Million Units), by Country, 2017 - 2031
Figure 59: Middle East & Africa Fuel Card Market Value (US$ Mn), by Country, 2017 - 2031
Figure 60: Middle East & Africa Fuel Card Market Incremental Opportunity (US$ Mn), Forecast, by Country, 2022 - 2031
Figure 61: South America Fuel Card Market Volume (Million Units), by Type, 2017 - 2031
Figure 62: South America Fuel Card Market Value (US$ Mn), by Type, 2017 - 2031
Figure 63: South America Fuel Card Market Incremental Opportunity (US$ Mn), Forecast, by Type, 2022 - 2031
Figure 64: South America Fuel Card Market Volume (Million Units), by Technology, 2017 - 2031
Figure 65: South America Fuel Card Market Value (US$ Mn), by Technology, 2017 - 2031
Figure 66: South America Fuel Card Market Incremental Opportunity (US$ Mn), Forecast, by Technology, 2022 - 2031
Figure 67: South America Fuel Card Market Volume (Million Units), by End-user, 2017 - 2031
Figure 68: South America Fuel Card Market Value (US$ Mn), by End-user, 2017 - 2031
Figure 69: South America Fuel Card Market Incremental Opportunity (US$ Mn), Forecast, by End-user, 2022 - 2031
Figure 70: South America Fuel Card Market Volume (Million Units), by Country, 2017 - 2031
Figure 71: South America Fuel Card Market Value (US$ Mn), by Country, 2017 - 2031
Figure 72: South America Fuel Card Market Incremental Opportunity (US$ Mn), Forecast, by Country, 2022 - 2031
Copyright © Transparency Market Research, Inc. All Rights reserved
Trust Online

Fuel Card Market