
Reports
Reports
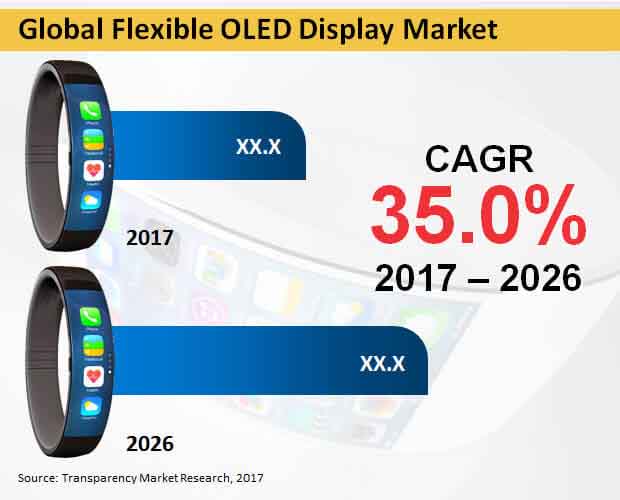
OLED or Organic Light Emitting Diode is one of the most advanced technologies that permits the display to be bent, rolled, and folded. An OLED display attains this sort of flexibility by including a flexible substrate below the organic one. OLED displays are preferred over their LCD counterparts as they have lower energy consumption as they operate without a backlight. The demand for flexible displays arises largely from the consumer electronics industry as flexible displays can be used to great effect in smartphones, televisions, wearables, and tablets. Transparency Market Research estimates that the global flexible OLED market should witness an exponential CAGR of 35% from 2017 to 2026.
AMOLED Segment Surges Ahead of PMOLED in Flexible OLED Display Market
The AMOLED segment dominates the flexible OLED display market and is expected to gain substantial share over the course of the forecast period. The AMOLED segment is poised to be worth slightly under US$ 3 billion by the end of 2026, making it an opportunity too large to ignore in the flexible OLED display market. The maximum share is contributed by the APEJ region and this is unlikely to change anytime soon. The PMOLED segment is considerably smaller in comparison. Nonetheless, it is unwise to ignore this segment entirely in favor of the AMOLED segment as PMOLED has a double-digit revenue share in the flexible OLED display market.
Curved Displays More Popular than Foldable Displays in Flexible OLED Display Market
The curved display segment holds the lion’s share of the flexible OLED display market by flexibility type but is poised to lose massive share over the period of the study. However, curved displays are predicted to retain their leadership position in the flexible OLED display market. The curved display segment is projected to have a value of more than US$ 180 million in 2017 alone with APEJ comprising the bulk of the market. However, a larger CAGR is projected in the Japan curved display market and companies would do well to take this into account while devising their regional strategies.
Huge Demand in Lighting and Smartphone Segment for Flexible OLED Displays
In terms of application, the lighting and the smartphone segment have a similar revenue share in the flexible OLED display market with the former inching slightly ahead. The lighting segment could create an absolute dollar opportunity of approx. US$ 237 million from the year 2017 to 2026. Along with lighting, companies are recommended to target the smartphone segment with all guns blazing. The proliferation of smartphones as a result of plunging prices is fuelling adoption, particularly in the highly populous APEJ region. OLED displays are preferred over LCD as they offer an extremely high contrast ratio, sharper and clear images, and are more power-efficient in the long run. The APEJ smartphone segment of the flexible OLED display market is larger than that of North America and Europe combined.
Niche Potential in Television and Monitor Segment of Flexible OLED Display Market
The television and monitor segment have a marginal revenue share in the flexible OLED display market with the television segment assessed to grow faster. OLED displays are very expensive to mass-produce on a large scale and the television segment of the flexible OLED display market is on track to have a value of roughly half a billion dollars only by the end of 2026.
Competition Dashboard in the Flexible OLED Display Market
The companies profiled in the report are LG Display, AU Optronics, Samsung Display, CSOT, EverDisplay Optronics (EDO), Japan Display, Visionox, Universal Display, RiTdisplay, and BOE Technology.
Flexible OLED Display Market to Gain Immensely from Electronic Industry
OLED or Organic Light Emitting Diode is perhaps the most trend setting innovations that allows the display to be twisted, rolled, and collapsed. An OLED display accomplishes such adaptability by including a flexible substrate beneath the natural one. OLED displays are liked over their LCD partners as they have lower energy utilization as they work without a backdrop illumination. The interest for flexible displays emerges generally from the shopper gadgets industry as flexible displays can be utilized to incredible impact in TVs, cell phones, laptops, tablets, and wearable.
OLED display is unquestionably further developed innovation contrasted with LCD which is its partners. The OLED display which permits the display to be moved, collapsed, and twisted, draws in the purchaser for its display quality and new looks. OLED display is a lot of renown among technically knowledgeable individuals. The ascent in cell phones, TVs, tablets, and wearable gadgets will emphatically affect the OLED display market, as a large portion of these gadgets have begun utilizing OLED display to pull in the possible purchasers.
The rising interest for the bended display which is just conceivable by OLED displays has ended up being ongoing top choices among the new age which is giving a lift in the development of the worldwide market. Ascend in extra cash is relied upon to function as auxiliary factor in the ascent of the development of the market. Clients with higher earnings are getting TVs with a higher goal is expanding. It has been seen that there has been a huge ascent in the development of the 4K TVs sets in nations like Brazil, India, and China. Move from customary watching experience to a high level mechanical display is filling the worldwide OELD displays market. Another factor which is advancing the development of the market is the increment in size of the Television size across the world. Anyway certain components, for example, section level hindrance for an association went with unpredictable and costly expense of creation is required to hinder the market development.
1. Global Economic Outlook
1.1. Electronics and Smart Devices Industry Outlook
2. Global Flexible OLED Display Market - Executive Summary
3. Global Flexible OLED Display Market Overview
3.1. Introduction
3.1.1. Global Flexible OLED Display Market Taxonomy
3.1.2. Global Flexible OLED Display Market Definition
3.2. Global Flexible OLED Display Market Size (US$ Mn) and Forecast, 2014-2026
3.2.1. Global Flexible OLED Display Market Y-o-Y Growth
3.3. Global Flexible OLED Display Market Dynamics
3.4. Evolution of Display Technology
3.5. Roadmap for Flexible Display
3.6. Challenges of Flexible OLED’s
3.7. Flexible OLED Ecosystem
3.8. Supply Chain
3.9. Cost Structure
3.10. PESTLE Analysis
3.11. Porter’s Five Forces Analysis
3.12. Region wise Market Positioning Assessment
3.13. Forecast Factors
3.14. Key Participants Market Presence (Intensity Map) By Region
4. Global Flexible OLED Display Market Analysis and Forecast 2014-2026
4.1. Global Flexible OLED Display Market Size and Forecast By Control Scheme, 2014-2026
4.1.1. PMOLED Market Size and Forecast, 2014-2026
4.1.1.1. Revenue (US$ Mn) Comparison, By Region
4.1.1.2. Market Share Comparison, By Region
4.1.1.3. Y-o-Y growth Comparison, By Region
4.1.2. AMOLED Market Size and Forecast, 2014-2026
4.1.2.1. Revenue (US$ Mn) Comparison, By Region
4.1.2.2. Market Share Comparison, By Region
4.1.2.3. Y-o-Y growth Comparison, By Region
4.2. Global Flexible OLED Display Market Size and Forecast By Flexibility Type, 2014-2026
4.2.1. Curved Display Market Size and Forecast, 2014-2026
4.2.1.1. Revenue (US$ Mn) Comparison, By Region
4.2.1.2. Market Share Comparison, By Region
4.2.1.3. Y-o-Y growth Comparison, By Region
4.2.2. Foldable Display Market Size and Forecast, 2014-2026
4.2.2.1. Revenue (US$ Mn) Comparison, By Region
4.2.2.2. Market Share Comparison, By Region
4.2.2.3. Y-o-Y growth Comparison, By Region
4.3. Global Flexible OLED Display Market Size and Forecast By Application, 2014-2026
4.3.1. Lighting Market Size and Forecast, 2014-2026
4.3.1.1. Revenue (US$ Mn) Comparison, By Region
4.3.1.2. Market Share Comparison, By Region
4.3.1.3. Y-o-Y growth Comparison, By Region
4.3.2. Smart Phones Market Size and Forecast, 2014-2026
4.3.2.1. Revenue (US$ Mn) Comparison, By Region
4.3.2.2. Market Share Comparison, By Region
4.3.2.3. Y-o-Y growth Comparison, By Region
4.3.3. Television Market Size and Forecast, 2014-2026
4.3.3.1. Revenue (US$ Mn) Comparison, By Region
4.3.3.2. Market Share Comparison, By Region
4.3.3.3. Y-o-Y growth Comparison, By Region
4.3.4. Monitor Market Size and Forecast, 2014-2026
4.3.4.1. Revenue (US$ Mn) Comparison, By Region
4.3.4.2. Market Share Comparison, By Region
4.3.4.3. Y-o-Y growth Comparison, By Region
4.3.5. Wearables Market Size and Forecast, 2014-2026
4.3.5.1. Revenue (US$ Mn) Comparison, By Region
4.3.5.2. Market Share Comparison, By Region
4.3.5.3. Y-o-Y growth Comparison, By Region
4.3.6. Others Market Size and Forecast, 2014-2026
4.3.6.1. Revenue (US$ Mn) Comparison, By Region
4.3.6.2. Market Share Comparison, By Region
4.3.6.3. Y-o-Y growth Comparison, By Region
5. North America Flexible OLED Display Market Size and Forecast, 2014-2026
5.1. North America Outlook
5.2. North America Electronics and Smart Devices Industry Outlook
5.3. North America Flexible OLED Display Market Outlook
5.4. Revenue (US$ Mn) Comparison, By Country
5.4.1. US Market Size and Forecast (US$ Mn), 2014-2026
5.4.2. Canada Market Size and Forecast (US$ Mn), 2014-2026
5.5. Revenue (US$ Mn) Comparison, By Control Scheme
5.6. Revenue (US$ Mn) Comparison, By Flexibility Type
5.7. Revenue (US$ Mn) Comparison, By Application
6. Latin America Flexible OLED Display Market Size and Forecast, 2014-2026
6.1. Latin America Outlook
6.2. Latin America Electronics and Smart Devices Industry Outlook
6.3. Latin America Flexible OLED Display Market Outlook
6.4. Revenue (US$ Mn) Comparison, By Country
6.4.1. Brazil Market Size and Forecast (US$ Mn), 2014-2026
6.4.2. Mexico Market Size and Forecast (US$ Mn), 2014-2026
6.4.3. Rest of Latin America Market Size and Forecast (US$ Mn), 2014-2026
6.5. Revenue (US$ Mn) Comparison, By Control Scheme
6.6. Revenue (US$ Mn) Comparison, By Flexibility Type
6.7. Revenue (US$ Mn) Comparison, By Application
7. Europe Flexible OLED Display Market Size and Forecast, 2014-2026
7.1. Europe Outlook
7.2. Europe Electronics and Smart Devices Industry Outlook
7.3. Europe Flexible OLED Display Market Outlook
7.4. Revenue (US$ Mn) Comparison, By Country
7.4.1. Germany Market Size and Forecast (US$ Mn), 2014-2026
7.4.2. UK Market Size and Forecast (US$ Mn), 2014-2026
7.4.3. France Market Size and Forecast (US$ Mn), 2014-2026
7.4.4. Spain Market Size and Forecast (US$ Mn), 2014-2026
7.4.5. Italy Market Size and Forecast (US$ Mn), 2014-2026
7.4.6. Rest of Europe Market Size and Forecast (US$ Mn), 2014-2026
7.5. Revenue (US$ Mn) Comparison, By Control Scheme
7.6. Revenue (US$ Mn) Comparison, By Flexibility Type
7.7. Revenue (US$ Mn) Comparison, By Application
8. Japan Flexible OLED Display Market Size and Forecast, 2014-2026
8.1. Japan Outlook
8.2. Japan Electronics and Smart Devices Industry Outlook
8.3. Japan Flexible OLED Display Market Outlook
8.4. Revenue (US$ Mn) Comparison, By Country
8.4.1. Japan Market Size and Forecast (US$ Mn), 2014-2026
8.5. Revenue (US$ Mn) Comparison, By Control Scheme
8.6. Revenue (US$ Mn) Comparison, By Flexibility Type
8.7. Revenue (US$ Mn) Comparison, By Application
9. APEJ Flexible OLED Display Market Size and Forecast, 2014-2026
9.1. APEJ Outlook
9.2. APEJ Electronics and Smart Devices Industry Outlook
9.3. APEJ Flexible OLED Display Market Outlook
9.4. Revenue (US$ Mn) Comparison, By Country
9.4.1. China Market Size and Forecast (US$ Mn), 2014-2026
9.4.2. Taiwan Market Size and Forecast (US$ Mn), 2014-2026
9.4.3. South Korea Market Size and Forecast (US$ Mn), 2014-2026
9.4.4. Australia Market Size and Forecast (US$ Mn), 2014-2026
9.4.5. India Market Size and Forecast (US$ Mn), 2014-2026
9.4.6. Rest of APEJ Market Size and Forecast (US$ Mn), 2014-2026
9.5. Revenue (US$ Mn) Comparison, By Control Scheme
9.6. Revenue (US$ Mn) Comparison, By Flexibility Type
9.7. Revenue (US$ Mn) Comparison, By Application
10. MEA Flexible OLED Display Market Size and Forecast, 2014-2026
10.1. MEA Outlook
10.2. MEA Electronics and Smart Devices Industry Outlook
10.3. MEA Flexible OLED Display Market Outlook
10.4. Revenue (US$ Mn) Comparison, By Country
10.4.1. GCC Countries Market Size and Forecast (US$ Mn), 2014-2026
10.4.2. South Africa Market Size and Forecast (US$ Mn), 2014-2026
10.4.3. Rest of MEA Market Size and Forecast (US$ Mn), 2014-2026
10.5. Revenue (US$ Mn) Comparison, By Control Scheme
10.6. Revenue (US$ Mn) Comparison, By Flexibility Type
10.7. Revenue (US$ Mn) Comparison, By Application
11. Global Flexible OLED Display Market Company Share, Competition Landscape and Company Profiles
11.1. Company Share Analysis
11.2. Competition Landscape
11.3. Company Profiles
11.3.1. LG Display
11.3.2. Samsung Display
11.3.3. AU Optronics
11.3.4. BOE Technology
11.3.5. CSOT
11.3.6. EverDisplay Optronics (EDO)
11.3.7. Japan Display
11.3.8. RiTdisplay
11.3.9. Universal Display
11.3.10. Visionox
12. Research Methodology
13. Disclaimer
List of Tables
TABLE 1 Global Flexible OLED Display Market Value (US$ Mn), 2014-2017
TABLE 2 Global Flexible OLED Display Market Value (US$ Mn), 2018-2026
TABLE 3 Global Flexible OLED Display Market Value (US$ Mn) and Y-o-Y, 2017-2026
TABLE 4 Global PMOLED Segment Value (US$ Mn), By Region 2014-2017
TABLE 5 Global PMOLED Segment Value (US$ Mn), By Region 2018-2026
TABLE 6 Global PMOLED Segment Market Share, By Region 2014-2017
TABLE 7 Global PMOLED Segment Market Share, By Region 2018-2026
TABLE 8 Global PMOLED Segment Y-o-Y, By Region 2017-2026
TABLE 9 Global AMOLED Segment Value (US$ Mn), By Region 2014-2017
TABLE 10 Global AMOLED Segment Value (US$ Mn), By Region 2018-2026
TABLE 11 Global AMOLED Segment Market Share, By Region 2014-2017
TABLE 12 Global AMOLED Segment Market Share, By Region 2018-2026
TABLE 13 Global AMOLED Segment Y-o-Y, By Region 2017-2026
TABLE 14 Global Curved Display Segment Value (US$ Mn), By Region 2014-2017
TABLE 15 Global Curved Display Segment Value (US$ Mn), By Region 2018-2026
TABLE 16 Global Curved Display Segment Market Share, By Region 2014-2017
TABLE 17 Global Curved Display Segment Market Share, By Region 2018-2026
TABLE 18 Global Curved Display Segment Y-o-Y, By Region 2017-2026
TABLE 19 Global Foldable Display Segment Value (US$ Mn), By Region 2014-2017
TABLE 20 Global Foldable Display Segment Value (US$ Mn), By Region 2018-2026
TABLE 21 Global Foldable Display Segment Market Share, By Region 2014-2017
TABLE 22 Global Foldable Display Segment Market Share, By Region 2018-2026
TABLE 23 Global Foldable Display Segment Y-o-Y, By Region 2017-2026
TABLE 24 Global Lighting Segment Value (US$ Mn), By Region 2014-2017
TABLE 25 Global Lighting Segment Value (US$ Mn), By Region 2018-2026
TABLE 26 Global Lighting Segment Market Share, By Region 2014-2017
TABLE 27 Global Lighting Segment Market Share, By Region 2018-2026
TABLE 28 Global Lighting Segment Y-o-Y, By Region 2017-2026
TABLE 29 Global Smart Phones Segment Value (US$ Mn), By Region 2014-2017
TABLE 30 Global Smart Phones Segment Value (US$ Mn), By Region 2018-2026
TABLE 31 Global Smart Phones Segment Market Share, By Region 2014-2017
TABLE 32 Global Smart Phones Segment Market Share, By Region 2018-2026
TABLE 33 Global Smart Phones Segment Y-o-Y, By Region 2017-2026
TABLE 34 Global Television Segment Value (US$ Mn), By Region 2014-2017
TABLE 35 Global Television Segment Value (US$ Mn), By Region 2018-2026
TABLE 36 Global Television Segment Market Share, By Region 2014-2017
TABLE 37 Global Television Segment Market Share, By Region 2018-2026
TABLE 38 Global Television Segment Y-o-Y, By Region 2017-2026
TABLE 39 Global Monitor Segment Value (US$ Mn), By Region 2014-2017
TABLE 40 Global Monitor Segment Value (US$ Mn), By Region 2018-2026
TABLE 41 Global Monitor Segment Market Share, By Region 2014-2017
TABLE 42 Global Monitor Segment Market Share, By Region 2018-2026
TABLE 43 Global Monitor Segment Y-o-Y, By Region 2017-2026
TABLE 44 Global Wearables Segment Value (US$ Mn), By Region 2014-2017
TABLE 45 Global Wearables Segment Value (US$ Mn), By Region 2018-2026
TABLE 46 Global Wearables Segment Market Share, By Region 2014-2017
TABLE 47 Global Wearables Segment Market Share, By Region 2018-2026
TABLE 48 Global Wearables Segment Y-o-Y, By Region 2017-2026
TABLE 49 Global Others Segment Value (US$ Mn), By Region 2014-2017
TABLE 50 Global Others Segment Value (US$ Mn), By Region 2018-2026
TABLE 51 Global Others Segment Market Share, By Region 2014-2017
TABLE 52 Global Others Segment Market Share, By Region 2018-2026
TABLE 53 Global Others Segment Y-o-Y, By Region 2017-2026
TABLE 54 North America Flexible OLED Display Market Value (US$ Mn), By Country 2014-2017
TABLE 55 North America Flexible OLED Display Market Value (US$ Mn), By Country 2018-2026
TABLE 56 North America Flexible OLED Display Market Value (US$ Mn), By Control Scheme 2014-2017
TABLE 57 North America Flexible OLED Display Market Value (US$ Mn), By Control Scheme 2018-2026
TABLE 58 North America Flexible OLED Display Market Value (US$ Mn), By Flexibility Type 2014-2017
TABLE 59 North America Flexible OLED Display Market Value (US$ Mn), By Flexibility Type 2018-2026
TABLE 60 North America Flexible OLED Display Market Value (US$ Mn), By Application 2014-2017
TABLE 61 North America Flexible OLED Display Market Value (US$ Mn), By Application 2018-2026
TABLE 62 Latin America Flexible OLED Display Market Value (US$ Mn), By Country 2014-2017
TABLE 63 Latin America Flexible OLED Display Market Value (US$ Mn), By Country 2018-2026
TABLE 64 Latin America Flexible OLED Display Market Value (US$ Mn), By Control Scheme 2014-2017
TABLE 65 Latin America Flexible OLED Display Market Value (US$ Mn), By Control Scheme 2018-2026
TABLE 66 Latin America Flexible OLED Display Market Value (US$ Mn), By Flexibility Type 2014-2017
TABLE 67 Latin America Flexible OLED Display Market Value (US$ Mn), By Flexibility Type 2018-2026
TABLE 68 Latin America Flexible OLED Display Market Value (US$ Mn), By Application 2014-2017
TABLE 69 Latin America Flexible OLED Display Market Value (US$ Mn), By Application 2018-2026
TABLE 70 Europe Flexible OLED Display Market Value (US$ Mn), By Country 2014-2017
TABLE 71 Europe Flexible OLED Display Market Value (US$ Mn), By Country 2018-2026
TABLE 72 Europe Flexible OLED Display Market Value (US$ Mn), By Control Scheme 2014-2017
TABLE 73 Europe Flexible OLED Display Market Value (US$ Mn), By Control Scheme 2018-2026
TABLE 74 Europe Flexible OLED Display Market Value (US$ Mn), By Flexibility Type 2014-2017
TABLE 75 Europe Flexible OLED Display Market Value (US$ Mn), By Flexibility Type 2018-2026
TABLE 76 Europe Flexible OLED Display Market Value (US$ Mn), By Application 2014-2017
TABLE 77 Europe Flexible OLED Display Market Value (US$ Mn), By Application 2018-2026
TABLE 78 Japan Flexible OLED Display Market Value (US$ Mn), By Country 2014-2017
TABLE 79 Japan Flexible OLED Display Market Value (US$ Mn), By Country 2018-2026
TABLE 80 Japan Flexible OLED Display Market Value (US$ Mn), By Control Scheme 2014-2017
TABLE 81 Japan Flexible OLED Display Market Value (US$ Mn), By Control Scheme 2018-2026
TABLE 82 Japan Flexible OLED Display Market Value (US$ Mn), By Flexibility Type 2014-2017
TABLE 83 Japan Flexible OLED Display Market Value (US$ Mn), By Flexibility Type 2018-2026
TABLE 84 Japan Flexible OLED Display Market Value (US$ Mn), By Application 2014-2017
TABLE 85 Japan Flexible OLED Display Market Value (US$ Mn), By Application 2018-2026
TABLE 86 APEJ Flexible OLED Display Market Value (US$ Mn), By Country 2014-2017
TABLE 87 APEJ Flexible OLED Display Market Value (US$ Mn), By Country 2018-2026
TABLE 88 APEJ Flexible OLED Display Market Value (US$ Mn), By Control Scheme 2014-2017
TABLE 89 APEJ Flexible OLED Display Market Value (US$ Mn), By Control Scheme 2018-2026
TABLE 90 APEJ Flexible OLED Display Market Value (US$ Mn), By Flexibility Type 2014-2017
TABLE 91 APEJ Flexible OLED Display Market Value (US$ Mn), By Flexibility Type 2018-2026
TABLE 92 APEJ Flexible OLED Display Market Value (US$ Mn), By Application 2014-2017
TABLE 93 APEJ Flexible OLED Display Market Value (US$ Mn), By Application 2018-2026
TABLE 94 MEA Flexible OLED Display Market Value (US$ Mn), By Country 2014-2017
TABLE 95 MEA Flexible OLED Display Market Value (US$ Mn), By Country 2018-2026
TABLE 96 MEA Flexible OLED Display Market Value (US$ Mn), By Control Scheme 2014-2017
TABLE 97 MEA Flexible OLED Display Market Value (US$ Mn), By Control Scheme 2018-2026
TABLE 98 MEA Flexible OLED Display Market Value (US$ Mn), By Flexibility Type 2014-2017
TABLE 99 MEA Flexible OLED Display Market Value (US$ Mn), By Flexibility Type 2018-2026
TABLE 100 MEA Flexible OLED Display Market Value (US$ Mn), By Application 2014-2017
TABLE 101 MEA Flexible OLED Display Market Value (US$ Mn), By Application 2018-2026
List of Figures
FIG. 1 Global Flexible OLED Display Market Value (US$ Mn), 2014-2017
FIG. 2 Global Flexible OLED Display Market Value (US$ Mn) Forecast, 2018-2026
FIG. 3 Global Flexible OLED Display Market Value (US$ Mn) and Y-o-Y, 2017-2026
FIG. 4 Global PMOLED Segment Market Value (US$ Mn) By Region, 2014-2017
FIG. 5 Global PMOLED Segment Market Value (US$ Mn) By Region, 2018-2026
FIG. 6 Global PMOLED Segment Y-o-Y Growth Rate, By Region, 2017-2026
FIG. 7 Global AMOLED Segment Market Value (US$ Mn) By Region, 2014-2017
FIG. 8 Global AMOLED Segment Market Value (US$ Mn) By Region, 2018-2026
FIG. 9 Global AMOLED Segment Y-o-Y Growth Rate, By Region, 2017-2026
FIG. 10 Global Curved Display Segment Market Value (US$ Mn) By Region, 2014-2017
FIG. 11 Global Curved Display Segment Market Value (US$ Mn) By Region, 2018-2026
FIG. 12 Global Curved Display Segment Y-o-Y Growth Rate, By Region, 2017-2026
FIG. 13 Global Foldable Display Segment Market Value (US$ Mn) By Region, 2014-2017
FIG. 14 Global Foldable Display Segment Market Value (US$ Mn) By Region, 2018-2026
FIG. 15 Global Foldable Display Segment Y-o-Y Growth Rate, By Region, 2017-2026
FIG. 16 Global Lighting Segment Market Value (US$ Mn) By Region, 2014-2017
FIG. 17 Global Lighting Segment Market Value (US$ Mn) By Region, 2018-2026
FIG. 18 Global Lighting Segment Y-o-Y Growth Rate, By Region, 2017-2026
FIG. 19 Global Smart Phones Segment Market Value (US$ Mn) By Region, 2014-2017
FIG. 20 Global Smart Phones Segment Market Value (US$ Mn) By Region, 2018-2026
FIG. 21 Global Smart Phones Segment Y-o-Y Growth Rate, By Region, 2017-2026
FIG. 22 Global Television Segment Market Value (US$ Mn) By Region, 2014-2017
FIG. 23 Global Television Segment Market Value (US$ Mn) By Region, 2018-2026
FIG. 24 Global Television Segment Y-o-Y Growth Rate, By Region, 2017-2026
FIG. 25 Global Monitor Segment Market Value (US$ Mn) By Region, 2014-2017
FIG. 26 Global Monitor Segment Market Value (US$ Mn) By Region, 2018-2026
FIG. 27 Global Monitor Segment Y-o-Y Growth Rate, By Region, 2017-2026
FIG. 28 Global Wearables Segment Market Value (US$ Mn) By Region, 2014-2017
FIG. 29 Global Wearables Segment Market Value (US$ Mn) By Region, 2018-2026
FIG. 30 Global Wearables Segment Y-o-Y Growth Rate, By Region, 2017-2026
FIG. 31 Global Others Segment Market Value (US$ Mn) By Region, 2014-2017
FIG. 32 Global Others Segment Market Value (US$ Mn) By Region, 2018-2026
FIG. 33 Global Others Segment Y-o-Y Growth Rate, By Region, 2017-2026
FIG. 34 North America Flexible OLED Display Market Value (US$ Mn), By Country 2014-2017
FIG. 35 North America Flexible OLED Display Market Value (US$ Mn), By Country 2018-2026
FIG. 36 North America Flexible OLED Display Market Value (US$ Mn), By Control Scheme 2014-2017
FIG. 37 North America Flexible OLED Display Market Value (US$ Mn), By Control Scheme 2018-2026
FIG. 38 North America Flexible OLED Display Market Value (US$ Mn), By Flexibility Type 2014-2017
FIG. 39 North America Flexible OLED Display Market Value (US$ Mn), By Flexibility Type 2018-2026
FIG. 40 North America Flexible OLED Display Market Value (US$ Mn), By Application 2014-2017
FIG. 41 North America Flexible OLED Display Market Value (US$ Mn), By Application 2018-2026
FIG. 42 Latin America Flexible OLED Display Market Value (US$ Mn), By Country 2014-2017
FIG. 43 Latin America Flexible OLED Display Market Value (US$ Mn), By Country 2018-2026
FIG. 44 Latin America Flexible OLED Display Market Value (US$ Mn), By Control Scheme 2014-2017
FIG. 45 Latin America Flexible OLED Display Market Value (US$ Mn), By Control Scheme 2018-2026
FIG. 46 Latin America Flexible OLED Display Market Value (US$ Mn), By Flexibility Type 2014-2017
FIG. 47 Latin America Flexible OLED Display Market Value (US$ Mn), By Flexibility Type 2018-2026
FIG. 48 Latin America Flexible OLED Display Market Value (US$ Mn), By Application 2014-2017
FIG. 49 Latin America Flexible OLED Display Market Value (US$ Mn), By Application 2018-2026
FIG. 50 Europe Flexible OLED Display Market Value (US$ Mn), By Country 2014-2017
FIG. 51 Europe Flexible OLED Display Market Value (US$ Mn), By Country 2018-2026
FIG. 52 Europe Flexible OLED Display Market Value (US$ Mn), By Control Scheme 2014-2017
FIG. 53 Europe Flexible OLED Display Market Value (US$ Mn), By Control Scheme 2018-2026
FIG. 54 Europe Flexible OLED Display Market Value (US$ Mn), By Flexibility Type 2014-2017
FIG. 55 Europe Flexible OLED Display Market Value (US$ Mn), By Flexibility Type 2018-2026
FIG. 56 Europe Flexible OLED Display Market Value (US$ Mn), By Application 2014-2017
FIG. 57 Europe Flexible OLED Display Market Value (US$ Mn), By Application 2018-2026
FIG. 58 Japan Flexible OLED Display Market Value (US$ Mn), By Country 2014-2017
FIG. 59 Japan Flexible OLED Display Market Value (US$ Mn), By Country 2018-2026
FIG. 60 Japan Flexible OLED Display Market Value (US$ Mn), By Control Scheme 2014-2017
FIG. 61 Japan Flexible OLED Display Market Value (US$ Mn), By Control Scheme 2018-2026
FIG. 62 Japan Flexible OLED Display Market Value (US$ Mn), By Application 2014-2017
FIG. 63 Japan Flexible OLED Display Market Value (US$ Mn), By Flexibility Type 2018-2026
FIG. 64 Japan Flexible OLED Display Market Value (US$ Mn), By Application 2014-2017
FIG. 65 Japan Flexible OLED Display Market Value (US$ Mn), By Application 2018-2026
FIG. 66 APEJ Flexible OLED Display Market Value (US$ Mn), By Country 2014-2017
FIG. 67 APEJ Flexible OLED Display Market Value (US$ Mn), By Country 2018-2026
FIG. 68 APEJ Flexible OLED Display Market Value (US$ Mn), By Control Scheme 2014-2017
FIG. 69 APEJ Flexible OLED Display Market Value (US$ Mn), By Control Scheme 2018-2026
FIG. 70 APEJ Flexible OLED Display Market Value (US$ Mn), By Flexibility Type 2014-2017
FIG. 71 APEJ Flexible OLED Display Market Value (US$ Mn), By Flexibility Type 2018-2026
FIG. 72 APEJ Flexible OLED Display Market Value (US$ Mn), By Application 2014-2017
FIG. 73 APEJ Flexible OLED Display Market Value (US$ Mn), By Application 2018-2026
FIG. 74 MEA Flexible OLED Display Market Value (US$ Mn), By Country 2014-2017
FIG. 75 MEA Flexible OLED Display Market Value (US$ Mn), By Country 2018-2026
FIG. 76 MEA Flexible OLED Display Market Value (US$ Mn), By Control Scheme 2014-2017
FIG. 77 MEA Flexible OLED Display Market Value (US$ Mn), By Control Scheme 2018-2026
FIG. 78 MEA Flexible OLED Display Market Value (US$ Mn), By Flexibility Type 2014-2017
FIG. 79 MEA Flexible OLED Display Market Value (US$ Mn), By Flexibility Type 2018-2026
FIG. 80 MEA Flexible OLED Display Market Value (US$ Mn), By Application 2014-2017
FIG. 81 MEA Flexible OLED Display Market Value (US$ Mn), By Application 2018-2026
Copyright © Transparency Market Research, Inc. All Rights reserved
Trust Online

Flexible OLED Display Market