
Reports
Reports
Global Eye Makeup Market: Snapshot
The rising concerns about appearance among millennial women and Generation Z women is a key growth driver of the global eye makeup market. Almost 70%-75% of women of this population group have high consideration for beauty in comparison to approximately 50%-55% women in the baby boomer generation. Also, this technology-savvy population make for a large audience of cosmetic products marketed through newer marketing channels such as YouTube and Instragram. As a result, this population account for large volume sales of color cosmetics through online shops and mail-orders which include eye makeup as well.
The introduction of new and innovative eye products that are suitable for modern lifestyle is also stoking growth of the eye makeup market. For instance, waterproof makeup that can withstand hot and humid weather conditions is gaining popularity among women involved in outdoor jobs befitting their lifestyle. In addition, smudge-free eye makeup is preferred by sportswomen who participate in swimming, athletics, and other humid outdoor sport.
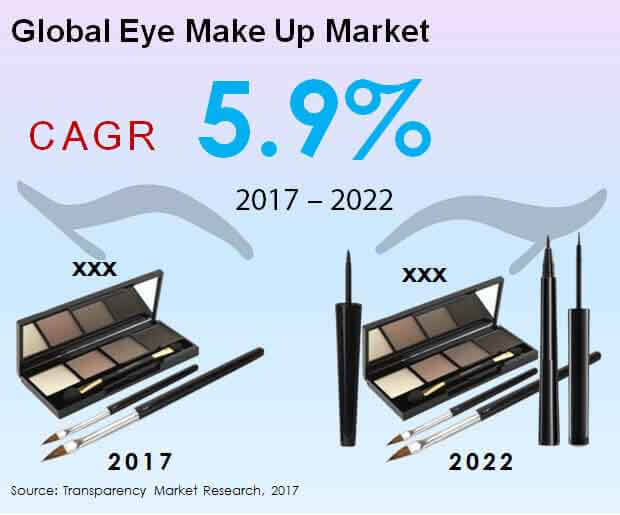
A report by Transparency Market Research (TMR), forecasts the global eye makeup market to be worth US$5,867.5 mn by the end of 2017. The market is estimated to be further reach a valuation of US$7,820.4 mn by the end of 2022 at a CAGR of 5.9% between 2017 and 2022.
Eye Liner to Remain Most Valued Product Segment
The worldwide market for eye makeup is broadly studied on the basis of type of product, sales channel, price, source, and region. Based on product type, the market is segmented into mascara, eye shadow, eye liner, eye pencil, eye brow, and other product types. Among the key product segments, eye liner segment holds dominance and is estimated to serve a demand to attract a revenue of US$1,514.2 mn by the end of 2017. This will amount the eye liner segment to represent 25.8% of the overall market in 2017. Expected to post a CAGR of 5.1% for the 2017-2022 forecast period, the eye liner segment will touch a valuation of US$1,946.3 mn by the end of 2022. The segment is expected to display a year-on-year growth of US$86.4 mn which is leading among all product segments.
On the basis of sales channel, the market is classified into supermarket, hypermarket, pharmacies, health & beauty retailer, e-commerce, and other sales channels. In terms of price, the worldwide market for eye market is divided into economic and premium. By source, the segments into which the global eye makeup market is divided are chemical, natural, organic, halal, and other sources.
Asia Pacific to Display Leading CAGR through 2022
North America, Latin America, Europe, Asia Pacific except Japan, the Middle East and Africa, and Japan are the key regional markets for eye makeup across the world. Among these, Asia Pacific except Japan has emerged as the most lucrative market for eye makeup. This is mainly because of recently acquired economic prosperity in emerging economies in the region. Consumers are spending liberally on beauty and cosmetic products that helps boost confidence, which translates into professional growth.
North America is a key market for eye makeup on account of substantial spending on health and beauty products. Consumers in the region give high importance to beauty and aesthetics among social and professional relationships. The region is expected to register 5.3% CAGR between 2017 and 2022 for the market to be evaluated at US$1,361.0 mn in 2017 and further reach US$1,761.4 mn by the end of 2022.
The global eye makeup market is largely consolidated with the dominance of a few large players. Key players in the global eye makeup market profiled in this report include L’Oreal, Estee Lauder, P&G (CoverGirl), Shiseido, Avon, Revlon, Chanel, LVMH, HUL, and Colorbar Cosmetics Private Limited.
Eye Makeup Market to Witness Notable Growth Owing to Rising Beauty Standards
The rising about appearance among millennial ladies and Generation Z ladies is a key development driver of the worldwide eye cosmetics market. Practically 70%-75% of ladies of this populace bunch have high thought for excellence in contrast with roughly half 55% ladies in the child of post war America age. Likewise, these innovation smart populaces make for an enormous crowd of restorative items promoted through fresher advertising channels, for example, YouTube and Instragram. Accordingly, this populace represents huge volume deals of shading beauty care products through online shops and mail-orders which incorporate eye cosmetics also.
In terms of segmentation by key product segment, the market for eye makeup is dominated by the eye liner section on account of the rising beauty trends, and introduction of various colors and variants. The presentation of new eye items that are reasonable for current way of life is likewise stirring up development of the eye cosmetics market. For instance, waterproof cosmetics that can withstand blistering and damp climate conditions is picking up fame among ladies associated with outside positions befitting their way of life. Moreover, smirch free eye cosmetics is favored by sportswomen who take an interest in swimming, games, and other sticky open air sport.
The overall pandemic of the novel Covid lightly affected the eye cosmetics market. Significant clinical examination organizations were charmed in the advancement of antivirus to battle the COVID-19 pandemic. The inconvenience of lockdown brought about impermanent end for occasions and shows, in this way affecting the excellence and cosmetics industry in general. Be that as it may, home-set patterns is as yet on a flood, demonstrating enormous extent of development for both the market and its players. Some of the players functioning in the global eye makeup market include Revlon, Colorbar Cosmetics Provate Limited, HUL, Avon, Oriflame, Estee Lauder, Loreal, Shiseido, and others.
1. Global Eye Make Up Market - Executive Summary
2. Global Eye Make Up Market Overview
2.1. Introduction
2.1.1. Global Eye Make Up Market Taxonomy
2.1.2. Global Eye Make Up Market Definition
2.2. Global Eye Make Up Market Size (US$ Mn) and Forecast, 2012-2022
2.2.1. Global Eye Make Up Market Y-o-Y Growth
2.3. Global Eye Make Up Market Dynamics
2.4. Regulations
2.5. Cost Structure
2.6. Pricing Analysis
2.7. Product Innovations
2.8. List of Distributors
2.9. Key Participants in the Market
3. Global Eye Make Up Market Analysis and Forecast By Product Type
3.1. Global Eye Make Up Market Size and Forecast By Product Type, 2012-2022
3.1.1. Mascara Market Size and Forecast, 2012-2022
3.1.1.1. Revenue (US$ Mn) Comparison, By Region
3.1.1.2. Market Share Comparison, By Region
3.1.1.3. Y-o-Y growth Comparison, By Region
3.1.2. Eye Shadow Market Size and Forecast, 2012-2022
3.1.2.1. Revenue (US$ Mn) Comparison, By Region
3.1.2.2. Market Share Comparison, By Region
3.1.2.3. Y-o-Y growth Comparison, By Region
3.1.3. Eye Liner Market Size and Forecast, 2012-2022
3.1.3.1. Revenue (US$ Mn) Comparison, By Region
3.1.3.2. Market Share Comparison, By Region
3.1.3.3. Y-o-Y growth Comparison, By Region
3.1.4. Eye Pencil Market Size and Forecast, 2012-2022
3.1.4.1. Revenue (US$ Mn) Comparison, By Region
3.1.4.2. Market Share Comparison, By Region
3.1.4.3. Y-o-Y growth Comparison, By Region
3.1.5. Eye Brow Market Size and Forecast, 2012-2022
3.1.5.1. Revenue (US$ Mn) Comparison, By Region
3.1.5.2. Market Share Comparison, By Region
3.1.5.3. Y-o-Y growth Comparison, By Region
3.1.6. Other Product Types Market Size and Forecast, 2012-2022
3.1.6.1. Revenue (US$ Mn) Comparison, By Region
3.1.6.2. Market Share Comparison, By Region
3.1.6.3. Y-o-Y growth Comparison, By Region
4. Global Eye Make Up Market Analysis and Forecast By Sales Channel
4.1. Global Eye Make Up Market Size and Forecast By Sales Channel, 2012-2022
4.1.1. Supermarket Market Size and Forecast, 2012-2022
4.1.1.1. Revenue (US$ Mn) Comparison, By Region
4.1.1.2. Market Share Comparison, By Region
4.1.1.3. Y-o-Y growth Comparison, By Region
4.1.2. Hypermarket Market Size and Forecast, 2012-2022
4.1.2.1. Revenue (US$ Mn) Comparison, By Region
4.1.2.2. Market Share Comparison, By Region
4.1.2.3. Y-o-Y growth Comparison, By Region
4.1.3. Pharmacies Market Size and Forecast, 2012-2022
4.1.3.1. Revenue (US$ Mn) Comparison, By Region
4.1.3.2. Market Share Comparison, By Region
4.1.3.3. Y-o-Y growth Comparison, By Region
4.1.4. Health & Beauty Retailer Market Size and Forecast, 2012-2022
4.1.4.1. Revenue (US$ Mn) Comparison, By Region
4.1.4.2. Market Share Comparison, By Region
4.1.4.3. Y-o-Y growth Comparison, By Region
4.1.5. E-commerce Market Size and Forecast, 2012-2022
4.1.5.1. Revenue (US$ Mn) Comparison, By Region
4.1.5.2. Market Share Comparison, By Region
4.1.5.3. Y-o-Y growth Comparison, By Region
4.1.6. Other Sales Channels Market Size and Forecast, 2012-2022
4.1.6.1. Revenue (US$ Mn) Comparison, By Region
4.1.6.2. Market Share Comparison, By Region
4.1.6.3. Y-o-Y growth Comparison, By Region
5. Global Eye Make Up Market Analysis and Forecast By Price
5.1. Global Eye Make Up Market Size and Forecast By Price, 2012-2022
5.1.1. Economic Market Size and Forecast, 2012-2022
5.1.1.1. Revenue (US$ Mn) Comparison, By Region
5.1.1.2. Market Share Comparison, By Region
5.1.1.3. Y-o-Y growth Comparison, By Region
5.1.2. Premium Market Size and Forecast, 2012-2022
5.1.2.1. Revenue (US$ Mn) Comparison, By Region
5.1.2.2. Market Share Comparison, By Region
5.1.2.3. Y-o-Y growth Comparison, By Region
6. Global Eye Make Up Market Analysis and Forecast By Source
6.1. Global Eye Make Up Market Size and Forecast By Source, 2012-2022
6.1.1. Chemical Market Size and Forecast, 2012-2022
6.1.1.1. Revenue (US$ Mn) Comparison, By Region
6.1.1.2. Market Share Comparison, By Region
6.1.1.3. Y-o-Y growth Comparison, By Region
6.1.2. Natural Market Size and Forecast, 2012-2022
6.1.2.1. Revenue (US$ Mn) Comparison, By Region
6.1.2.2. Market Share Comparison, By Region
6.1.2.3. Y-o-Y growth Comparison, By Region
6.1.3. Organic Market Size and Forecast, 2012-2022
6.1.3.1. Revenue (US$ Mn) Comparison, By Region
6.1.3.2. Market Share Comparison, By Region
6.1.3.3. Y-o-Y growth Comparison, By Region
6.1.4. Halal Market Size and Forecast, 2012-2022
6.1.4.1. Revenue (US$ Mn) Comparison, By Region
6.1.4.2. Market Share Comparison, By Region
6.1.4.3. Y-o-Y growth Comparison, By Region
6.1.5. Other Sources Market Size and Forecast, 2012-2022
6.1.5.1. Revenue (US$ Mn) Comparison, By Region
6.1.5.2. Market Share Comparison, By Region
6.1.5.3. Y-o-Y growth Comparison, By Region
7. Global Eye Make Up Market Analysis and Forecast By Region
7.1. Global Eye Make Up Market Size and Forecast, 2012-2022
7.1.1. North America Eye Make Up Market Size and Forecast, 2012-2022
7.1.1.1. Revenue (US$ Mn) Comparison, By Product Type
7.1.1.2. Revenue (US$ Mn) Comparison, By Sales Channel
7.1.1.3. Revenue (US$ Mn) Comparison, By Price
7.1.1.4. Revenue (US$ Mn) Comparison, By Source
7.1.2. Latin America Eye Make Up Market Size and Forecast, 2012-2022
7.1.2.1. Revenue (US$ Mn) Comparison, By Product Type
7.1.2.2. Revenue (US$ Mn) Comparison, By Sales Channel
7.1.2.3. Revenue (US$ Mn) Comparison, By Price
7.1.2.4. Revenue (US$ Mn) Comparison, By Source
7.1.3. Europe Eye Make Up Market Size and Forecast, 2012-2022
7.1.3.1. Revenue (US$ Mn) Comparison, By Product Type
7.1.3.2. Revenue (US$ Mn) Comparison, By Sales Channel
7.1.3.3. Revenue (US$ Mn) Comparison, By Price
7.1.3.4. Revenue (US$ Mn) Comparison, By Source
7.1.4. Japan Eye Make Up Market Size and Forecast, 2012-2022
7.1.4.1. Revenue (US$ Mn) Comparison, By Product Type
7.1.4.2. Revenue (US$ Mn) Comparison, By Sales Channel
7.1.4.3. Revenue (US$ Mn) Comparison, By Price
7.1.4.4. Revenue (US$ Mn) Comparison, By Source
7.1.5. APEJ Eye Make Up Market Size and Forecast, 2012-2022
7.1.5.1. Revenue (US$ Mn) Comparison, By Product Type
7.1.5.2. Revenue (US$ Mn) Comparison, By Sales Channel
7.1.5.3. Revenue (US$ Mn) Comparison, By Price
7.1.5.4. Revenue (US$ Mn) Comparison, By Source
7.1.6. MEA Eye Make Up Market Size and Forecast, 2012-2022
7.1.6.1. Revenue (US$ Mn) Comparison, By Product Type
7.1.6.2. Revenue (US$ Mn) Comparison, By Sales Channel
7.1.6.3. Revenue (US$ Mn) Comparison, By Price
7.1.6.4. Revenue (US$ Mn) Comparison, By Source
8. North America Eye Make Up Market Analysis and Forecast, By Country, 2012-2022
8.1. US Eye Make Up Market Size and Forecast, 2012-2022
8.1.1. Revenue (US$ Mn) Comparison, By Product Type
8.1.2. Revenue (US$ Mn) Comparison, By Sales Channel
8.1.3. Revenue (US$ Mn) Comparison, By Price
8.1.4. Revenue (US$ Mn) Comparison, By Source
8.2. Canada Eye Make Up Market Size and Forecast, 2012-2022
8.2.1. Revenue (US$ Mn) Comparison, By Product Type
8.2.2. Revenue (US$ Mn) Comparison, By Sales Channel
8.2.3. Revenue (US$ Mn) Comparison, By Price
8.2.4. Revenue (US$ Mn) Comparison, By Source
9. Latin America Eye Make Up Market Analysis and Forecast, By Country, 2012-2022
9.1. Brazil Eye Make Up Market Size and Forecast, 2012-2022
9.1.1. Revenue (US$ Mn) Comparison, By Product Type
9.1.2. Revenue (US$ Mn) Comparison, By Sales Channel
9.1.3. Revenue (US$ Mn) Comparison, By Price
9.1.4. Revenue (US$ Mn) Comparison, By Source
9.2. Mexico Eye Make Up Market Size and Forecast, 2012-2022
9.2.1. Revenue (US$ Mn) Comparison, By Product Type
9.2.2. Revenue (US$ Mn) Comparison, By Sales Channel
9.2.3. Revenue (US$ Mn) Comparison, By Price
9.2.4. Revenue (US$ Mn) Comparison, By Source
9.3. Argentina Eye Make Up Market Size and Forecast, 2012-2022
9.3.1. Revenue (US$ Mn) Comparison, By Product Type
9.3.2. Revenue (US$ Mn) Comparison, By Sales Channel
9.3.3. Revenue (US$ Mn) Comparison, By Price
9.3.4. Revenue (US$ Mn) Comparison, By Source
10. Europe Eye Make Up Market Analysis and Forecast, By Country, 2012-2022
10.1. Germany Eye Make Up Market Size and Forecast, 2012-2022
10.1.1. Revenue (US$ Mn) Comparison, By Product Type
10.1.2. Revenue (US$ Mn) Comparison, By Sales Channel
10.1.3. Revenue (US$ Mn) Comparison, By Price
10.1.4. Revenue (US$ Mn) Comparison, By Source
10.2. UK Eye Make Up Market Size and Forecast, 2012-2022
10.2.1. Revenue (US$ Mn) Comparison, By Product Type
10.2.2. Revenue (US$ Mn) Comparison, By Sales Channel
10.2.3. Revenue (US$ Mn) Comparison, By Price
10.2.4. Revenue (US$ Mn) Comparison, By Source
10.3. France Eye Make Up Market Size and Forecast, 2012-2022
10.3.1. Revenue (US$ Mn) Comparison, By Product Type
10.3.2. Revenue (US$ Mn) Comparison, By Sales Channel
10.3.3. Revenue (US$ Mn) Comparison, By Price
10.3.4. Revenue (US$ Mn) Comparison, By Source
10.4. Spain Eye Make Up Market Size and Forecast, 2012-2022
10.4.1. Revenue (US$ Mn) Comparison, By Product Type
10.4.2. Revenue (US$ Mn) Comparison, By Sales Channel
10.4.3. Revenue (US$ Mn) Comparison, By Price
10.4.4. Revenue (US$ Mn) Comparison, By Source
10.5. Italy Eye Make Up Market Size and Forecast, 2012-2022
10.5.1. Revenue (US$ Mn) Comparison, By Product Type
10.5.2. Revenue (US$ Mn) Comparison, By Sales Channel
10.5.3. Revenue (US$ Mn) Comparison, By Price
10.5.4. Revenue (US$ Mn) Comparison, By Source
10.6. Nordic Eye Make Up Market Size and Forecast, 2012-2022
10.6.1. Revenue (US$ Mn) Comparison, By Product Type
10.6.2. Revenue (US$ Mn) Comparison, By Sales Channel
10.6.3. Revenue (US$ Mn) Comparison, By Price
10.6.4. Revenue (US$ Mn) Comparison, By Source
11. Japan Eye Make Up Market Analysis and Forecast, By Country, 2012-2022
11.1. Japan Eye Make Up Market Size and Forecast, 2012-2022
11.1.1. Revenue (US$ Mn) Comparison, By Product Type
11.1.2. Revenue (US$ Mn) Comparison, By Sales Channel
11.1.3. Revenue (US$ Mn) Comparison, By Price
11.1.4. Revenue (US$ Mn) Comparison, By Source
12. APEJ Eye Make Up Market Analysis and Forecast, By Country, 2012-2022
12.1. China Eye Make Up Market Size and Forecast, 2012-2022
12.1.1. Revenue (US$ Mn) Comparison, By Product Type
12.1.2. Revenue (US$ Mn) Comparison, By Sales Channel
12.1.3. Revenue (US$ Mn) Comparison, By Price
12.1.4. Revenue (US$ Mn) Comparison, By Source
12.2. India Eye Make Up Market Size and Forecast, 2012-2022
12.2.1. Revenue (US$ Mn) Comparison, By Product Type
12.2.2. Revenue (US$ Mn) Comparison, By Sales Channel
12.2.3. Revenue (US$ Mn) Comparison, By Price
12.2.4. Revenue (US$ Mn) Comparison, By Source
12.3. Malaysia Eye Make Up Market Size and Forecast, 2012-2022
12.3.1. Revenue (US$ Mn) Comparison, By Product Type
12.3.2. Revenue (US$ Mn) Comparison, By Sales Channel
12.3.3. Revenue (US$ Mn) Comparison, By Price
12.3.4. Revenue (US$ Mn) Comparison, By Source
12.4. Thailand Eye Make Up Market Size and Forecast, 2012-2022
12.4.1. Revenue (US$ Mn) Comparison, By Product Type
12.4.2. Revenue (US$ Mn) Comparison, By Sales Channel
12.4.3. Revenue (US$ Mn) Comparison, By Price
12.4.4. Revenue (US$ Mn) Comparison, By Source
12.5. Singapore Eye Make Up Market Size and Forecast, 2012-2022
12.5.1. Revenue (US$ Mn) Comparison, By Product Type
12.5.2. Revenue (US$ Mn) Comparison, By Sales Channel
12.5.3. Revenue (US$ Mn) Comparison, By Price
12.5.4. Revenue (US$ Mn) Comparison, By Source
12.6. Australia Eye Make Up Market Size and Forecast, 2012-2022
12.6.1. Revenue (US$ Mn) Comparison, By Product Type
12.6.2. Revenue (US$ Mn) Comparison, By Sales Channel
12.6.3. Revenue (US$ Mn) Comparison, By Price
12.6.4. Revenue (US$ Mn) Comparison, By Source
13. MEA Eye Make Up Market Analysis and Forecast, By Country, 2012-2022
13.1. GCC Countries Eye Make Up Market Size and Forecast, 2012-2022
13.1.1. Revenue (US$ Mn) Comparison, By Product Type
13.1.2. Revenue (US$ Mn) Comparison, By Sales Channel
13.1.3. Revenue (US$ Mn) Comparison, By Price
13.1.4. Revenue (US$ Mn) Comparison, By Source
13.2. South Africa Eye Make Up Market Size and Forecast, 2012-2022
13.2.1. Revenue (US$ Mn) Comparison, By Product Type
13.2.2. Revenue (US$ Mn) Comparison, By Sales Channel
13.2.3. Revenue (US$ Mn) Comparison, By Price
13.2.4. Revenue (US$ Mn) Comparison, By Source
13.3. Nigeria Eye Make Up Market Size and Forecast, 2012-2022
13.3.1. Revenue (US$ Mn) Comparison, By Product Type
13.3.2. Revenue (US$ Mn) Comparison, By Sales Channel
13.3.3. Revenue (US$ Mn) Comparison, By Price
13.3.4. Revenue (US$ Mn) Comparison, By Source
13.4. Israel Eye Make Up Market Size and Forecast, 2012-2022
13.4.1. Revenue (US$ Mn) Comparison, By Product Type
13.4.2. Revenue (US$ Mn) Comparison, By Sales Channel
13.4.3. Revenue (US$ Mn) Comparison, By Price
13.4.4. Revenue (US$ Mn) Comparison, By Source
14. Global Eye Make Up Market Company Share, Competition Landscape and Company Profiles
14.1. Company Share Analysis
14.2. Competition Landscape
14.3. Company Profiles
14.3.1. L’Oréal
14.3.2. Estee Lauder
14.3.3. P&G (CoverGirl)
14.3.4. Shiseido
14.3.5. Avon
14.3.6. Revlon
14.3.7. Chanel
14.3.8. LVMH
14.3.9. HUL (Lakme)
14.3.10. Colorbar Cosmetics Private Limited
15. Research Methodology
16. Secondary and Primary Sources
17. Assumptions and Acronyms
18. Disclaimer
List of Tables
TABLE 1 Global Eye Make Up Market Value (US$ Mn), 2012-2016
TABLE 2 Global Eye Make Up Market Value (US$ Mn), 2017-2022
TABLE 3 Global Eye Make Up Market Value (US$ Mn) and Y-o-Y, 2015-2022
TABLE 4 Global Mascara Segment Value (US$ Mn), By Region 2012-2016
TABLE 5 Global Mascara Segment Value (US$ Mn), By Region 2017-2022
TABLE 6 Global Mascara Segment Market Share, By Region 2012-2016
TABLE 7 Global Mascara Segment Market Share, By Region 2017-2022
TABLE 8 Global Mascara Segment Y-o-Y, By Region 2015-2022
TABLE 9 Global Eye Shadow Segment Value (US$ Mn), By Region 2012-2016
TABLE 10 Global Eye Shadow Segment Value (US$ Mn), By Region 2017-2022
TABLE 11 Global Eye Shadow Segment Market Share, By Region 2012-2016
TABLE 12 Global Eye Shadow Segment Market Share, By Region 2017-2022
TABLE 13 Global Eye Shadow Segment Y-o-Y, By Region 2015-2022
TABLE 14 Global Eye Liner Segment Value (US$ Mn), By Region 2012-2016
TABLE 15 Global Eye Liner Segment Value (US$ Mn), By Region 2017-2022
TABLE 16 Global Eye Liner Segment Market Share, By Region 2012-2016
TABLE 17 Global Eye Liner Segment Market Share, By Region 2017-2022
TABLE 18 Global Eye Liner Segment Y-o-Y, By Region 2015-2022
TABLE 19 Global Eye Pencil Segment Value (US$ Mn), By Region 2012-2016
TABLE 20 Global Eye Pencil Segment Value (US$ Mn), By Region 2017-2022
TABLE 21 Global Eye Pencil Segment Market Share, By Region 2012-2016
TABLE 22 Global Eye Pencil Segment Market Share, By Region 2017-2022
TABLE 23 Global Eye Pencil Segment Y-o-Y, By Region 2015-2022
TABLE 24 Global Eye Brow Segment Value (US$ Mn), By Region 2012-2016
TABLE 25 Global Eye Brow Segment Value (US$ Mn), By Region 2017-2022
TABLE 26 Global Eye Brow Segment Market Share, By Region 2012-2016
TABLE 27 Global Eye Brow Segment Market Share, By Region 2017-2022
TABLE 28 Global Eye Brow Segment Y-o-Y, By Region 2015-2022
TABLE 29 Global Other Product Types Segment Value (US$ Mn), By Region 2012-2016
TABLE 30 Global Other Product Types Segment Value (US$ Mn), By Region 2017-2022
TABLE 31 Global Other Product Types Segment Market Share, By Region 2012-2016
TABLE 32 Global Other Product Types Segment Market Share, By Region 2017-2022
TABLE 33 Global Other Product Types Segment Y-o-Y, By Region 2015-2022
TABLE 34 Global Supermarket Segment Value (US$ Mn), By Region 2012-2016
TABLE 35 Global Supermarket Segment Value (US$ Mn), By Region 2017-2022
TABLE 36 Global Supermarket Segment Market Share, By Region 2012-2016
TABLE 37 Global Supermarket Segment Market Share, By Region 2017-2022
TABLE 38 Global Supermarket Segment Y-o-Y, By Region 2015-2022
TABLE 39 Global Hypermarket Segment Value (US$ Mn), By Region 2012-2016
TABLE 40 Global Hypermarket Segment Value (US$ Mn), By Region 2017-2022
TABLE 41 Global Hypermarket Segment Market Share, By Region 2012-2016
TABLE 42 Global Hypermarket Segment Market Share, By Region 2017-2022
TABLE 43 Global Hypermarket Segment Y-o-Y, By Region 2015-2022
TABLE 44 Global Pharmacies Segment Value (US$ Mn), By Region 2012-2016
TABLE 45 Global Pharmacies Segment Value (US$ Mn), By Region 2017-2022
TABLE 46 Global Pharmacies Segment Market Share, By Region 2012-2016
TABLE 47 Global Pharmacies Segment Market Share, By Region 2017-2022
TABLE 48 Global Pharmacies Segment Y-o-Y, By Region 2015-2022
TABLE 49 Global Health & Beauty Retailer Segment Value (US$ Mn), By Region 2012-2016
TABLE 50 Global Health & Beauty Retailer Segment Value (US$ Mn), By Region 2017-2022
TABLE 51 Global Health & Beauty Retailer Segment Market Share, By Region 2012-2016
TABLE 52 Global Health & Beauty Retailer Segment Market Share, By Region 2017-2022
TABLE 53 Global Health & Beauty Retailer Segment Y-o-Y, By Region 2015-2022
TABLE 54 Global E-commerce Segment Value (US$ Mn), By Region 2012-2016
TABLE 55 Global E-commerce Segment Value (US$ Mn), By Region 2017-2022
TABLE 56 Global E-commerce Segment Market Share, By Region 2012-2016
TABLE 57 Global E-commerce Segment Market Share, By Region 2017-2022
TABLE 58 Global E-commerce Segment Y-o-Y, By Region 2015-2022
TABLE 59 Global Other Sales Channels Segment Value (US$ Mn), By Region 2012-2016
TABLE 60 Global Other Sales Channels Segment Value (US$ Mn), By Region 2017-2022
TABLE 61 Global Other Sales Channels Segment Market Share, By Region 2012-2016
TABLE 62 Global Other Sales Channels Segment Market Share, By Region 2017-2022
TABLE 63 Global Other Sales Channels Segment Y-o-Y, By Region 2015-2022
TABLE 64 Global Economic Segment Value (US$ Mn), By Region 2012-2016
TABLE 65 Global Economic Segment Value (US$ Mn), By Region 2017-2022
TABLE 66 Global Economic Segment Market Share, By Region 2012-2016
TABLE 67 Global Economic Segment Market Share, By Region 2017-2022
TABLE 68 Global Economic Segment Y-o-Y, By Region 2015-2022
TABLE 69 Global Premium Segment Value (US$ Mn), By Region 2012-2016
TABLE 70 Global Premium Segment Value (US$ Mn), By Region 2017-2022
TABLE 71 Global Premium Segment Market Share, By Region 2012-2016
TABLE 72 Global Premium Segment Market Share, By Region 2017-2022
TABLE 73 Global Premium Segment Y-o-Y, By Region 2015-2022
TABLE 74 Global Chemical Segment Value (US$ Mn), By Region 2012-2016
TABLE 75 Global Chemical Segment Value (US$ Mn), By Region 2017-2022
TABLE 76 Global Chemical Segment Market Share, By Region 2012-2016
TABLE 77 Global Chemical Segment Market Share, By Region 2017-2022
TABLE 78 Global Chemical Segment Y-o-Y, By Region 2015-2022
TABLE 79 Global Natural Segment Value (US$ Mn), By Region 2012-2016
TABLE 80 Global Natural Segment Value (US$ Mn), By Region 2017-2022
TABLE 81 Global Natural Segment Market Share, By Region 2012-2016
TABLE 82 Global Natural Segment Market Share, By Region 2017-2022
TABLE 83 Global Natural Segment Y-o-Y, By Region 2015-2022
TABLE 84 Global Organic Segment Value (US$ Mn), By Region 2012-2016
TABLE 85 Global Organic Segment Value (US$ Mn), By Region 2017-2022
TABLE 86 Global Organic Segment Market Share, By Region 2012-2016
TABLE 87 Global Organic Segment Market Share, By Region 2017-2022
TABLE 88 Global Organic Segment Y-o-Y, By Region 2015-2022
TABLE 89 Global Halal Segment Value (US$ Mn), By Region 2012-2016
TABLE 90 Global Halal Segment Value (US$ Mn), By Region 2017-2022
TABLE 91 Global Halal Segment Market Share, By Region 2012-2016
TABLE 92 Global Halal Segment Market Share, By Region 2017-2022
TABLE 93 Global Halal Segment Y-o-Y, By Region 2015-2022
TABLE 94 Global Other Sources Segment Value (US$ Mn), By Region 2012-2016
TABLE 95 Global Other Sources Segment Value (US$ Mn), By Region 2017-2022
TABLE 96 Global Other Sources Segment Market Share, By Region 2012-2016
TABLE 97 Global Other Sources Segment Market Share, By Region 2017-2022
TABLE 98 Global Other Sources Segment Y-o-Y, By Region 2015-2022
TABLE 99 North America Eye Make Up Market Value (US$ Mn), By Product Type 2012-2016
TABLE 100 North America Eye Make Up Market Value (US$ Mn), By Product Type 2017-2022
TABLE 101 North America Eye Make Up Market Value (US$ Mn), By Sales Channel2012-2016
TABLE 102 North America Eye Make Up Market Value (US$ Mn), By Sales Channel2017-2022
TABLE 103 North America Eye Make Up Market Value (US$ Mn), By Price 2012-2016
TABLE 104 North America Eye Make Up Market Value (US$ Mn), By Price 2017-2022
TABLE 105 North America Eye Make Up Market Value (US$ Mn), By Source 2012-2016
TABLE 106 North America Eye Make Up Market Value (US$ Mn), By Source 2017-2022
TABLE 107 Latin America Eye Make Up Market Value (US$ Mn), By Product Type 2012-2016
TABLE 108 Latin America Eye Make Up Market Value (US$ Mn), By Product Type 2017-2022
TABLE 109 Latin America Eye Make Up Market Value (US$ Mn), By Sales Channel2012-2016
TABLE 110 Latin America Eye Make Up Market Value (US$ Mn), By Sales Channel2017-2022
TABLE 111 Latin America Eye Make Up Market Value (US$ Mn), By Price 2012-2016
TABLE 112 Latin America Eye Make Up Market Value (US$ Mn), By Price 2017-2022
TABLE 113 Latin America Eye Make Up Market Value (US$ Mn), By Source 2012-2016
TABLE 114 Latin America Eye Make Up Market Value (US$ Mn), By Source 2017-2022
TABLE 115 Europe Eye Make Up Market Value (US$ Mn), By Product Type 2012-2016
TABLE 116 Europe Eye Make Up Market Value (US$ Mn), By Product Type 2017-2022
TABLE 117 Europe Eye Make Up Market Value (US$ Mn), By Sales Channel2012-2016
TABLE 118 Europe Eye Make Up Market Value (US$ Mn), By Sales Channel2017-2022
TABLE 119 Europe Eye Make Up Market Value (US$ Mn), By Price 2012-2016
TABLE 120 Europe Eye Make Up Market Value (US$ Mn), By Price 2017-2022
TABLE 121 Europe Eye Make Up Market Value (US$ Mn), By Source 2012-2016
TABLE 122 Europe Eye Make Up Market Value (US$ Mn), By Source 2017-2022
TABLE 123 Japan Eye Make Up Market Value (US$ Mn), By Product Type 2012-2016
TABLE 124 Japan Eye Make Up Market Value (US$ Mn), By Product Type 2017-2022
TABLE 125 Japan Eye Make Up Market Value (US$ Mn), By Sales Channel2012-2016
TABLE 126 Japan Eye Make Up Market Value (US$ Mn), By Sales Channel2017-2022
TABLE 127 Japan Eye Make Up Market Value (US$ Mn), By Price 2012-2016
TABLE 128 Japan Eye Make Up Market Value (US$ Mn), By Price 2017-2022
TABLE 129 Japan Eye Make Up Market Value (US$ Mn), By Source 2012-2016
TABLE 130 Japan Eye Make Up Market Value (US$ Mn), By Source 2017-2022
TABLE 131 APEJ Eye Make Up Market Value (US$ Mn), By Product Type 2012-2016
TABLE 132 APEJ Eye Make Up Market Value (US$ Mn), By Product Type 2017-2022
TABLE 133 APEJ Eye Make Up Market Value (US$ Mn), By Sales Channel2012-2016
TABLE 134 APEJ Eye Make Up Market Value (US$ Mn), By Sales Channel2017-2022
TABLE 135 APEJ Eye Make Up Market Value (US$ Mn), By Price 2012-2016
TABLE 136 APEJ Eye Make Up Market Value (US$ Mn), By Price 2017-2022
TABLE 137 APEJ Eye Make Up Market Value (US$ Mn), By Source 2012-2016
TABLE 138 APEJ Eye Make Up Market Value (US$ Mn), By Source 2017-2022
TABLE 139 MEA Eye Make Up Market Value (US$ Mn), By Product Type 2012-2016
TABLE 140 MEA Eye Make Up Market Value (US$ Mn), By Product Type 2017-2022
TABLE 141 MEA Eye Make Up Market Value (US$ Mn), By Sales Channel2012-2016
TABLE 142 MEA Eye Make Up Market Value (US$ Mn), By Sales Channel2017-2022
TABLE 143 MEA Eye Make Up Market Value (US$ Mn), By Price 2012-2016
TABLE 144 MEA Eye Make Up Market Value (US$ Mn), By Price 2017-2022
TABLE 145 MEA Eye Make Up Market Value (US$ Mn), By Source 2012-2016
TABLE 146 MEA Eye Make Up Market Value (US$ Mn), By Source 2017-2022
TABLE 147 US Eye Make Up Market Value (US$ Mn), By Product Type 2012-2016
TABLE 148 US Eye Make Up Market Value (US$ Mn), By Product Type 2017-2022
TABLE 149 US Eye Make Up Market Value (US$ Mn), By Sales Channel2012-2016
TABLE 150 US Eye Make Up Market Value (US$ Mn), By Sales Channel2017-2022
TABLE 151 US Eye Make Up Market Value (US$ Mn), By Price 2012-2016
TABLE 152 US Eye Make Up Market Value (US$ Mn), By Price 2017-2022
TABLE 153 US Eye Make Up Market Value (US$ Mn), By Source 2012-2016
TABLE 154 US Eye Make Up Market Value (US$ Mn), By Source 2017-2022
TABLE 155 Canada Eye Make Up Market Value (US$ Mn), By Product Type 2012-2016
TABLE 156 Canada Eye Make Up Market Value (US$ Mn), By Product Type 2017-2022
TABLE 157 Canada Eye Make Up Market Value (US$ Mn), By Sales Channel2012-2016
TABLE 158 Canada Eye Make Up Market Value (US$ Mn), By Sales Channel2017-2022
TABLE 159 Canada Eye Make Up Market Value (US$ Mn), By Price 2012-2016
TABLE 160 Canada Eye Make Up Market Value (US$ Mn), By Price 2017-2022
TABLE 161 Canada Eye Make Up Market Value (US$ Mn), By Source 2012-2016
TABLE 162 Canada Eye Make Up Market Value (US$ Mn), By Source 2017-2022
TABLE 163 Brazil Eye Make Up Market Value (US$ Mn), By Product Type 2012-2016
TABLE 164 Brazil Eye Make Up Market Value (US$ Mn), By Product Type 2017-2022
TABLE 165 Brazil Eye Make Up Market Value (US$ Mn), By Sales Channel2012-2016
TABLE 166 Brazil Eye Make Up Market Value (US$ Mn), By Sales Channel2017-2022
TABLE 167 Brazil Eye Make Up Market Value (US$ Mn), By Price 2012-2016
TABLE 168 Brazil Eye Make Up Market Value (US$ Mn), By Price 2017-2022
TABLE 169 Brazil Eye Make Up Market Value (US$ Mn), By Source 2012-2016
TABLE 170 Brazil Eye Make Up Market Value (US$ Mn), By Source 2017-2022
TABLE 171 Mexico Eye Make Up Market Value (US$ Mn), By Product Type 2012-2016
TABLE 172 Mexico Eye Make Up Market Value (US$ Mn), By Product Type 2017-2022
TABLE 173 Mexico Eye Make Up Market Value (US$ Mn), By Sales Channel2012-2016
TABLE 174 Mexico Eye Make Up Market Value (US$ Mn), By Sales Channel2017-2022
TABLE 175 Mexico Eye Make Up Market Value (US$ Mn), By Price 2012-2016
TABLE 176 Mexico Eye Make Up Market Value (US$ Mn), By Price 2017-2022
TABLE 177 Mexico Eye Make Up Market Value (US$ Mn), By Source 2012-2016
TABLE 178 Mexico Eye Make Up Market Value (US$ Mn), By Source 2017-2022
TABLE 179 Argentina Eye Make Up Market Value (US$ Mn), By Product Type 2012-2016
TABLE 180 Argentina Eye Make Up Market Value (US$ Mn), By Product Type 2017-2022
TABLE 181 Argentina Eye Make Up Market Value (US$ Mn), By Sales Channel2012-2016
TABLE 182 Argentina Eye Make Up Market Value (US$ Mn), By Sales Channel2017-2022
TABLE 183 Argentina Eye Make Up Market Value (US$ Mn), By Price 2012-2016
TABLE 184 Argentina Eye Make Up Market Value (US$ Mn), By Price 2017-2022
TABLE 185 Argentina Eye Make Up Market Value (US$ Mn), By Source 2012-2016
TABLE 186 Argentina Eye Make Up Market Value (US$ Mn), By Source 2017-2022
TABLE 187 Germany Eye Make Up Market Value (US$ Mn), By Product Type 2012-2016
TABLE 188 Germany Eye Make Up Market Value (US$ Mn), By Product Type 2017-2022
TABLE 189 Germany Eye Make Up Market Value (US$ Mn), By Sales Channel2012-2016
TABLE 190 Germany Eye Make Up Market Value (US$ Mn), By Sales Channel2017-2022
TABLE 191 Germany Eye Make Up Market Value (US$ Mn), By Price 2012-2016
TABLE 192 Germany Eye Make Up Market Value (US$ Mn), By Price 2017-2022
TABLE 193 Germany Eye Make Up Market Value (US$ Mn), By Source 2012-2016
TABLE 194 Germany Eye Make Up Market Value (US$ Mn), By Source 2017-2022
TABLE 195 UK Eye Make Up Market Value (US$ Mn), By Product Type 2012-2016
TABLE 196 UK Eye Make Up Market Value (US$ Mn), By Product Type 2017-2022
TABLE 197 UK Eye Make Up Market Value (US$ Mn), By Sales Channel2012-2016
TABLE 198 UK Eye Make Up Market Value (US$ Mn), By Sales Channel2017-2022
TABLE 199 UK Eye Make Up Market Value (US$ Mn), By Price 2012-2016
TABLE 200 UK Eye Make Up Market Value (US$ Mn), By Price 2017-2022
TABLE 201 UK Eye Make Up Market Value (US$ Mn), By Source 2012-2016
TABLE 202 UK Eye Make Up Market Value (US$ Mn), By Source 2017-2022
TABLE 203 France Eye Make Up Market Value (US$ Mn), By Product Type 2012-2016
TABLE 204 France Eye Make Up Market Value (US$ Mn), By Product Type 2017-2022
TABLE 205 France Eye Make Up Market Value (US$ Mn), By Sales Channel2012-2016
TABLE 206 France Eye Make Up Market Value (US$ Mn), By Sales Channel2017-2022
TABLE 207 France Eye Make Up Market Value (US$ Mn), By Price 2012-2016
TABLE 208 France Eye Make Up Market Value (US$ Mn), By Price 2017-2022
TABLE 209 France Eye Make Up Market Value (US$ Mn), By Source 2012-2016
TABLE 210 France Eye Make Up Market Value (US$ Mn), By Source 2017-2022
TABLE 211 Spain Eye Make Up Market Value (US$ Mn), By Product Type 2012-2016
TABLE 212 Spain Eye Make Up Market Value (US$ Mn), By Product Type 2017-2022
TABLE 213 Spain Eye Make Up Market Value (US$ Mn), By Sales Channel2012-2016
TABLE 214 Spain Eye Make Up Market Value (US$ Mn), By Sales Channel2017-2022
TABLE 215 Spain Eye Make Up Market Value (US$ Mn), By Price 2012-2016
TABLE 216 Spain Eye Make Up Market Value (US$ Mn), By Price 2017-2022
TABLE 217 Spain Eye Make Up Market Value (US$ Mn), By Source 2012-2016
TABLE 218 Spain Eye Make Up Market Value (US$ Mn), By Source 2017-2022
TABLE 219 Italy Eye Make Up Market Value (US$ Mn), By Product Type 2012-2016
TABLE 220 Italy Eye Make Up Market Value (US$ Mn), By Product Type 2017-2022
TABLE 221 Italy Eye Make Up Market Value (US$ Mn), By Sales Channel2012-2016
TABLE 222 Italy Eye Make Up Market Value (US$ Mn), By Sales Channel2017-2022
TABLE 223 Italy Eye Make Up Market Value (US$ Mn), By Price 2012-2016
TABLE 224 Italy Eye Make Up Market Value (US$ Mn), By Price 2017-2022
TABLE 225 Italy Eye Make Up Market Value (US$ Mn), By Source 2012-2016
TABLE 226 Italy Eye Make Up Market Value (US$ Mn), By Source 2017-2022
TABLE 227 Nordic Eye Make Up Market Value (US$ Mn), By Product Type 2012-2016
TABLE 228 Nordic Eye Make Up Market Value (US$ Mn), By Product Type 2017-2022
TABLE 229 Nordic Eye Make Up Market Value (US$ Mn), By Sales Channel2012-2016
TABLE 230 Nordic Eye Make Up Market Value (US$ Mn), By Sales Channel2017-2022
TABLE 231 Nordic Eye Make Up Market Value (US$ Mn), By Price 2012-2016
TABLE 232 Nordic Eye Make Up Market Value (US$ Mn), By Price 2017-2022
TABLE 233 Nordic Eye Make Up Market Value (US$ Mn), By Source 2012-2016
TABLE 234 Nordic Eye Make Up Market Value (US$ Mn), By Source 2017-2022
TABLE 235 Japan Eye Make Up Market Value (US$ Mn), By Product Type 2012-2016
TABLE 236 Japan Eye Make Up Market Value (US$ Mn), By Product Type 2017-2022
TABLE 237 Japan Eye Make Up Market Value (US$ Mn), By Sales Channel2012-2016
TABLE 238 Japan Eye Make Up Market Value (US$ Mn), By Sales Channel2017-2022
TABLE 239 Japan Eye Make Up Market Value (US$ Mn), By Price 2012-2016
TABLE 240 Japan Eye Make Up Market Value (US$ Mn), By Price 2017-2022
TABLE 241 Japan Eye Make Up Market Value (US$ Mn), By Source 2012-2016
TABLE 242 Japan Eye Make Up Market Value (US$ Mn), By Source 2017-2022
TABLE 243 China Eye Make Up Market Value (US$ Mn), By Product Type 2012-2016
TABLE 244 China Eye Make Up Market Value (US$ Mn), By Product Type 2017-2022
TABLE 245 China Eye Make Up Market Value (US$ Mn), By Sales Channel2012-2016
TABLE 246 China Eye Make Up Market Value (US$ Mn), By Sales Channel2017-2022
TABLE 247 China Eye Make Up Market Value (US$ Mn), By Price 2012-2016
TABLE 248 China Eye Make Up Market Value (US$ Mn), By Price 2017-2022
TABLE 249 China Eye Make Up Market Value (US$ Mn), By Source 2012-2016
TABLE 250 China Eye Make Up Market Value (US$ Mn), By Source 2017-2022
TABLE 251 India Eye Make Up Market Value (US$ Mn), By Product Type 2012-2016
TABLE 252 India Eye Make Up Market Value (US$ Mn), By Product Type 2017-2022
TABLE 253 India Eye Make Up Market Value (US$ Mn), By Sales Channel2012-2016
TABLE 254 India Eye Make Up Market Value (US$ Mn), By Sales Channel2017-2022
TABLE 255 India Eye Make Up Market Value (US$ Mn), By Price 2012-2016
TABLE 256 India Eye Make Up Market Value (US$ Mn), By Price 2017-2022
TABLE 257 India Eye Make Up Market Value (US$ Mn), By Source 2012-2016
TABLE 258 India Eye Make Up Market Value (US$ Mn), By Source 2017-2022
TABLE 259 Malaysia Eye Make Up Market Value (US$ Mn), By Product Type 2012-2016
TABLE 260 Malaysia Eye Make Up Market Value (US$ Mn), By Product Type 2017-2022
TABLE 261 Malaysia Eye Make Up Market Value (US$ Mn), By Sales Channel2012-2016
TABLE 262 Malaysia Eye Make Up Market Value (US$ Mn), By Sales Channel2017-2022
TABLE 263 Malaysia Eye Make Up Market Value (US$ Mn), By Price 2012-2016
TABLE 264 Malaysia Eye Make Up Market Value (US$ Mn), By Price 2017-2022
TABLE 265 Malaysia Eye Make Up Market Value (US$ Mn), By Source 2012-2016
TABLE 266 Malaysia Eye Make Up Market Value (US$ Mn), By Source 2017-2022
TABLE 267 Thailand Eye Make Up Market Value (US$ Mn), By Product Type 2012-2016
TABLE 268 Thailand Eye Make Up Market Value (US$ Mn), By Product Type 2017-2022
TABLE 269 Thailand Eye Make Up Market Value (US$ Mn), By Sales Channel2012-2016
TABLE 270 Thailand Eye Make Up Market Value (US$ Mn), By Sales Channel2017-2022
TABLE 271 Thailand Eye Make Up Market Value (US$ Mn), By Price 2012-2016
TABLE 272 Thailand Eye Make Up Market Value (US$ Mn), By Price 2017-2022
TABLE 273 Thailand Eye Make Up Market Value (US$ Mn), By Source 2012-2016
TABLE 274 Thailand Eye Make Up Market Value (US$ Mn), By Source 2017-2022
TABLE 275 Singapore Eye Make Up Market Value (US$ Mn), By Product Type 2012-2016
TABLE 276 Singapore Eye Make Up Market Value (US$ Mn), By Product Type 2017-2022
TABLE 277 Singapore Eye Make Up Market Value (US$ Mn), By Sales Channel2012-2016
TABLE 278 Singapore Eye Make Up Market Value (US$ Mn), By Sales Channel2017-2022
TABLE 279 Singapore Eye Make Up Market Value (US$ Mn), By Price 2012-2016
TABLE 280 Singapore Eye Make Up Market Value (US$ Mn), By Price 2017-2022
TABLE 281 Singapore Eye Make Up Market Value (US$ Mn), By Source 2012-2016
TABLE 282 Singapore Eye Make Up Market Value (US$ Mn), By Source 2017-2022
TABLE 283 Australia Eye Make Up Market Value (US$ Mn), By Product Type 2012-2016
TABLE 284 Australia Eye Make Up Market Value (US$ Mn), By Product Type 2017-2022
TABLE 285 Australia Eye Make Up Market Value (US$ Mn), By Sales Channel2012-2016
TABLE 286 Australia Eye Make Up Market Value (US$ Mn), By Sales Channel2017-2022
TABLE 287 Australia Eye Make Up Market Value (US$ Mn), By Price 2012-2016
TABLE 288 Australia Eye Make Up Market Value (US$ Mn), By Price 2017-2022
TABLE 289 Australia Eye Make Up Market Value (US$ Mn), By Source 2012-2016
TABLE 290 Australia Eye Make Up Market Value (US$ Mn), By Source 2017-2022
TABLE 291 GCC Countries Eye Make Up Market Value (US$ Mn), By Product Type 2012-2016
TABLE 292 GCC Countries Eye Make Up Market Value (US$ Mn), By Product Type 2017-2022
TABLE 293 GCC Countries Eye Make Up Market Value (US$ Mn), By Sales Channel2012-2016
TABLE 294 GCC Countries Eye Make Up Market Value (US$ Mn), By Sales Channel2017-2022
TABLE 295 GCC Countries Eye Make Up Market Value (US$ Mn), By Price 2012-2016
TABLE 296 GCC Countries Eye Make Up Market Value (US$ Mn), By Price 2017-2022
TABLE 297 GCC Countries Eye Make Up Market Value (US$ Mn), By Source 2012-2016
TABLE 298 GCC Countries Eye Make Up Market Value (US$ Mn), By Source 2017-2022
TABLE 299 South Africa Eye Make Up Market Value (US$ Mn), By Product Type 2012-2016
TABLE 300 South Africa Eye Make Up Market Value (US$ Mn), By Product Type 2017-2022
TABLE 301 South Africa Eye Make Up Market Value (US$ Mn), By Sales Channel2012-2016
TABLE 302 South Africa Eye Make Up Market Value (US$ Mn), By Sales Channel2017-2022
TABLE 303 South Africa Eye Make Up Market Value (US$ Mn), By Price 2012-2016
TABLE 304 South Africa Eye Make Up Market Value (US$ Mn), By Price 2017-2022
TABLE 305 South Africa Eye Make Up Market Value (US$ Mn), By Source 2012-2016
TABLE 306 South Africa Eye Make Up Market Value (US$ Mn), By Source 2017-2022
TABLE 307 Nigeria Eye Make Up Market Value (US$ Mn), By Product Type 2012-2016
TABLE 308 Nigeria Eye Make Up Market Value (US$ Mn), By Product Type 2017-2022
TABLE 309 Nigeria Eye Make Up Market Value (US$ Mn), By Sales Channel2012-2016
TABLE 310 Nigeria Eye Make Up Market Value (US$ Mn), By Sales Channel2017-2022
TABLE 311 Nigeria Eye Make Up Market Value (US$ Mn), By Price 2012-2016
TABLE 312 Nigeria Eye Make Up Market Value (US$ Mn), By Price 2017-2022
TABLE 313 Nigeria Eye Make Up Market Value (US$ Mn), By Source 2012-2016
TABLE 314 Nigeria Eye Make Up Market Value (US$ Mn), By Source 2017-2022
TABLE 315 Israel Eye Make Up Market Value (US$ Mn), By Product Type 2012-2016
TABLE 316 Israel Eye Make Up Market Value (US$ Mn), By Product Type 2017-2022
TABLE 317 Israel Eye Make Up Market Value (US$ Mn), By Sales Channel2012-2016
TABLE 318 Israel Eye Make Up Market Value (US$ Mn), By Sales Channel2017-2022
TABLE 319 Israel Eye Make Up Market Value (US$ Mn), By Price 2012-2016
TABLE 320 Israel Eye Make Up Market Value (US$ Mn), By Price 2017-2022
TABLE 321 Israel Eye Make Up Market Value (US$ Mn), By Source 2012-2016
TABLE 322 Israel Eye Make Up Market Value (US$ Mn), By Source 2017-2022
List of Figures
FIG. 1 Global Eye Make Up Market Value (US$ Mn), 2012-2016
FIG. 2 Global Eye Make Up Market Value (US$ Mn) Forecast, 2017-2022
FIG. 3 Global Eye Make Up Market Value (US$ Mn) and Y-o-Y, 2015-2022
FIG. 4 Global Mascara Segment Market Value (US$ Mn) By Region, 2012-2016
FIG. 5 Global Mascara Segment Market Value (US$ Mn) By Region, 2017-2022
FIG. 6 Global Mascara Segment Y-o-Y Growth Rate, By Region, 2015-2022
FIG. 7 Global Eye Shadow Segment Market Value (US$ Mn) By Region, 2012-2016
FIG. 8 Global Eye Shadow Segment Market Value (US$ Mn) By Region, 2017-2022
FIG. 9 Global Eye Shadow Segment Y-o-Y Growth Rate, By Region, 2015-2022
FIG. 10 Global Eye Liner Segment Market Value (US$ Mn) By Region, 2012-2016
FIG. 11 Global Eye Liner Segment Market Value (US$ Mn) By Region, 2017-2022
FIG. 12 Global Eye Liner Segment Y-o-Y Growth Rate, By Region, 2015-2022
FIG. 13 Global Eye Pencil Segment Market Value (US$ Mn) By Region, 2012-2016
FIG. 14 Global Eye Pencil Segment Market Value (US$ Mn) By Region, 2017-2022
FIG. 15 Global Eye Pencil Segment Y-o-Y Growth Rate, By Region, 2015-2022
FIG. 16 Global Eye Brow Segment Market Value (US$ Mn) By Region, 2012-2016
FIG. 17 Global Eye Brow Segment Market Value (US$ Mn) By Region, 2017-2022
FIG. 18 Global Eye Brow Segment Y-o-Y Growth Rate, By Region, 2015-2022
FIG. 19 Global Other Product Types Segment Market Value (US$ Mn) By Region, 2012-2016
FIG. 20 Global Other Product Types Segment Market Value (US$ Mn) By Region, 2017-2022
FIG. 21 Global Other Product Types Segment Y-o-Y Growth Rate, By Region, 2015-2022
FIG. 22 Global Supermarket Segment Market Value (US$ Mn) By Region, 2012-2016
FIG. 23 Global Supermarket Segment Market Value (US$ Mn) By Region, 2017-2022
FIG. 24 Global Supermarket Segment Y-o-Y Growth Rate, By Region, 2015-2022
FIG. 25 Global Hypermarket Segment Market Value (US$ Mn) By Region, 2012-2016
FIG. 26 Global Hypermarket Segment Market Value (US$ Mn) By Region, 2017-2022
FIG. 27 Global Hypermarket Segment Y-o-Y Growth Rate, By Region, 2015-2022
FIG. 28 Global Pharmacies Segment Market Value (US$ Mn) By Region, 2012-2016
FIG. 29 Global Pharmacies Segment Market Value (US$ Mn) By Region, 2017-2022
FIG. 30 Global Pharmacies Segment Y-o-Y Growth Rate, By Region, 2015-2022
FIG. 31 Global Health & Beauty Retailer Segment Market Value (US$ Mn) By Region, 2012-2016
FIG. 32 Global Health & Beauty Retailer Segment Market Value (US$ Mn) By Region, 2017-2022
FIG. 33 Global Health & Beauty Retailer Segment Y-o-Y Growth Rate, By Region, 2015-2022
FIG. 34 Global E-commerce Segment Market Value (US$ Mn) By Region, 2012-2016
FIG. 35 Global E-commerce Segment Market Value (US$ Mn) By Region, 2017-2022
FIG. 36 Global E-commerce Segment Y-o-Y Growth Rate, By Region, 2015-2022
FIG. 37 Global Other Sales Channels Segment Market Value (US$ Mn) By Region, 2012-2016
FIG. 38 Global Other Sales Channels Segment Market Value (US$ Mn) By Region, 2017-2022
FIG. 39 Global Other Sales Channels Segment Y-o-Y Growth Rate, By Region, 2015-2022
FIG. 40 Global Economic Segment Market Value (US$ Mn) By Region, 2012-2016
FIG. 41 Global Economic Segment Market Value (US$ Mn) By Region, 2017-2022
FIG. 42 Global Economic Segment Y-o-Y Growth Rate, By Region, 2015-2022
FIG. 43 Global Premium Segment Market Value (US$ Mn) By Region, 2012-2016
FIG. 44 Global Premium Segment Market Value (US$ Mn) By Region, 2017-2022
FIG. 45 Global Premium Segment Y-o-Y Growth Rate, By Region, 2015-2022
FIG. 46 Global Chemical Segment Market Value (US$ Mn) By Region, 2012-2016
FIG. 47 Global Chemical Segment Market Value (US$ Mn) By Region, 2017-2022
FIG. 48 Global Chemical Segment Y-o-Y Growth Rate, By Region, 2015-2022
FIG. 49 Global Natural Segment Market Value (US$ Mn) By Region, 2012-2016
FIG. 50 Global Natural Segment Market Value (US$ Mn) By Region, 2017-2022
FIG. 51 Global Natural Segment Y-o-Y Growth Rate, By Region, 2015-2022
FIG. 52 Global Organic Segment Market Value (US$ Mn) By Region, 2012-2016
FIG. 53 Global Organic Segment Market Value (US$ Mn) By Region, 2017-2022
FIG. 54 Global Organic Segment Y-o-Y Growth Rate, By Region, 2015-2022
FIG. 55 Global Halal Segment Market Value (US$ Mn) By Region, 2012-2016
FIG. 56 Global Halal Segment Market Value (US$ Mn) By Region, 2017-2022
FIG. 57 Global Halal Segment Y-o-Y Growth Rate, By Region, 2015-2022
FIG. 58 Global Other Sources Segment Market Value (US$ Mn) By Region, 2012-2016
FIG. 59 Global Other Sources Segment Market Value (US$ Mn) By Region, 2017-2022
FIG. 60 Global Other Sources Segment Y-o-Y Growth Rate, By Region, 2015-2022
FIG. 61 North America Eye Make Up Market Value (US$ Mn), By Product Type 2012-2016
FIG. 62 North America Eye Make Up Market Value (US$ Mn), By Product Type 2017-2022
FIG. 63 North America Eye Make Up Market Value (US$ Mn), By Sales Channel2012-2016
FIG. 64 North America Eye Make Up Market Value (US$ Mn), By Sales Channel2017-2022
FIG. 65 North America Eye Make Up Market Value (US$ Mn), By Price 2012-2016
FIG. 66 North America Eye Make Up Market Value (US$ Mn), By Price 2017-2022
FIG. 67 North America Eye Make Up Market Value (US$ Mn), By Source 2012-2016
FIG. 68 North America Eye Make Up Market Value (US$ Mn), By Source 2017-2022
FIG. 69 Latin America Eye Make Up Market Value (US$ Mn), By Product Type 2012-2016
FIG. 70 Latin America Eye Make Up Market Value (US$ Mn), By Product Type 2017-2022
FIG. 71 Latin America Eye Make Up Market Value (US$ Mn), By Sales Channel2012-2016
FIG. 72 Latin America Eye Make Up Market Value (US$ Mn), By Sales Channel2017-2022
FIG. 73 Latin America Eye Make Up Market Value (US$ Mn), By Price 2012-2016
FIG. 74 Latin America Eye Make Up Market Value (US$ Mn), By Price 2017-2022
FIG. 75 Latin America Eye Make Up Market Value (US$ Mn), By Source 2012-2016
FIG. 76 Latin America Eye Make Up Market Value (US$ Mn), By Source 2017-2022
FIG. 77 Europe Eye Make Up Market Value (US$ Mn), By Product Type 2012-2016
FIG. 78 Europe Eye Make Up Market Value (US$ Mn), By Product Type 2017-2022
FIG. 79 Europe Eye Make Up Market Value (US$ Mn), By Sales Channel2012-2016
FIG. 80 Europe Eye Make Up Market Value (US$ Mn), By Sales Channel2017-2022
FIG. 81 Europe Eye Make Up Market Value (US$ Mn), By Price 2012-2016
FIG. 82 Europe Eye Make Up Market Value (US$ Mn), By Price 2017-2022
FIG. 83 Europe Eye Make Up Market Value (US$ Mn), By Source 2012-2016
FIG. 84 Europe Eye Make Up Market Value (US$ Mn), By Source 2017-2022
FIG. 85 Japan Eye Make Up Market Value (US$ Mn), By Product Type 2012-2016
FIG. 86 Japan Eye Make Up Market Value (US$ Mn), By Product Type 2017-2022
FIG. 87 Japan Eye Make Up Market Value (US$ Mn), By Sales Channel2012-2016
FIG. 88 Japan Eye Make Up Market Value (US$ Mn), By Sales Channel2017-2022
FIG. 89 Japan Eye Make Up Market Value (US$ Mn), By Price 2012-2016
FIG. 90 Japan Eye Make Up Market Value (US$ Mn), By Price 2017-2022
FIG. 91 Japan Eye Make Up Market Value (US$ Mn), By Source 2012-2016
FIG. 92 Japan Eye Make Up Market Value (US$ Mn), By Source 2017-2022
FIG. 93 APEJ Eye Make Up Market Value (US$ Mn), By Product Type 2012-2016
FIG. 94 APEJ Eye Make Up Market Value (US$ Mn), By Product Type 2017-2022
FIG. 95 APEJ Eye Make Up Market Value (US$ Mn), By Sales Channel2012-2016
FIG. 96 APEJ Eye Make Up Market Value (US$ Mn), By Sales Channel2017-2022
FIG. 97 APEJ Eye Make Up Market Value (US$ Mn), By Price 2012-2016
FIG. 98 APEJ Eye Make Up Market Value (US$ Mn), By Price 2017-2022
FIG. 99 APEJ Eye Make Up Market Value (US$ Mn), By Source 2012-2016
FIG. 100 APEJ Eye Make Up Market Value (US$ Mn), By Source 2017-2022
FIG. 101 MEA Eye Make Up Market Value (US$ Mn), By Product Type 2012-2016
FIG. 102 MEA Eye Make Up Market Value (US$ Mn), By Product Type 2017-2022
FIG. 103 MEA Eye Make Up Market Value (US$ Mn), By Sales Channel2012-2016
FIG. 104 MEA Eye Make Up Market Value (US$ Mn), By Sales Channel2017-2022
FIG. 105 MEA Eye Make Up Market Value (US$ Mn), By Price 2012-2016
FIG. 106 MEA Eye Make Up Market Value (US$ Mn), By Price 2017-2022
FIG. 107 MEA Eye Make Up Market Value (US$ Mn), By Source 2012-2016
FIG. 108 MEA Eye Make Up Market Value (US$ Mn), By Source 2017-2022
Copyright © Transparency Market Research, Inc. All Rights reserved
Trust Online

Eye Makeup Market