
Reports
Reports
Analysts’ Viewpoint on Epilepsy Therapeutics Market Scenario
Rise in number of accidents and brain injuries; and high prevalence of post-traumatic epilepsy (PTE) and post-traumatic seizure (PTS) in patients with brain injuries are driving the epilepsy treatment market. Increase in funding by governments to improve and develop effective drugs and treatments for seizures; and rise in research and development activities to provide advanced healthcare facilities are also augmenting the epilepsy treatment market. Furthermore, growth in awareness about training programs for physicians and patients is fueling the epilepsy treatment market. Epilepsy biotech companies are entering into collaborations with market participants to provide better treatment lines. Development of new drugs and treatment options is likely to create lucrative opportunities for players operating in the epilepsy therapeutics market in the near future.
Epilepsy is a chronic neurological disorder that can cause unfounded and ongoing seizures. A person suffering from this disease may experience seizures with no explanation. These seizures can be caused by a previous brain injury or any traumatic event; however, the exact cause is still unknown. This condition is most common in adults and children, though the elderly population is also susceptible to it. Almost every patient with multiple seizures begins treatment with epilepsy medications or therapeutics. These medications prevent seizures by decreasing the brain cells' proclivity to direct disorganized and excessive electrical impulses. Most of the people with epilepsy can control their seizures with medication, or in some cases, surgery. Some people need treatment for the rest of their lives to control their seizures, but for others, the seizures eventually go away. Some children with epilepsy may outgrow it. Rise in public awareness about the treatment of neurological disorders combined with high adoption of antiepileptic drugs (AEDs) is expected to drive the epilepsy market size. Decrease in stigma associated with epilepsy is expected to drive the demand for appropriate treatment and care.
According to World Health Organization statistics for 2022, approximately 50 million people worldwide have epilepsy, making it one of the most common neurological diseases worldwide. Epilepsy is estimated to affect 49 people out of every 100,000 in high-income countries each year. This figure can reach 139 per 100 000 in low- and middle-income countries. However, up to 70% of people can live seizure-free lives if epilepsy is properly diagnosed and treated.
According to a ResearchGate study, anti-epileptic drugs (AEDs) are regarded as the most important types of drug treatment for epilepsy patients. Discovery of these drugs has nearly doubled since the 1980s. If a single AED does not control the occurrence of seizures, a combination of AEDs, known as polytherapy, is usually recommended. According to NCBI, an important trend in current anti-epileptic drug development focuses on approaches containing new pharmacology that can target therapies for specific subpopulations with drug-resistant epilepsy. According to the Journal of Drug Delivery and Therapeutics, new anti-epileptic drugs have been developed with fewer side effects and greater efficacy than those currently available.
According to the FDA, Epidiolex (cannabidiol) [CBD] oral solution was approved in June 2018 for the treatment of seizures associated with two rare and severe forms of epilepsy – Lennox-Gastaut syndrome and Dravet syndrome – in patients two years of age and older. This is the first FDA-approved drug that contains a purified marijuana-derived drug substance. It is also the first FDA approval of a drug for the treatment of Dravet syndrome patients. Three randomized, double-blind, placebo-controlled clinical trials involving 516 patients with either Lennox-Gastaut syndrome or Dravet syndrome were conducted to assess the efficacy of Epidiolex. When used in conjunction with other medications, Epidiolex was shown to be more effective than placebo in reducing the frequency of seizures. Such novel drugs have fewer side effects, greater specificity, and higher efficacy.
According to the NCBI, brain tumors are the second most common cause of epilepsy in the geriatric population, accounting for 10% to 30% of all causes of geriatric epilepsy. Epilepsy is a common symptom in patients with brain tumors. Seizures are the onset symptom in 20% to 40% of brain tumor patients; about 20% to 45% of patients are likely to have epileptic seizures during the course of the disease. According to the International League Against Epilepsy (ILAE), infections in the central nervous system, such as meningitis, encephalitis, and neurocysticercosis, can result in both acute symptomatic seizures (which occur in a time frame related to the initial infection) and epilepsy. Alcohol or drug abuse as well as failure to take prescribed anticonvulsant medication are key factors that are likely to increase the risk of seizures in people who are predisposed to seizures, according to the American Association of Neurological Surgeons.
Extensive R&D activities form the foundation of new and advanced epilepsy therapeutics, improving their effectiveness, efficacy, and pharmacokinetics vis-à-vis currently available products in the market. Companies developing epilepsy therapeutics are focusing on creating antiepileptic drugs with improved tolerability, efficacy, and fewer side effects.
Several market participants develop novel products, obtain government approvals, launch new products, collaborate and form partnerships, engage in acquisitions and mergers, and create profit-making opportunities to strengthen their position in the epilepsy therapeutics market. Brivasure, a reasonably priced anti-epileptic medication for treating epilepsy in India, was introduced in March 2021 by Mumbai-based Alkem Laboratories. An entire line of Brivaracetam, an anti-epilepsy medicine, would be made available in India at a reasonable price, according to plans revealed by Sun Pharmaceutical Industries in February 2021. In 2019, Teva Pharmaceutical Industries Ltd. announced the U.S. launch of a generic version of Sabril (Vigabatrin). It was the first generic version of Sabril (vigabatrin) tablets to enter the market in the U.S. Furthermore, continuous innovations and developments in the field of epilepsy therapeutics industry are driving the market. For instance, art therapy for epilepsy, which allows people to explore their emotions and feelings through the process of creating, painting, or drawing, is gaining prominence across the globe.
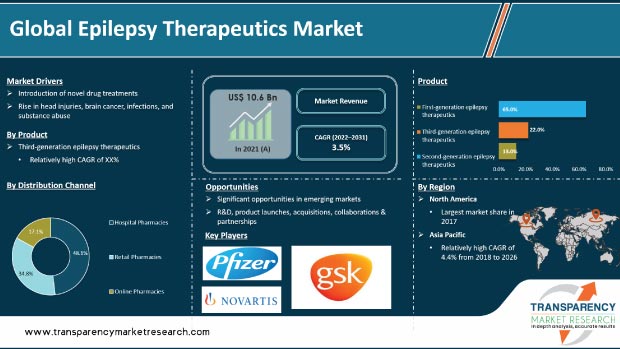
In terms of product, the global epilepsy therapeutics market has been classified into first generation epilepsy therapeutics, second generation epilepsy therapeutics, and third generation epilepsy therapeutics. The second generation epilepsy therapeutics segment is expected to dominate the global market during the forecast period. Second generation epilepsy therapeutics offer several benefits such as decreased drug-drug interactions, fewer life-threatening adverse events, and less negative impact on cognitive functions. According to the American Academy of Neurology, second generation AEDs have lower risk of teratogenesis and a more favorable side-effect profile as compared to that of first generation epilepsy therapeutics.
Based on route of administration, the global epilepsy therapeutics market has been segregated into oral, intravenous, intramuscular, and others. The oral segment held prominent share of the global market in 2021. Oral administration is the most convenient, safest, and simplest mode of drug administration. It is convenient for prolonged and repeated usage. It can be self-administered and is pain-free. However, the intravenous segment is projected to grow at the fastest CAGR during the forecast period. Major technological innovations in the medical sector and emergence of effective analgesic drugs are expected to augment the segment.
In terms of distribution channel, the global epilepsy therapeutics market has been divided into hospital pharmacies, retail pharmacies, and online pharmacies. The online pharmacies segment is expected to grow at a rapid pace during the forecast period. Online pharmacies (e-pharmacies) sell drugs to customers via mail or shipping services. The pandemic-induced shutdowns and lockdowns have led to an increase in online drug purchases. Businesses and customers are increasingly preferring contactless delivery. This trend is expected to continue even after the pandemic. However, the hospital pharmacies segment is projected to account for the largest share of the global epilepsy therapeutics market during the forecast period.
North America accounted for major share of around 50.0% of the global epilepsy therapeutics market in 2021. The U.S. is the largest epilepsy drug market in the region, led by the improved healthcare infrastructure and rise in epilepsy cases in the country. According to the Centers for Disease Control and Prevention, approximately 470,000 children and 3 million adults in the U.S. had active epilepsy in 2020. The number of Americans suffering from epilepsy is higher than those suffering from multiple sclerosis, Parkinson's disease, and cerebral palsy combined. As a result, the future for epilepsy treatment options is high in the region. Furthermore, various organizations in the U.S. are raising awareness about epilepsy. For instance, Epilepsy Awareness Day or Purple Day is observed annually on March 26 to increase public understanding of the brain disorder and eliminate the fear and stigma associated with it. Thus, the market for epilepsy therapeutics is expected to grow rapidly in the near future. Development of products with high efficacy, better outcomes, and fewer side effects is also likely to accelerate market growth in North America.
The market in Asia Pacific is expected to grow at a significant pace during the forecast period. This can be ascribed to the ever-increasing geriatric population base, government initiatives to improve the healthcare industry, increased activities related to research and development, and rise in prevalence of epilepsy in the region.
The global epilepsy therapeutics market is consolidated, with the presence of small number of leading players. Most of the companies are investing significantly in research & development activities, primarily to introduce advanced epilepsy therapeutics products. Key players are entering into strategic alliances to increase their revenue and market share. Furthermore, diversification of product portfolios and mergers & acquisitions are the prominent strategies adopted by the leading players.
Pfizer, Inc., UCB S.A., Bausch Health Companies Inc., Novartis AG, GlaxoSmithKline plc., Teva Pharmaceutical Industries Ltd., Sunovion Pharmaceuticals Inc., Eisai Co., Upsher-Smith Laboratories, LLC., and Amneal Pharmaceuticals LLC. are the key players operating in the global epilepsy therapeutics market.
Each of these players has been profiled in the epilepsy therapeutics market report based on parameters such as company overview, financial overview, business strategies, product portfolio, business segments, and recent developments.
|
Attribute |
Detail |
|
Market Size Value in 2021 |
US$ 10.6 Bn |
|
Market Forecast Value in 2031 |
More than US$ 14.9 Bn |
|
Growth Rate (CAGR) |
3.5% |
|
Forecast Period |
2022–2031 |
|
Historical Data Available for |
2017–2021 |
|
Quantitative Units |
US$ Bn for Value |
|
Market Analysis |
It includes segment analysis as well as regional level analysis. Moreover, qualitative analysis includes drivers, restraints, opportunities, key trends, and key trend analysis. |
|
Competition Landscape |
|
|
Format |
Electronic (PDF) + Excel |
|
Market Segmentation |
|
|
Regions Covered |
|
|
Countries Covered |
|
|
Companies Profiled |
|
|
Customization Scope |
Available upon request |
|
Pricing |
Available upon request |
The global epilepsy therapeutics market was valued at US$ 10.6 Bn in 2021.
The global epilepsy therapeutics market is projected to reach more than US$ 14.9 Bn by 2031.
The global epilepsy therapeutics market is anticipated to grow at a CAGR of 3.5% from 2022 to 2031.
Introduction of promising drugs, rise in number of accidents and brain injuries; and high prevalence of post-traumatic epilepsy (PTE) and post-traumatic seizure (PTS).
The first generation epilepsy therapeutics segment held over 61% share of the global epilepsy therapeutics market in 2021.
Pfizer, Inc., UCB S.A., Bausch Health Companies Inc., Novartis AG, GlaxoSmithKline plc., Teva Pharmaceutical Industries Ltd., Sunovion Pharmaceuticals Inc., Eisai Co., Upsher-Smith Laboratories, LLC., and Amneal Pharmaceuticals LLC.
1. Preface
1.1. Market Definition and Scope
1.2. Market Segmentation
1.3. Key Research Objectives
1.4. Research Highlights
2. Assumptions and Research Methodology
3. Executive Summary: Global Epilepsy Therapeutics Market
4. Market Overview
4.1. Introduction
4.1.1. Product Definition
4.1.2. Industry Evolution / Developments
4.2. Overview
4.3. Market Dynamics
4.3.1. Drivers
4.3.2. Restraints
4.3.3. Opportunities
4.4. Global Epilepsy Therapeutics Market Analysis and Forecast, 2017–2031
4.4.1. Market Revenue Projections (US$ Mn)
5. Market Outlook
5.1. Pipeline
5.2. Epidemiology of Epilepsy
5.3. Key Industry Events
6. Global Epilepsy Therapeutics Market Analysis and Forecast, by Product
6.1. Introduction & Definition
6.2. Key Findings / Developments
6.3. Market Value Forecast, by Product, 2017–2031
6.3.1. First Generation Epilepsy Therapeutics
6.3.2. Second Generation Epilepsy Therapeutics
6.3.3. Third Generation Epilepsy Therapeutics
6.4. Market Attractiveness, by Product
7. Global Epilepsy Therapeutics Market Analysis and Forecast, by Distribution Channel
7.1. Introduction & Definition
7.2. Key Findings / Developments
7.3. Market Value Forecast, by Distribution Channel, 2017–2031
7.3.1. Hospital Pharmacies
7.3.2. Retail Pharmacies
7.3.3. Online Pharmacies
7.4. Market Attractiveness, by Distribution Channel
8. Global Epilepsy Therapeutics Market Analysis and Forecast, by Region
8.1. Key Findings
8.2. Market Value Forecast, by Region
8.2.1. North America
8.2.2. Europe
8.2.3. Asia Pacific
8.2.4. Latin America
8.2.5. Middle East & Africa
8.3. Market Attractiveness, by Region
9. North America Epilepsy Therapeutics Market Analysis and Forecast
9.1. Introduction
9.1.1. Key Findings
9.2. Market Value Forecast, by Product, 2017–2031
9.2.1. First Generation Epilepsy Therapeutics
9.2.2. Second Generation Epilepsy Therapeutics
9.2.3. Third Generation Epilepsy Therapeutics
9.3. Market Value Forecast, by Distribution Channel, 2017–2031
9.3.1. Hospital Pharmacies
9.3.2. Retail Pharmacies
9.3.3. Online Pharmacies
9.4. Market Value Forecast, by Country, 2017–2031
9.4.1. U.S.
9.4.2. Canada
9.5. Market Attractiveness Analysis
9.5.1. By Product
9.5.2. By Distribution Channel
9.5.3. By Country
10. Europe Epilepsy Therapeutics Market Analysis and Forecast
10.1. Introduction
10.1.1. Key Findings
10.2. Market Value Forecast, by Product, 2017–2031
10.2.1. First Generation Epilepsy Therapeutics
10.2.2. Second Generation Epilepsy Therapeutics
10.2.3. Third Generation Epilepsy Therapeutics
10.3. Market Value Forecast, by Distribution Channel, 2017–2031
10.3.1. Hospital Pharmacies
10.3.2. Retail Pharmacies
10.3.3. Online Pharmacies
10.4. Market Value Forecast, by Country/Sub-region, 2017–2031
10.4.1. Germany
10.4.2. U.K.
10.4.3. France
10.4.4. Spain
10.4.5. Italy
10.4.6. Rest of Europe
10.5. Market Attractiveness Analysis
10.5.1. By Product
10.5.2. By Distribution Channel
10.5.3. By Country/Sub-region
11. Asia Pacific Epilepsy Therapeutics Market Analysis and Forecast
11.1. Introduction
11.1.1. Key Findings
11.2. Market Value Forecast, by Product, 2017–2031
11.2.1. First Generation Epilepsy Therapeutics
11.2.2. Second Generation Epilepsy Therapeutics
11.2.3. Third Generation Epilepsy Therapeutics
11.3. Market Value Forecast, by Distribution Channel, 2017–2031
11.3.1. Hospital Pharmacies
11.3.2. Retail Pharmacies
11.3.3. Online Pharmacies
11.4. Market Value Forecast, by Country/Sub-region, 2017–2031
11.4.1. China
11.4.2. Japan
11.4.3. India
11.4.4. Australia & New Zealand
11.4.5. Rest of Asia Pacific
11.5. Market Attractiveness Analysis
11.5.1. By Product
11.5.2. By Distribution Channel
11.5.3. By Country/Sub-region
12. Latin America Epilepsy Therapeutics Market Analysis and Forecast
12.1. Introduction
12.1.1. Key Findings
12.2. Market Value Forecast, by Product, 2017–2031
12.2.1. First Generation Epilepsy Therapeutics
12.2.2. Second Generation Epilepsy Therapeutics
12.2.3. Third Generation Epilepsy Therapeutics
12.3. Market Value Forecast, by Distribution Channel, 2017–2031
12.3.1. Hospital Pharmacies
12.3.2. Retail Pharmacies
12.3.3. Online Pharmacies
12.4. Market Value Forecast, by Country/Sub-region, 2017–2031
12.4.1. Brazil
12.4.2. Mexico
12.4.3. Rest of Latin America
12.5. Market Attractiveness Analysis
12.5.1. By Product
12.5.2. By Distribution Channel
12.5.3. By Country/Sub-region
13. Middle East & Africa Epilepsy Therapeutics Market Analysis and Forecast
13.1. Introduction
13.1.1. Key Findings
13.2. Market Value Forecast, by Product, 2017–2031
13.2.1. First Generation Epilepsy Therapeutics
13.2.2. Second Generation Epilepsy Therapeutics
13.2.3. Third Generation Epilepsy Therapeutics
13.3. Market Value Forecast, by Distribution Channel, 2017–2031
13.3.1. Hospital Pharmacies
13.3.2. Retail Pharmacies
13.3.3. Online Pharmacies
13.4. Market Value Forecast, by Country/Sub-region, 2017–2031
13.4.1. GCC Countries
13.4.2. South Africa
13.4.3. Israel
13.4.4. Rest of Middle East & Africa
13.5. Market Attractiveness Analysis
13.5.1. By Product
13.5.2. By Distribution Channel
13.5.3. By Country/Sub-region
14. Competition Landscape
14.1. Market Player – Competition Matrix (By Tier and Size of companies)
14.2. Market Share Analysis By Company (2018)
14.3. Company Profiles
14.3.1. Pfizer, Inc.
14.3.1.1. Company Overview (HQ, Business Segments, Employee Strength)
14.3.1.2. Company Financials
14.3.1.3. Growth Strategies
14.3.1.4. SWOT Analysis
14.3.2. UCB S.A.
14.3.2.1. Company Overview (HQ, Business Segments, Employee Strength)
14.3.2.2. Company Financials
14.3.2.3. Growth Strategies
14.3.2.4. SWOT Analysis
14.3.3. Bausch Health Companies Inc.
14.3.3.1. Company Overview (HQ, Business Segments, Employee Strength)
14.3.3.2. Company Financials
14.3.3.3. Growth Strategies
14.3.3.4. SWOT Analysis
14.3.4. Novartis AG
14.3.4.1. Company Overview (HQ, Business Segments, Employee Strength)
14.3.4.2. Company Financials
14.3.4.3. Growth Strategies
14.3.4.4. SWOT Analysis
14.3.5. GlaxoSmithKline plc.
14.3.5.1. Company Overview (HQ, Business Segments, Employee Strength)
14.3.5.2. Company Financials
14.3.5.3. Growth Strategies
14.3.5.4. SWOT Analysis
14.3.6. Teva Pharmaceutical Industries Ltd.
14.3.6.1. Company Overview (HQ, Business Segments, Employee Strength)
14.3.6.2. Company Financials
14.3.6.3. Growth Strategies
14.3.6.4. SWOT Analysis
14.3.7. Sunovion Pharmaceuticals Inc.
14.3.7.1. Company Overview (HQ, Business Segments, Employee Strength)
14.3.7.2. Company Financials
14.3.7.3. Growth Strategies
14.3.7.4. SWOT Analysis
14.3.8. Eisai Co., Ltd.
14.3.8.1. Company Overview (HQ, Business Segments, Employee Strength)
14.3.8.2. Company Financials
14.3.8.3. Growth Strategies
14.3.8.4. SWOT Analysis
14.3.9. Upsher-Smith Laboratories, LLC.
14.3.9.1. Company Overview (HQ, Business Segments, Employee Strength)
14.3.9.2. Company Financials
14.3.9.3. Growth Strategies
14.3.9.4. SWOT Analysis
14.3.10. Amneal Pharmaceuticals LLC.
14.3.10.1. Company Overview (HQ, Business Segments, Employee Strength)
14.3.10.2. Company Financials
14.3.10.3. Growth Strategies
14.3.10.4. SWOT Analysis
List of Tables
Table 01: Global Epilepsy Therapeutics Market Value (US$ Mn) Forecast, by Product, 2017–2031
Table 02: Global Epilepsy Therapeutics Market Value (US$ Mn) Forecast, by Distribution Channel, 2017–2031
Table 03: Global Epilepsy Therapeutics Market Value (US$ Mn) Forecast, by Region, 2017–2031
Table 04: North America Epilepsy Therapeutics Market Value (US$ Mn) Forecast, by Country, 2017–2031
Table 05: North America Epilepsy Therapeutics Market Value (US$ Mn) Forecast, by Product, 2017–2031
Table 06: North America Epilepsy Therapeutics Market Value (US$ Mn) Forecast, by Distribution Channel, 2017–2031
Table 07: Europe Epilepsy Therapeutics Market Value (US$ Mn) Forecast, by Country/Sub-region, 2017–2031
Table 08: Europe Epilepsy Therapeutics Market Value (US$ Mn) Forecast, by Product, 2017–2031
Table 09: Europe Epilepsy Therapeutics Market Value (US$ Mn) Forecast, by Distribution Channel, 2017–2031
Table 10: Asia Pacific Epilepsy Therapeutics Market Value (US$ Mn) Forecast, by Country/Sub-region, 2017–2031
Table 11: Asia Pacific Epilepsy Therapeutics Market Value (US$ Mn) Forecast, by Product, 2017–2031
Table 12: Asia Pacific Epilepsy Therapeutics Market Value (US$ Mn) Forecast, by Distribution Channel, 2017–2031
Table 13: Latin America Epilepsy Therapeutics Market Value (US$ Mn) Forecast, by Country/Sub-region, 2017–2031
Table 14: Latin America Epilepsy Therapeutics Market Value (US$ Mn) Forecast, by Product, 2017–2031
Table 15: Latin America Epilepsy Therapeutics Market Value (US$ Mn) Forecast, by Distribution Channel, 2017–2031
Table 16: Middle East & Africa Epilepsy Therapeutics Market Value (US$ Mn) Forecast, by Country/Sub-region, 2017–2031
Table 17: Middle East & Africa Epilepsy Therapeutics Market Value (US$ Mn) Forecast, by Product, 2017–2031
Table 18: Middle East & Africa Epilepsy Therapeutics Market Value (US$ Mn) Forecast, by Distribution Channel, 2017–2031
List of Figures
Figure 01: Global Epilepsy Therapeutics Market Size (US$ Mn) and Distribution, by Region, 2021 and 2031
Figure 02: Global Epilepsy Therapeutics Market Size (US$ Mn) and Distribution, by Segment, 2021 and 2031
Figure 03: Global Epilepsy Therapeutics Market Value (US$ Mn) Forecast and Y-o-Y Growth (%) Projection, 2017–2031
Figure 04: Global Epilepsy Therapeutics Market Value Share (%), by Product, 2018 and 2027
Figure 05: Global Epilepsy Therapeutics Market Value (US$ Mn) Forecast and Y-o-Y Growth (%) Projection, by First Generation Epilepsy Therapeutics, 2017–2031
Figure 06: Global Epilepsy Therapeutics Market Value (US$ Mn) Forecast and Y-o-Y Growth (%) Projection, by Second Generation Epilepsy Therapeutics, 2017–2031
Figure 07: Global Epilepsy Therapeutics Market Value (US$ Mn) Forecast and Y-o-Y Growth (%) Projection, by Third Generation Epilepsy Therapeutics, 2017–2031
Figure 08: Global Epilepsy Therapeutics Market Attractiveness Analysis, by Product, 2019–2027
Figure 09: Global Epilepsy Therapeutics Market Value Share, by Distribution Channel, 2018 and 2027
Figure 10: Global Epilepsy Therapeutics Market Attractiveness, by Distribution Channel, 2019–2027
Figure 11: Global Epilepsy Therapeutics Market Value (US$ Mn) and Y-o-Y Growth, by Hospital Pharmacies, 2017–2031
Figure 12: Global Epilepsy Therapeutics Market Value (US$ Mn) and Y-o-Y Growth, by Retail Pharmacies, 2017–2031
Figure 13: Global Epilepsy Therapeutics Market Value (US$ Mn) and Y-o-Y Growth, by Online Pharmacies, 2017–2031
Figure 14: Global Epilepsy Therapeutics Market Value Share, by Region, 2018 and 2027
Figure 15: Global Epilepsy Therapeutics Market Attractiveness, by Region, 2019–2027
Figure 16: North America Epilepsy Therapeutics Market Value (US$ Mn) Forecast and Y-o-Y Growth Projection (%), 2017–2031
Figure 17: North America Epilepsy Therapeutics Market Value Share (%), by Country, 2018 and 2027
Figure 18: North America Epilepsy Therapeutics Market Attractiveness, by Country, 2019–2027
Figure 19: North America Epilepsy Therapeutics Market Value Share, by Product, 2018 and 2027
Figure 20: North America Epilepsy Therapeutics Market Attractiveness, by Product, 2019–2027
Figure 21: North America Epilepsy Therapeutics Market Value Share Analysis, by Distribution Channel, 2018 and 2027
Figure 22: North America Epilepsy Therapeutics Market Attractiveness, by Distribution Channel, 2019–2027
Figure 23: Europe Epilepsy Therapeutics Market Value (US$ Mn) Forecast and Y-o-Y Growth Projection (%), 2017–2031
Figure 24: Europe Epilepsy Therapeutics Market Value Share (%), by Country / Sub-region, 2018 and 2027
Figure 25: Europe Epilepsy Therapeutics Market Attractiveness, by Country / Sub-region, 2019–2027
Figure 26: Europe Epilepsy Therapeutics Market Value Share, by Product, 2018 and 2027
Figure 27: Europe Epilepsy Therapeutics Market Attractiveness, by Product, 2019–2027
Figure 28: Europe Epilepsy Therapeutics Market Value Share Analysis, by Distribution Channel, 2018 and 2027
Figure 29: Europe Epilepsy Therapeutics Market Attractiveness, by Distribution Channel, 2019–2027
Figure 30: Asia Pacific Epilepsy Therapeutics Market Value (US$ Mn) Forecast and Y-o-Y Growth Projection (%), 2017–2031
Figure 31: Asia Pacific Epilepsy Therapeutics Market Value Share (%), by Country/Sub-region, 2018 and 2027
Figure 32: Asia Pacific Epilepsy Therapeutics Market Attractiveness, by Country/Sub-region, 2019–2027
Figure 33: Asia Pacific Epilepsy Therapeutics Market Value Share, by Product, 2018 and 2027
Figure 34: Asia Pacific Epilepsy Therapeutics Market Attractiveness, by Product, 2019–2027
Figure 35: Asia Pacific Epilepsy Therapeutics Market Value Share Analysis, by Distribution Channel, 2018 and 2027
Figure 36: Asia Pacific Epilepsy Therapeutics Market Attractiveness, by Distribution Channel, 2019–2027
Figure 37: Latin America Epilepsy Therapeutics Market Value (US$ Mn) Forecast and Y-o-Y Growth Projection (%), 2017–2031
Figure 38: Latin America Epilepsy Therapeutics Market Value Share (%), by Country / Sub-region, 2018 and 2027
Figure 39: Europe Epilepsy Therapeutics Market Attractiveness, by Country / Sub-region, 2019–2027
Figure 40: Latin America Epilepsy Therapeutics Market Value Share, by Product, 2018 and 2027
Figure 41: Latin America Epilepsy Therapeutics Market Attractiveness, by Product, 2019–2027
Figure 42: Latin America Epilepsy Therapeutics Market Value Share Analysis, by Distribution Channel, 2018 and 2027
Figure 43: Latin America Epilepsy Therapeutics Market Attractiveness, by Distribution Channel, 2019–2027
Figure 44: Middle East & Africa Epilepsy Therapeutics Market Value (US$ Mn) Forecast and Y-o-Y Growth Projection (%), 2017–2031
Figure 45: Middle East & Africa Epilepsy Therapeutics Market Value Share (%), by Country/Sub-region, 2018 and 2027
Figure 46: Middle East & Africa Epilepsy Therapeutics Market Attractiveness, by Country/Sub-region, 2019–2027
Figure 47: Middle East & Africa Epilepsy Therapeutics Market Value Share, by Product, 2018 and 2027
Figure 48: Middle East & Africa Epilepsy Therapeutics Market Attractiveness, by Product, 2019–2027
Figure 49: Middle East & Africa Epilepsy Therapeutics Market Value Share Analysis, by Distribution Channel, 2018 and 2027
Figure 50: Middle East & Africa Epilepsy Therapeutics Market Attractiveness, by Distribution Channel, 2019–2027
Figure 51: Pfizer, Inc. Revenue (US$ Mn) & Y-o-Y Growth (%), 2016–2018
Figure 52: Pfizer, Inc. R&D Expenses (US$ Mn) and Y-o-Y Growth (%), 2016–2018
Figure 53: Pfizer, Inc. Breakdown of Net Sales, by Geography 2018
Figure 54: Pfizer, Inc. Breakdown of Net Sales, by Business Segments (%), 2018
Figure 55: Bausch Health Companies Inc. Breakdown of Net Sales (%), by Region, 2017
Figure 56: Bausch Health Companies Inc. Revenue (US$ Mn) and Y-o-Y Growth (%), 2015–2017
Figure 57: Bausch Health Companies Inc. Breakdown of Revenue (%), by Product Category, 2017
Figure 58: Bausch Health Companies Inc. R&D Expenses (US$ Mn) and Y-o-Y Growth (%), 2015–2017
Figure 59: UCB, Inc. Breakdown of Net Sales, by Region 2018
Figure 60: UCB, Inc. Breakdown of Net Sales, by Therapeutic Area 2018
Figure 61: UCB, Inc. Revenue (US$ Bn) and Y-o-Y Growth (%), 2013–2018
Figure 62: UCB, Inc. R&D Intensity and Sales & Marketing Intensity - Company Level, 2017–2018
Figure 63: Novartis AG Breakdown of Net Sales, by Region, 2018
Figure 64: Novartis AG Breakdown of Net Sales, by Business Segment, 2018
Figure 65: Novartis AG Revenue (US$ Bn) and Y-o-Y Growth (%), 2015–2018
Figure 66: Novartis AG R&D Intensity and Sales & Marketing Intensity - Company Level, 2017–2018
Figure 67: GlaxoSmithKline plc. Sales Revenue (US$ Mn) & Y-o-Y Growth (%), 2016–2018
Figure 68: GlaxoSmithKline plc. Breakdown of R&D Expenditure (US$ Bn), 2016-2018
Figure 69: GlaxoSmithKline plc. Breakdown of Net Sales, by Region, 2018
Figure 70: GlaxoSmithKline plc. Breakdown of Net Sales, by Business Segments, 2018
Figure 71: Teva Pharmaceutical Industries Ltd. Revenue (US$ Mn) & Y-o-Y Growth (%), 2015–2018
Figure 72: Teva Pharmaceutical Industries Ltd. R&D Expenses (US$ Mn) and Y-o-Y Growth (%), 2015–2018
Figure 73: Sumitomo Dainippon Pharma Co., Ltd Pharmaceuticals Segment Revenue (US$ Mn) and Y-o-Y Growth (%), 2015–2017
Figure 74: Sumitomo Dainippon Pharma Co., Ltd Breakdown of Net Sales (%), by Region, 2017
Figure 75: Sumitomo Dainippon Pharma Co., Ltd R&D Expenses (US$ Mn) and Y-o-Y Growth (%), 2015–2017
Figure 76: Sumitomo Dainippon Pharma Co., Ltd Breakdown of Net Sales (%), by Product Segment, 2017
Figure 77: Eisai Co., Ltd., Revenue (US$ Mn) ,2017–2018
Figure 78: Eisai Co., Ltd., R&D Expenses (US$ Mn), 2017–2018
Figure 79: Eisai Co., Ltd., Breakdown of Net Sales (%), by Region, 2018
Figure 80: Sawai Pharmaceutical, Co.,Ltd., Revenue (US$ Mn), 2017–2018
Figure 81: Sawai Pharmaceutical, Co.,Ltd., Ltd, R&D Expenses (US$ Mn), 2017–2018
Figure 82: Sawai Pharmaceutical, Co.,Ltd., Breakdown of Net Sales (%), by Region, 2018
Figure 83: Amneal Pharmaceuticals LLC., Revenue (US$ Mn) & Y-o-Y Growth (%), 2016–2018
Figure 84: Amneal Pharmaceuticals LLC., R&D Expenses (US$ Mn) and Y-o-Y Growth (%), 2016–2018
Copyright © Transparency Market Research, Inc. All Rights reserved
Trust Online

Epilepsy Therapeutics Market