
Reports
Reports
Consumers are turning toward vitamin rich supplements to protect themselves from the novel coronavirus infection. Vitamin D, vitamin C, and zinc supplements are considered to boost the immune system. High-risk patients with vitamin D deficiency tend to increase their chances of contracting the COVID-19 virus. Companies in the energy supplements market are capitalizing on this opportunity to increase their production capabilities and establish long-term growth opportunities with energy gummies in the field of pediatrics.
Inexpensive and over-the-counter availability of energy supplements are translating into revenue streams. However, there is a lack of clinical evidence whether supplements help in full arsenal against COVID-19. Vitamin C-rich energy drinks are growing popular in the energy supplements market.
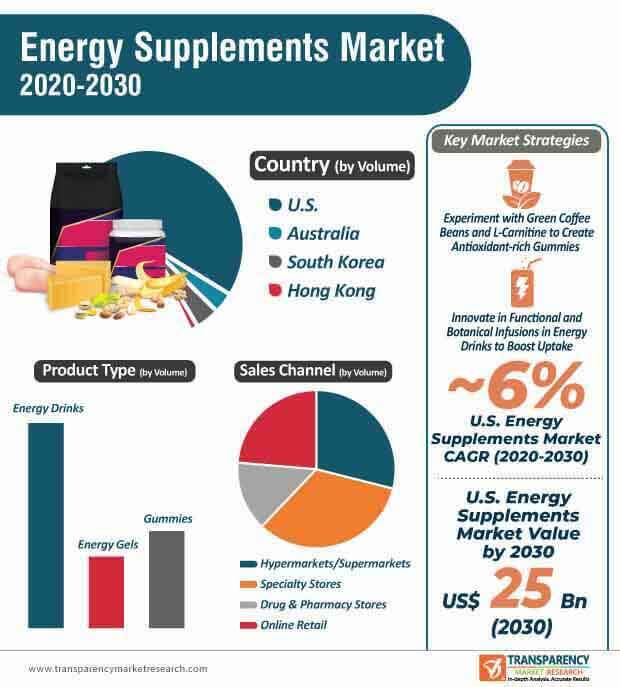
The energy supplements market is estimated to grow two-fold, since energy gummies are being highly publicized for weight management. Manufacturers are experimenting with different blends of elements such as green coffee beans, L-carnitine, and vitamin C to create gummies that are rich in antioxidants. The popular trend of the beach body weight management is creating business opportunities for manufacturers.
Antioxidants are associated with reducing weight by burning body fat at an accelerated rate. Health conscious consumers who exercise daily are turning toward energy gummies produced by manufacturers in the energy supplements market in order to uplift the mood and prevent fatigue in consumers.
Digital only initiatives and expansion of the eCommerce are acting as key drivers for the growth of the energy supplements market. Sugar-free energy drinks compounded with B-group vitamins, caffeine, and taurine are in high demand. Due to the issue of metal wastage, brands are now utilizing 100% recycled aluminum cans, which are bolstering the credibility credentials of environmentally conscious brands in the energy supplements market. Energy drink brands are using storage coolers and refrigerators that deliver energy and cost savings.
Top athletes, college students, business professionals, and travelers are emerging as key consumers of energy drinks. Companies are innovating in formulas that contain high quality ingredients and real sugars since consumers are becoming aware about clean labels.
Anti-GI (Gastrointestinal) formulas and a list of no preservatives, concentrates, and artificial flavors, among others, have become a prerequisite for energy gel innovations. The U.S.-based company Spring Energy is expanding its product portfolio in energy gels and energy drinks that are gut-friendly and offer optimum nutrition for running, swimming, and other sports activities.
Natural ingredients such as cassava, honey, and pea protein are gaining prominence in energy gels and energy drinks. Companies in the energy supplements market are focusing on improving their packaging to boost product uptake and visibility in retail stores. They are gaining a strong research base in extended energy release concepts to strike the right balance between the composition of carbohydrates and sugars.
Functional and botanical infusions in energy drinks are being preferred by consumers. Australia-based functional energy drink Kanguru has been launched in South Korea in order to replace conventional local tonic drinks that taste bitter and contain ginseng. Brands in the energy supplements market are going beyond just sugar and caffeine boost, and are exploring botanicals compounded with essential B-vitamins. Botanicals such as yerba mate, Schisandra, and green tea in energy drinks aid in reducing fatigue, improve endurance, and boost immunity.
Convenience stores are emerging as a starting point for startups in the energy supplements market to gauge consumer preferences and retail trends. These stores have high penetration in South Korea, thus creating lucrative business opportunities for energy drink manufacturers.
Analysts’ Viewpoint
Red Bull witnessed an increase in both retail value and volume sales in Hong Kong during the COVID-19 outbreak in 2020. Brands are catering to niche requirements of consumers, and are introducing energy gels and drinks rich in electrolytes. However, changing consumer preferences and market trends are creating production challenges for startups and manufacturers. Hence, companies in the energy supplements market should invest in long-term R&D activities to establish a sustained business model that adapts according to changing consumer demands with very little adjustments. Young business people, sports enthusiasts, and university students are key target customers for companies in the energy supplements market.
Energy Supplements Market: Overview
Energy Supplements: Market Frontrunners
Energy Supplements Market: Trends
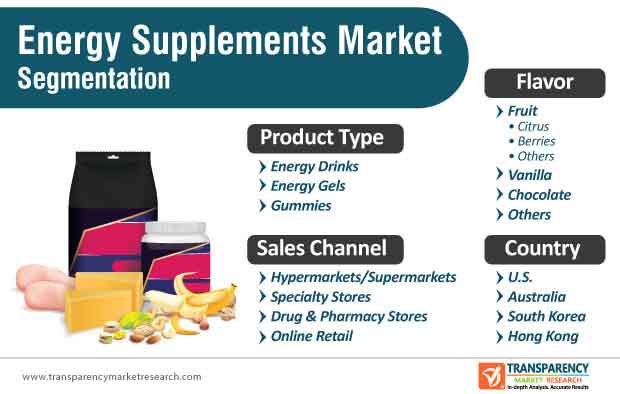
The flavor is the key component in food and beverage products, as it influences the taste, texture, and appearance of products. Energy supplements, including drinks, gummies, and gels are mostly made with plant-based and herbal ingredients such as caffeine, taurine, vitamins, etc. Thus, the flavor is the most important ingredient that affects the taste, color, and appearance of the final product. In recent years, consumer demand for natural and healthy flavors have increased. Additionally, fruit flavors contain many health beneficial nutrients, which is the key factor behind the increasing demand for fruit flavors in energy supplement products.
Energy Supplements Market: Strategies
Energy Supplements Market: Players
Energy Supplements Market is expected to Reach US$ 25.7 Bn by 2030
Energy Supplements Market is estimated to rise at a CAGR of 6% during forecast period
Increasing awareness about health and wellness in developing countries is expected to drive the Energy Supplements Market
North America is more attractive for vendors in the Energy Supplements Market
Key players of Energy Supplements Market are PepsiCo, Inc., Glanbia plc, GNC Holdings Inc, Monster Beverage Corporation, Herbalife Nutrition Ltd, Amway Melaleuca Inc, Forever Living, AdvoCare, USANA Health Sciences, Inc, Young Living Essential Oils, Vitaco Health Limited, DoTerra International, LLC, Nature's Sunshine Products, Inc, Red Bull, Herbaland, Seattle Gummy Company, GU Energy Labs
1. Executive Summary
1.1. Global Market Outlook
1.2. Demand Side Trends
1.3. Supply Side Trends
1.4. Analysis and Recommendations
2. Market Overview
2.1. Market Coverage / Taxonomy
2.2. Market Definition / Scope / Limitations
3. Key Market Trends
3.1. Key Trends Impacting the Market
3.2. Product Innovation / Development Trends
4. Key Success Factors
4.1. Product Adoption / Usage Analysis
4.2. Product USPs / Features
5. Global Energy Supplements Demand (in Value or Size in US$ Mn) Analysis 2015–2019 and Forecast, 2020–2030
5.1. Historical Market Value (US$ Mn) Analysis, 2015–2019
5.2. Current and Future Market Value (US$ Mn) Projections, 2020–2030
5.2.1. Y-o-Y Growth Trend Analysis
5.2.2. Absolute $ Opportunity Analysis
6. Market Background
6.1. Macro-Economic Factors
6.1.1. GDP Growth Outlook
6.1.2. Urbanization Growth Outlook
6.2. Impact of COVID-19 on Energy Supplements Market
6.2.1. Manufacturer/Processors
6.2.2. Supply Chain and Logistics
6.2.3. Wholesalers/Traders
6.2.4. Retailers
6.3. Impact of COVID-19 on the Economy
6.4. Impact of COVID-19 on the Nutraceuticals Industry
6.5. COVID-19 Risk Assessment/Impact
6.6. Nutraceuticals Industry Outlook
6.7. Dietary Supplement Market Overview
6.7.1. Dietary Supplement Market Snapshot
6.7.2. Dietary Supplement Market Positioning
6.8. Consumer Preference: Prevention over Treatment
6.9. Consumer Perception towards Healthy Lifestyle
6.10. Opportunities in Nutritional Supplements Industry
6.11. Opportunities for New Market Players in Asia-Pacific Dietary Supplement Market
6.12. Organic Dietary Supplements in U.S.
6.13. Quality Assurance for Dietary Supplement
6.14. Per Capita Expenditure on Health
6.15. Products offered by Key Players
6.16. Market Assessment based on Percentage of Demand
6.17. Slice and Dice Demographics by Decision Influencer
6.18. Key Energy Supplement Brands in the U.S.
6.19. Key Energy Supplement Brands in Australia
6.20. Key Energy Supplement Brands in Hong Kong
6.21. Key Energy Supplement Brands in South Korea
6.22. Top 50 Direct Selling Companies
6.23. Key Direct Selling Companies
6.24. Industry Value and Supply Chain Analysis
6.24.1. Profit Margin Analysis at each point of sales
6.24.1.1. Supplement Market Processors
6.24.1.2. Distributors/Suppliers/Wholesalers
6.24.1.3. Traders/Retailers
6.24.1.4. End-Users
6.25. Key Certifications/Claims
6.26. Key Regulations
6.27. Market Dynamics
6.27.1. Drivers
6.27.2. Restraints
6.27.3. Opportunity Analysis
6.28. Forecast Factors - Relevance & Impact
7. United States Energy Supplements Analysis 2015–2019 and Forecast 2020–2030
7.1. Introduction
7.2. Historical Market Size (US$ Mn) Trend Analysis By Market Taxonomy, 2015–2019
7.3. Market Size (US$ Mn) Forecast By Market Taxonomy, 2020–2030
7.3.1. By Product Type
7.3.2. By Flavor
7.3.3. By Sales Channel
7.4. Market Attractiveness Analysis
7.4.1. By Product Type
7.4.2. By Flavor
7.4.3. By Sales Channel
7.5. Drivers and Restraints - Impact Analysis
8. South Korea Energy Supplements Analysis 2015–2019 and Forecast 2020–2030
8.1. Introduction
8.2. Historical Market Size (US$ Mn) Trend Analysis By Market Taxonomy, 2015–2019
8.3. Market Size (US$ Mn) Forecast By Market Taxonomy, 2020–2030
8.3.1. By Product Type
8.3.2. By Flavor
8.3.3. By Sales Channel
8.4. Market Attractiveness Analysis
8.4.1. By Product Type
8.4.2. By Flavor
8.4.3. By Sales Channel
8.5. Drivers and Restraints - Impact Analysis
9. Hong Kong Energy Supplements Analysis 2015–2019 and Forecast 2020–2030
9.1. Introduction
9.2. Historical Market Size (US$ Mn) Trend Analysis By Market Taxonomy, 2015–2019
9.3. Market Size (US$ Mn) Forecast By Market Taxonomy, 2020–2030
9.3.1. By Product Type
9.3.2. By Flavor
9.3.3. By Sales Channel
9.4. Market Attractiveness Analysis
9.4.1. By Product Type
9.4.2. By Flavor
9.4.3. By Sales Channel
9.5. Drivers and Restraints - Impact Analysis
10. Australia Energy Supplements Analysis 2015–2019 and Forecast 2020–2030
10.1. Introduction
10.2. Historical Market Size (US$ Mn) Trend Analysis By Market Taxonomy, 2015–2019
10.3. Market Size (US$ Mn) Forecast By Market Taxonomy, 2020–2030
10.3.1. By Product Type
10.3.2. By Flavor
10.3.3. By Sales Channel
10.4. Market Attractiveness Analysis
10.4.1. By Product Type
10.4.2. By Flavor
10.4.3. By Sales Channel
10.5. Drivers and Restraints - Impact Analysis
11. Market Structure Analysis
11.1. Market Analysis by Tier of Companies
11.2. Market Concentration
11.3. Market Presence Analysis
12. Competition Analysis
12.1. Competition Dashboard
12.2. Competition Deep Dive
12.2.1. PepsiCo, Inc.
12.2.1.1. Overview
12.2.1.2. Product Portfolio
12.2.1.3. Sales Footprint
12.2.1.4. Key Developments/ Takeaways
12.2.1.5. Strategy Overview
12.2.2. Monster Beverage Corp.
12.2.2.1. Overview
12.2.2.2. Product Portfolio
12.2.2.3. Sales Footprint
12.2.2.4. Key Developments/ Takeaways
12.2.2.5. Strategy Overview
12.2.3. Herbalife Nutrition Ltd
12.2.3.1. Overview
12.2.3.2. Product Portfolio
12.2.3.3. Sales Footprint
12.2.3.4. Key Developments/ Takeaways
12.2.3.5. Strategy Overview
12.2.4. Glanbia plc
12.2.4.1. Overview
12.2.4.2. Product Portfolio
12.2.4.3. Sales Footprint
12.2.4.4. Key Developments/ Takeaways
12.2.4.5. Strategy Overview
12.2.5. GNC Holdings Inc.
12.2.5.1. Overview
12.2.5.2. Product Portfolio
12.2.5.3. Sales Footprint
12.2.5.4. Key Developments/ Takeaways
12.2.5.5. Strategy Overview
12.2.6. Red Bull
12.2.6.1. Overview
12.2.6.2. Product Portfolio
12.2.6.3. Sales Footprint
12.2.6.4. Key Developments/ Takeaways
12.2.6.5. Strategy Overview
12.2.7. Amway
12.2.7.1. Overview
12.2.7.2. Product Portfolio
12.2.7.3. Sales Footprint
12.2.7.4. Key Developments/ Takeaways
12.2.7.5. Strategy Overview
12.2.8. Melaleuca Inc.
12.2.8.1. Overview
12.2.8.2. Product Portfolio
12.2.8.3. Sales Footprint
12.2.8.4. Key Developments/ Takeaways
12.2.8.5. Strategy Overview
12.2.9. AdvoCare
12.2.9.1. Overview
12.2.9.2. Product Portfolio
12.2.9.3. Sales Footprint
12.2.9.4. Key Developments/ Takeaways
12.2.9.5. Strategy Overview
12.2.10. USANA Health Sciences, Inc.
12.2.10.1. Overview
12.2.10.2. Product Portfolio
12.2.10.3. Sales Footprint
12.2.10.4. Key Developments/ Takeaways
12.2.10.5. Strategy Overview
12.2.11. Young Living Essential Oils
12.2.11.1. Overview
12.2.11.2. Product Portfolio
12.2.11.3. Sales Footprint
12.2.11.4. Key Developments/ Takeaways
12.2.11.5. Strategy Overview
12.2.12. Nature's Sunshine Products, Inc.
12.2.12.1. Overview
12.2.12.2. Product Portfolio
12.2.12.3. Sales Footprint
12.2.12.4. Key Developments/ Takeaways
12.2.12.5. Strategy Overview
12.2.13. DoTerra International, LLC
12.2.13.1. Overview
12.2.13.2. Product Portfolio
12.2.13.3. Sales Footprint
12.2.13.4. Key Developments/ Takeaways
12.2.13.5. Strategy Overview
12.2.14. Living Essentials Marketing, LLC
12.2.14.1. Overview
12.2.14.2. Product Portfolio
12.2.14.3. Sales Footprint
12.2.14.4. Key Developments/ Takeaways
12.2.14.5. Strategy Overview
12.2.15. Forever Living
12.2.15.1. Overview
12.2.15.2. Product Portfolio
12.2.15.3. Sales Footprint
12.2.15.4. Key Developments/ Takeaways
12.2.15.5. Strategy Overview
12.2.16. Vitaco Health Limited
12.2.16.1. Overview
12.2.16.2. Product Portfolio
12.2.16.3. Sales Footprint
12.2.16.4. Key Developments/ Takeaways
12.2.16.5. Strategy Overview
12.2.17. Nu Skin Enterprises, Inc.
12.2.17.1. Overview
12.2.17.2. Product Portfolio
12.2.17.3. Sales Footprint
12.2.17.4. Key Developments/ Takeaways
12.2.17.5. Strategy Overview
12.2.18. ANS Group
12.2.18.1. Overview
12.2.18.2. Product Portfolio
12.2.18.3. Sales Footprint
12.2.18.4. Key Developments/ Takeaways
12.2.18.5. Strategy Overview
12.2.19. BIONUTRIGEN Co., Ltd.
12.2.19.1. Overview
12.2.19.2. Product Portfolio
12.2.19.3. Sales Footprint
12.2.19.4. Key Developments/ Takeaways
12.2.19.5. Strategy Overview
12.2.20. Life Nutrition
12.2.20.1. Overview
12.2.20.2. Product Portfolio
12.2.20.3. Sales Footprint
12.2.20.4. Key Developments/ Takeaways
12.2.20.5. Strategy Overview
12.2.21. Alovéa
12.2.21.1. Overview
12.2.21.2. Product Portfolio
12.2.21.3. Sales Footprint
12.2.21.4. Key Developments/ Takeaways
12.2.21.5. Strategy Overview
12.2.22. Boom Nutrition Inc.
12.2.22.1. Overview
12.2.22.2. Product Portfolio
12.2.22.3. Sales Footprint
12.2.22.4. Key Developments/ Takeaways
12.2.22.5. Strategy Overview
12.2.23. Herbaland
12.2.23.1. Overview
12.2.23.2. Product Portfolio
12.2.23.3. Sales Footprint
12.2.23.4. Key Developments/ Takeaways
12.2.23.5. Strategy Overview
12.2.24. Seattle Gummy Company
12.2.24.1. Overview
12.2.24.2. Product Portfolio
12.2.24.3. Sales Footprint
12.2.24.4. Key Developments/ Takeaways
12.2.24.5. Strategy Overview
12.2.25. GU Energy Labs
12.2.25.1. Overview
12.2.25.2. Product Portfolio
12.2.25.3. Sales Footprint
12.2.25.4. Key Developments/ Takeaways
12.2.25.5. Strategy Overview
12.2.26. Plexus
12.2.26.1. Overview
12.2.26.2. Product Portfolio
12.2.26.3. Sales Footprint
12.2.26.4. Key Developments/ Takeaways
12.2.26.5. Strategy Overview
12.2.27. Jeunesse, LLC
12.2.27.1. Overview
12.2.27.2. Product Portfolio
12.2.27.3. Sales Footprint
12.2.27.4. Key Developments/ Takeaways
12.2.27.5. Strategy Overview
12.2.28. Isagenix Worldwide, Inc.
12.2.28.1. Overview
12.2.28.2. Product Portfolio
12.2.28.3. Sales Footprint
12.2.28.4. Key Developments/ Takeaways
12.2.28.5. Strategy Overview
12.2.29. Arbonne International, LLC
12.2.29.1. Overview
12.2.29.2. Product Portfolio
12.2.29.3. Sales Footprint
12.2.29.4. Key Developments/ Takeaways
12.2.29.5. Strategy Overview
12.2.30. Shaklee Corporation
12.2.30.1. Overview
12.2.30.2. Product Portfolio
12.2.30.3. Sales Footprint
12.2.30.4. Key Developments/ Takeaways
12.2.30.5. Strategy Overview
13. Assumptions and Acronyms Used
14. Research Methodology
List of Tables
Table 01: U.S. Energy Supplements Market Value (US$ Mn) Analysis and Forecast By Product Type, 2015-2030
Table 02: U.S. Energy Supplements Market Volume (Tons) Analysis and Forecast By Flavor, 2015-2030
Table 03: U.S. Energy Supplements Market Volume (Tons) Analysis and Forecast By Fruit Segment, 2015-2030
Table 04: U.S. Energy Supplements Market Value (US$ Mn) Analysis and Forecast By Sales Channel, 2015-2030
Table 05: South Korea Energy Supplements Market Value (US$ Mn) Analysis and Forecast By Product Type, 2015-2030
Table 06: South Korea Energy Supplements Market Volume (Tons) Analysis and Forecast By Flavor, 2015-2030
Table 07: South Korea Energy Supplements Market Volume (Tons) Analysis and Forecast By Fruit Segment, 2015-2030
Table 08: South Korea Energy Supplements Market Value (US$ Mn) Analysis and Forecast By Sales Channel, 2015-2030
Table 09: Hong Kong Energy Supplements Market Value (US$ Mn) Analysis and Forecast By Product Type, 2015-2030
Table 10: Hong Kong Energy Supplements Market Volume (Tons) Analysis and Forecast By Flavor, 2015-2030
Table 11: Hong Kong Energy Supplements Market Volume (Tons) Analysis and Forecast By Fruit Segment, 2015-2030
Table 12: Hong Kong Energy Supplements Market Value (US$ Mn) Analysis and Forecast By Sales Channel, 2015-2030
Table 13: Australia Energy Supplements Market Value (US$ Mn) Analysis and Forecast By Product Type, 2015-2030
Table 14: Australia Energy Supplements Market Volume (Tons) Analysis and Forecast By Flavor, 2015-2030
Table 15: Australia Energy Supplements Market Volume (Tons) Analysis and Forecast By Fruit Segment, 2015-2030
Table 16: Australia Energy Supplements Market Value (US$ Mn) Analysis and Forecast By Sales Channel, 2015-2030
List of Figures
Figure 01: U.S. Energy Supplements Market Value (US$ Mn) Forecast, 2020–2030
Figure 02: Australia Energy Supplements Market Volume (US$ Mn) Forecast, 2020–2030
Figure 03: Hong Kong Energy Supplements Market Value (US$ Mn) Forecast, 2020–2030
Figure 04: South Korea Energy Supplements Market Volume (US$ Mn) Forecast, 2020–2030
Figure 05: U.S. Energy Supplements Market Value Share Analysis by Product Type, 2020 E
Figure 06: U.S. Energy Supplements Market Value (US$ Mn) Analysis & Forecast by Product Type, 2020–2030
Figure 07: U.S. Energy Supplements Market Value Share Analysis By Flavor, 2020 E
Figure 08: U.S. Energy Supplements Market Y-o-Y Growth Rate By Flavor, 2020-2030
Figure 09: U.S. Energy Supplements Market Value Share Analysis By Sales Channel, 2020 E
Figure 10: U.S. Energy Supplements Market Y-o-Y Growth Rate By Sales Channel, 2020-2030
Figure 11: South Korea Energy Supplements Market Value Share Analysis by Product Type, 2020 E
Figure 12: South Korea Energy Supplements Market Value (US$ Mn) Analysis & Forecast by Product Type, 2020–2030
Figure 13: South Korea Energy Supplements Market Value Share Analysis By Flavor, 2020 E
Figure 14: South Korea Energy Supplements Market Y-o-Y Growth Rate By Flavor, 2020-2030
Figure 15: South Korea Energy Supplements Market Value Share Analysis By Sales Channel, 2020 E
Figure 16: South Korea Energy Supplements Market Y-o-Y Growth Rate By Sales Channel, 2020-2030
Figure 17: Hong Kong Energy Supplements Market Value Share Analysis by Product Type, 2020 E
Figure 18: Hong Kong Energy Supplements Market Value (US$ Mn) Analysis & Forecast by Product Type, 2020–2030
Figure 19: Hong Kong Energy Supplements Market Value Share Analysis By Flavor, 2020 E
Figure 20: Hong Kong Energy Supplements Market Y-o-Y Growth Rate By Flavor, 2020-2030
Figure 21: Hong Kong Energy Supplements Market Value Share Analysis By Sales Channel, 2020 E
Figure 22: Hong Kong Energy Supplements Market Y-o-Y Growth Rate By Sales Channel, 2020-2030
Figure 23: Australia Energy Supplements Market Value Share Analysis by Product Type, 2020 E
Figure 24: Australia Energy Supplements Market Value (US$ Mn) Analysis & Forecast by Product Type, 2020–2030
Figure 25: Australia Energy Supplements Market Value Share Analysis By Flavor, 2020 E
Figure 26: Australia Energy Supplements Market Y-o-Y Growth Rate By Flavor, 2020-2030
Figure 27: Australia Energy Supplements Market Value Share Analysis By Sales Channel, 2020 E
Figure 28: Australia Energy Supplements Market Y-o-Y Growth Rate By Sales Channel, 2020-2030
Copyright © Transparency Market Research, Inc. All Rights reserved
Trust Online

Energy Supplements Market