
Reports
Reports
Improvements in overall economic growth of developed and developing economies in North America and Asia Pacific are anticipated to fuel the growth for the distribution board market. Startup culture and business opportunities in niche markets are boosting the application of distribution boards in the rapidly growing commercial sector. As such, commercial accounts for the second-highest revenue among end users in the distribution board market. It is estimated to reach a value of ~US$ 2 Bn by 2027. Hence, manufacturers are increasingly focusing on meeting the demands of stakeholders in the commercial sector.
Moreover, manufacturers are increasing their production capacities to make customizable distribution boards available, since the commercial sector is projected for exponential growth during the forecast period. Apart from focusing on portfolio expansion in boards, manufacturers are increasing the production of fuse links, switches, and bypass equipment to meet end user requirements for safe and reliable electricity supply. Efforts are being made by manufacturers to meet local regulations that govern electrical load requirements in the commercial space.
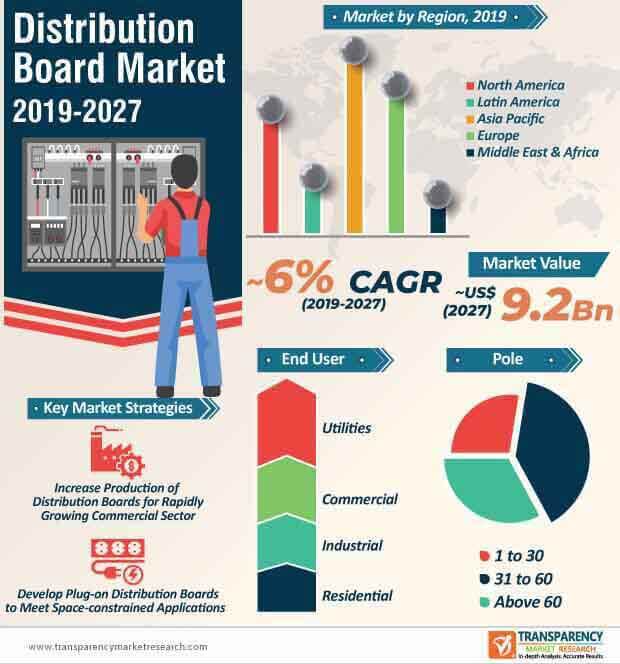
The concept of smart electricity distribution is engulfing the distribution board market in China. Likewise, Asia Pacific dominates the distribution board market in terms of revenue, and is expected to reach an estimated value of ~US$ 3.2 Bn by 2027. Hence, manufacturers are increasing their focus on understanding the unmet needs of end users in China.
Manufacturers are introducing smart electricity distribution products in China. For instance, in November 2019, leading supplier of electrification products ABB, announced the launch of their new workshops to deliver smart electrical distribution products to end users in China. Growing demand for efficient energy distribution solutions is catalyzing growth of the China distribution board market. Rapid economic development of China is gaining the attention of leading manufacturers. Safer and reliable power distribution boards are increasingly supporting the entire electrical value chain.
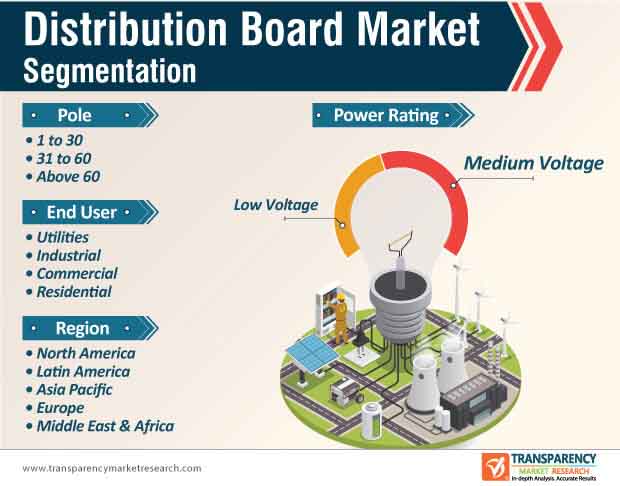
Companies are aiming to diversify their product portfolios to fulfil medium and low voltage distribution requirements. As such, applications for medium voltage are predicted to be on the rise during the forecast period. The medium voltage segment holds a higher revenue share as compared to the low voltage segment in the distribution board market, and is projected to reach a value of ~US$ 5.1 Bn by 2027.
Innovations in circuit breakers act as key drivers for the distribution board market. New digital circuit breakers are pervasively replacing mechanical breakers in various electricity management applications. For instance, Atom Power - the creator of solid-state power distribution ecosystem, revealed first-of-its-kind UL (Underwriters Laboratories) – a certified digital circuit breaker to meet consumer safety.
Though residential might not be the leading end user in the distribution board market, it holds a significant revenue in the market landscape. The uptake of renewable energy solutions is seen as a key trend in the residential sector. However, the static nature of conventional distribution boards leads to complications in switching between renewables and grid-centralized electrical sources. This challenge poses as a restraint for the widespread adoption of renewables in the residential space. Hence, manufacturers are introducing digital circuit breakers to overcome the limitations of mechanical circuit breakers.
Digital circuit breakers are a novel addition in the distribution board market landscape, since they aid in simplified and faster power management as compared to mechanical breakers.
The distribution board market is witnessing change with the integration of IT and OT (Operational Technology) in various sectors and domains. End users are combining IT and OT to improve the distribution system performance. Distribution board manufacturers are aiming to enhance organizational performance by offering increased customer satisfaction. Leading companies are increasing efforts to enhance system efficiency and reliability.
Integration of IT/OT is creating incremental opportunities for manufacturers. Enterprise resource planning and mobile workforce management are only a few of the IT applications that are triggering the demand for efficient distribution boards. However, operational control of assets in the electric network in real time are steering market growth. Thus, electric distribution systems are becoming increasingly mainstream in OT intelligence for voltage regulators.
Analysts’ Viewpoint
Manufacturers are increasing their efficacy in digital and connected innovations to transform utility and industrial electric infrastructure. As such, among end users, the utilities segment is leading the distribution board market and is expected to reach a value of ~US$ 2.8 Bn by 2022.
However, high incidence rate of electrical hazard accidents due to mechanical circuit breakers is likely to impede growth of the market for distribution boards. Hence, manufacturers are introducing novel digital circuit breakers that overcome limitations of conventional circuit breakers. Companies should increase efficacy in the development of plug-on distribution boards to address space-constrained requirements of end users. They should tap opportunities in renewables and next-gen power grids to broaden their scope of revenue sources.
Distribution Board Market: Overview
Distribution Board Market: Key Drivers
Distribution Board Market: Opportunities
Distribution Board Market: Major Developments
Distribution Board Market: Key Segment
Asia Pacific Dominates Global Distribution Board Market
Competition Landscape
Distribution Board Market is projected to reach US$ 9.2 Bn by the end of 2027
Distribution Board Market is expected to grow at a CAGR of 6% during 2019 – 2027
The utilities sector is investing significantly in electricity distribution & transition to cater to this demand is expected to drive the distribution board market during the forecast period
Asia Pacific is a more attractive region for vendors in the Distribution Board Market
Key vendors in the Distribution Board Market are Hager Group, Legrand, Siemens AG, ABB, Schneider Electric, Eaton, General Electric, LARSEN & TOUBRO LIMITED, Havells India Ltd, East Coast Power Systems, etc
1. Preface
1.1. Report Scope and Market Segmentation
1.2. Research Highlights
2. Assumptions and Research Methodology
2.1. Report Assumptions
2.2. Secondary Sources and Acronyms Used
2.3. Research Methodology
3. Executive Summary
3.1. Market Snapshot
3.2. Top Trends
4. Market Overview
4.1. Introduction
4.2. Market Indicators
4.3. Drivers and Restraints Snapshot Analysis
4.3.1. Drivers
4.3.2. Restraints
4.3.3. Opportunities
4.4. Global Distribution Board Market Outlook
4.5. Porter's Five Forces Analysis
4.5.1. Threat of Substitutes
4.5.2. Bargaining Power of Buyers
4.5.3. Bargaining Power of Suppliers
4.5.4. Threat of New Entrants
4.5.5. Degree of Competition
4.6. Value Chain Analysis
4.7. Regulatory Scenario
4.8. List of Key Manufacturers/Suppliers
5. Distribution Board Import & Export Analysis, by Key Country (HS Code: 853710)
6. Global Distribution Board Market Analysis, by Power Rating
6.1. Introduction
6.2. Key Findings
6.3. Global Distribution Board Market Value (US$ Mn) Analysis & Forecast, by Power Rating, 2018–2027
6.3.1. Global Distribution Board Market Value (US$ Mn) Forecast, by Low Voltage, 2018–2027
6.3.2. Global Distribution Board Market Value (US$ Mn) Forecast, by Medium Voltage, 2018–2027
6.4. Global Distribution Board Market Attractiveness Analysis, by Power Rating
7. Global Distribution Board Market Analysis, by Pole
7.1. Introduction
7.2. Key Findings
7.3. Global Distribution Board Market Value (US$ Mn) Analysis & Forecast, by Pole, 2018–2027
7.3.1. Global Distribution Board Market Value (US$ Mn) Forecast, by 1 to 30, 2018–2027
7.3.2. Global Distribution Board Market Value (US$ Mn) Forecast, by 31 to 60, 2018–2027
7.3.3. Global Distribution Board Market Value (US$ Mn) Forecast, by Above 60, 2018–2027
7.4. Global Distribution Board Market Attractiveness Analysis, by Pole
8. Global Distribution Board Market Analysis, by End-user
8.1. Introduction
8.2. Key Findings
8.3. Global Distribution Board Market Value (US$ Mn) Analysis & Forecast, by End-user, 2018–2027
8.3.1. Global Distribution Board Market Value (US$ Mn) Forecast, by Utilities, 2018–2027
8.3.2. Global Distribution Board Market Value (US$ Mn) Forecast, by Industrial, 2018–2027
8.3.3. Global Distribution Board Market Value (US$ Mn) Forecast, by Commercial, 2018–2027
8.3.4. Global Distribution Board Market Value (US$ Mn) Forecast, by Residential, 2018–2027
8.4. Global Distribution Board Market Attractiveness Analysis, by End-user
9. Global Distribution Board Market Analysis, by Region, 2018–2027
9.1. Key Findings
9.2. Global Distribution Board Market Value (US$ Mn) Analysis & Forecast, by Region, 2018–2027
9.2.1. North America
9.2.2. Europe
9.2.3. Asia Pacific
9.2.4. Latin America
9.2.5. Middle East & Africa
9.3. Global Distribution Board Market Attractiveness Analysis, by Region
10. North America Distribution Board Market Analysis, 2018–2027
10.1. Key Findings
10.2. North America Distribution Board Market Value (US$ Mn) Analysis & Forecast, by Power Rating, 2018–2027
10.3. North America Distribution Board Market Value (US$ Mn) Analysis & Forecast, by Pole, 2018–2027
10.4. North America Distribution Board Market Value (US$ Mn) Analysis & Forecast, by End-user, 2018–2027
10.5. North America Distribution Board Market Value (US$ Mn) Analysis & Forecast, by Country, 2018–2027
10.5.1. U.S. Distribution Board Market Value (US$ Mn) Forecast, by Power Rating, 2018–2027
10.5.2. U.S. Distribution Board Market Value (US$ Mn) Forecast, by Pole, 2018–2027
10.5.3. U.S. Distribution Board Market Value (US$ Mn) Forecast, by End-user, 2018–2027
10.5.4. Canada Distribution Board Market Value (US$ Mn) Forecast, by Power Rating, 2018–2027
10.5.5. Canada Distribution Board Market Value (US$ Mn) Forecast, by Pole, 2018–2027
10.5.6. Canada Distribution Board Market Value (US$ Mn) Forecast, by End-user, 2018–2027
10.6. North America Distribution Board Market Attractiveness Analysis, by Power Rating
10.7. North America Distribution Board Market Attractiveness Analysis, by Pole
10.8. North America Distribution Board Market Attractiveness Analysis, by End-user
10.9. North America Distribution Board Market Attractiveness Analysis, by Country
11. Europe Distribution Board Market Analysis, 2018–2027
11.1. Key Findings
11.2. Europe Distribution Board Market Value (US$ Mn) Analysis & Forecast, by Power Rating, 2018–2027
11.3. Europe Distribution Board Market Value (US$ Mn) Analysis & Forecast, by Pole, 2018–2027
11.4. Europe Distribution Board Market Value (US$ Mn) Analysis & Forecast, by End-user, 2018–2027
11.5. Europe Distribution Board Market Value (US$ Mn) Analysis & Forecast, by Country and Sub-region, 2018–2027
11.5.1. Germany Distribution Board Market Value (US$ Mn) Forecast, by Power Rating, 2018–2027
11.5.2. Germany Distribution Board Market Value (US$ Mn) Forecast, by Pole, 2018–2027
11.5.3. Germany Distribution Board Market Value (US$ Mn) Forecast, by End-user, 2018–2027
11.5.4. U.K. Distribution Board Market Value (US$ Mn) Forecast, by Power Rating, 2018–2027
11.5.5. U.K. Distribution Board Market Value (US$ Mn) Forecast, by Pole, 2018–2027
11.5.6. U.K. Distribution Board Market Value (US$ Mn) Forecast, by End-user, 2018–2027
11.5.7. France Distribution Board Market Value (US$ Mn) Forecast, by Power Rating, 2018–2027
11.5.8. France Distribution Board Market Value (US$ Mn) Forecast, by Pole, 2018–2027
11.5.9. France Distribution Board Market Value (US$ Mn) Forecast, by End-user, 2018–2027
11.5.10. Italy Distribution Board Market Value (US$ Mn) Forecast, by Power Rating, 2018–2027
11.5.11. Italy Distribution Board Market Value (US$ Mn) Forecast, by Pole, 2018–2027
11.5.12. Italy Distribution Board Market Value (US$ Mn) Forecast, by End-user, 2018–2027
11.5.13. Spain Distribution Board Market Value (US$ Mn) Forecast, by Power Rating, 2018–2027
11.5.14. Spain Distribution Board Market Value (US$ Mn) Forecast, by Pole, 2018–2027
11.5.15. Spain Distribution Board Market Value (US$ Mn) Forecast, by End-user, 2018–2027
11.5.16. Russia & CIS Distribution Board Market Value (US$ Mn) Forecast, by Power Rating, 2018–2027
11.5.17. Russia & CIS Distribution Board Market Value (US$ Mn) Forecast, by Pole, 2018–2027
11.5.18. Russia & CIS Distribution Board Market Value (US$ Mn) Forecast, by End-user, 2018–2027
11.5.19. Norway Distribution Board Market Value (US$ Mn) Forecast, by Power Rating, 2018–2027
11.5.20. Norway Distribution Board Market Value (US$ Mn) Forecast, by Pole, 2018–2027
11.5.21. Norway Distribution Board Market Value (US$ Mn) Forecast, by End-user, 2018–2027
11.5.22. Rest of Europe Distribution Board Market Value (US$ Mn) Forecast, by Power Rating, 2018–2027
11.5.23. Rest of Europe Distribution Board Market Value (US$ Mn) Forecast, by Pole, 2018–2027
11.5.24. Rest of Europe Distribution Board Market Value (US$ Mn) Forecast, by End-user, 2018–2027
11.6. Europe Distribution Board Market Attractiveness Analysis, by Power Rating
11.7. Europe Distribution Board Market Attractiveness Analysis, by Pole
11.8. Europe Distribution Board Market Attractiveness Analysis, by End-user
11.9. Europe Distribution Board Market Attractiveness Analysis, by Country and Sub-region
12. Asia Pacific Distribution Board Market Analysis, 2018–2027
12.1. Key Findings
12.2. Asia Pacific Distribution Board Market Value (US$ Mn) Analysis & Forecast, by Power Rating, 2018–2027
12.3. Asia Pacific Distribution Board Market Value (US$ Mn) Analysis & Forecast, by Pole, 2018–2027
12.4. Asia Pacific Distribution Board Market Value (US$ Mn) Analysis & Forecast, by End-user, 2018–2027
12.5. Asia Pacific Distribution Board Market Value (US$ Mn) Analysis & Forecast, by Country and Sub-region, 2018–2027
12.5.1. China Distribution Board Market Value (US$ Mn) Forecast, by Power Rating, 2018–2027
12.5.2. China Distribution Board Market Value (US$ Mn) Forecast, by Pole, 2018–2027
12.5.3. China Distribution Board Market Value (US$ Mn) Forecast, by End-user, 2018–2027
12.5.4. Japan Distribution Board Market Value (US$ Mn) Forecast, by Power Rating, 2018–2027
12.5.5. Japan Distribution Board Market Value (US$ Mn) Forecast, by Pole, 2018–2027
12.5.6. Japan Distribution Board Market Value (US$ Mn) Forecast, by End-user, 2018–2027
12.5.7. India Distribution Board Market Value (US$ Mn) Forecast, by Power Rating, 2018–2027
12.5.8. India Distribution Board Market Value (US$ Mn) Forecast, by Pole, 2018–2027
12.5.9. India Distribution Board Market Value (US$ Mn) Forecast, by End-user, 2018–2027
12.5.10. ASEAN Distribution Board Market Value (US$ Mn) Forecast, by Power Rating, 2018–2027
12.5.11. ASEAN Distribution Board Market Value (US$ Mn) Forecast, by Pole, 2018–2027
12.5.12. ASEAN Distribution Board Market Value (US$ Mn) Forecast, by End-user, 2018–2027
12.5.13. Rest of Asia Pacific Distribution Board Market Value (US$ Mn) Forecast, by Power Rating, 2018–2027
12.5.14. Rest of Asia Pacific Distribution Board Market Value (US$ Mn) Forecast, by Pole, 2018–2027
12.5.15. Rest of Asia Pacific Distribution Board Market Value (US$ Mn) Forecast, by End-user, 2018–2027
12.6. Asia Pacific Distribution Board Market Attractiveness Analysis, by Power Rating
12.7. Asia Pacific Distribution Board Market Attractiveness Analysis, by Pole
12.8. Asia Pacific Distribution Board Market Attractiveness Analysis, by End-user
12.9. Asia Pacific Distribution Board Market Attractiveness Analysis, by Country and Sub-region
13. Latin America Distribution Board Market Analysis, 2018–2027
13.1. Key Findings
13.2. Latin America Distribution Board Market Value (US$ Mn) Analysis & Forecast, by Power Rating, 2018–2027
13.3. Latin America Distribution Board Market Value (US$ Mn) Analysis & Forecast, by Pole, 2018–2027
13.4. Latin America Distribution Board Market Value (US$ Mn) Analysis & Forecast, by End-user, 2018–2027
13.5. Latin America Distribution Board Market Value (US$ Mn) Analysis & Forecast, by Country and Sub-region, 2018–2027
13.5.1. Brazil Distribution Board Market Value (US$ Mn) Forecast, by Power Rating, 2018–2027
13.5.2. Brazil Distribution Board Market Value (US$ Mn) Forecast, by Pole, 2018–2027
13.5.3. Brazil Distribution Board Market Value (US$ Mn) Forecast, by End-user, 2018–2027
13.5.4. Mexico Distribution Board Market Value (US$ Mn) Forecast, by Power Rating, 2018–2027
13.5.5. Mexico Distribution Board Market Value (US$ Mn) Forecast, by Pole, 2018–2027
13.5.6. Mexico Distribution Board Market Value (US$ Mn) Forecast, by End-user, 2018–2027
13.5.7. Rest of Latin America Distribution Board Market Value (US$ Mn) Forecast, by Power Rating, 2018–2027
13.5.8. Rest of Latin America Distribution Board Market Value (US$ Mn) Forecast, by Pole, 2018–2027
13.5.9. Rest of Latin America Distribution Board Market Value (US$ Mn) Forecast, by End-user, 2018–2027
13.6. Latin America Distribution Board Market Attractiveness Analysis, by Power Rating
13.7. Latin America Distribution Board Market Attractiveness Analysis, by Pole
13.8. Latin America Distribution Board Market Attractiveness Analysis, by End-user
13.9. Latin America Distribution Board Market Attractiveness Analysis, by Country and Sub-region
14. Middle East & Africa Distribution Board Market Analysis, 2018–2027
14.1. Key Findings
14.2. Middle East & Africa Distribution Board Market Value (US$ Mn) Analysis & Forecast, by Power Rating, 2018–2027
14.3. Middle East & Africa Distribution Board Market Value (US$ Mn) Analysis & Forecast, by Pole, 2018–2027
14.4. Middle East & Africa Distribution Board Market Value (US$ Mn) Analysis & Forecast, by End-user, 2018–2027
14.5. Middle East & Africa Distribution Board Market Value (US$ Mn) Analysis & Forecast, by Country and Sub-region, 2018–2027
14.5.1. GCC Distribution Board Market Value (US$ Mn) Forecast, by Power Rating, 2018–2027
14.5.2. GCC Distribution Board Market Value (US$ Mn) Forecast, by Pole, 2018–2027
14.5.3. GCC Distribution Board Market Value (US$ Mn) Forecast, by End-user, 2018–2027
14.5.4. South Africa Distribution Board Market Value (US$ Mn) Forecast, by Power Rating, 2018–2027
14.5.5. South Africa Distribution Board Market Value (US$ Mn) Forecast, by Pole, 2018–2027
14.5.6. South Africa Distribution Board Market Value (US$ Mn) Forecast, by End-user, 2018–2027
14.5.7. Rest of Middle East & Africa Distribution Board Market Value (US$ Mn) Forecast, by Power Rating, 2018–2027
14.5.8. Rest of Middle East & Africa Distribution Board Market Value (US$ Mn) Forecast, by Pole, 2018–2027
14.5.9. Rest of Middle East & Africa Distribution Board Market Value (US$ Mn) Forecast, by End-user, 2018–2027
14.6. Middle East & Africa Distribution Board Market Attractiveness Analysis, by Power Rating
14.7. Middle East & Africa Distribution Board Market Attractiveness Analysis, by Pole
14.8. Middle East & Africa Distribution Board Market Attractiveness Analysis, by End-user
14.9. Middle East & Africa Distribution Board Market Attractiveness Analysis, by Country and Sub-region
15. Competition Landscape
15.1. Global Distribution Board Market Share Analysis, by Company (2018)
15.2. Competition Matrix
15.2.1. ABB
15.2.2. Schneider Electric
15.3. Market Footprint Analysis
15.3.1. by Power Rating
15.3.2. by End-user
15.3.3. by Pole
15.4. Company Profiles
15.4.1. Hager Group
15.4.1.1. Company Details
15.4.1.2. Company Description
15.4.1.3. Business Overview
15.4.1.4. Financial Overview
15.4.1.5. Recent Developments
15.4.2. Legrand
15.4.2.1. Company Details
15.4.2.2. Company Description
15.4.2.3. Business Overview
15.4.2.4. Financial Overview
15.4.2.5. Recent Developments
15.4.3. Siemens
15.4.3.1. Company Details
15.4.3.2. Company Description
15.4.3.3. Business Overview
15.4.3.4. Financial Overview
15.4.3.5. Recent Developments
15.4.4. ABB
15.4.4.1. Company Details
15.4.4.2. Company Description
15.4.4.3. Business Overview
15.4.4.4. Financial Overview
15.4.4.5. Recent Development
15.4.5. Schneider Electric
15.4.5.1. Company Details
15.4.5.2. Company Description
15.4.5.3. Business Overview
15.4.5.4. Financial Overview
15.4.5.5. Recent Development
15.4.6. Eaton
15.4.6.1. Company Details
15.4.6.2. Company Description
15.4.6.3. Business Overview
15.4.6.4. Financial Overview
15.4.6.5. Recent Development
15.4.7. General Electric
15.4.7.1. Company Details
15.4.7.2. Company Description
15.4.7.3. Business Overview
15.4.7.4. Financial Overview
15.4.7.5. Recent Development
15.4.8. LARSEN & TOUBRO LIMITED
15.4.8.1. Company Details
15.4.8.2. Company Description
15.4.8.3. Business Overview
15.4.8.4. Financial Overview
15.4.8.5. Recent Development
15.4.9. Havells India Ltd
15.4.9.1. Company Details
15.4.9.2. Company Description
15.4.9.3. Business Overview
15.4.9.4. Financial Overview
15.4.9.5. Recent Development
15.4.10. East Coast Power Systems
15.4.10.1. Company Details
15.4.10.2. Company Description
15.4.10.3. Business Overview
15.4.11. INDUSTRIAL ELECTRIC MFG.
15.4.11.1. Company Details
15.4.11.2. Company Description
15.4.11.3. Business Overview
15.4.12. Arabian Gulf Switchgear
15.4.12.1. Company Details
15.4.12.2. Company Description
15.4.12.3. Business Overview
15.4.13. OEZ
15.4.13.1. Company Details
15.4.13.2. Company Description
15.4.13.3. Business Overview
15.4.14. ESL Power System
15.4.14.1. Company Details
15.4.14.2. Company Description
15.4.14.3. Business Overview
15.4.15. INDU-ELECTRIC Gerber GmbH
15.4.15.1. Company Details
15.4.15.2. Company Description
15.4.15.3. Business Overview
15.4.16. Blakley Electrics
15.4.16.1. Company Details
15.4.16.2. Company Description
15.4.16.3. Business Overview
16. Primary Research – Key Insights
List of Tables
Table 01: Global Distribution Board Market Value (US$ Mn) Forecast, by Pole, 2018–2027
Table 02: Global Distribution Board Market Value (US$ Mn) Forecast, by Power Rating, 2018–2027
Table 03: Global Distribution Board Market Value (US$ Mn) Forecast, by End-user, 2018–2027
Table 04: Global Distribution Board Market Value (US$ Mn) Forecast, by Region, 2018–2027
Table 05: North America Distribution Board Market Value (US$ Mn) Forecast, by Country, 2018–2027
Table 06: North America Distribution Board Market Value (US$ Mn) Forecast, by Power Rating, 2018–2027
Table 07: North America Distribution Board Market Value (US$ Mn) Forecast, by Pole, 2018–2027
Table 08: North America Distribution Board Market Value (US$ Mn) Forecast, by End-user, 2018–2027
Table 09: U.S. Distribution Board Market Value (US$ Mn) Forecast, by Power Rating, 2018–2027
Table 10: U.S. Distribution Board Market Value (US$ Mn) Forecast, by Pole, 2018–2027
Table 11: U.S. Distribution Board Market Value (US$ Mn) Forecast, by End-user, 2018–2027
Table 12: Canada Distribution Board Market Value (US$ Mn) Forecast, by Power Rating, 2018–2027
Table 13: Canada Distribution Board Market Value (US$ Mn) Forecast, by Pole, 2018–2027
Table 14: Canada Distribution Board Market Value (US$ Mn) Forecast, by End-user, 2018–2027
Table 15: Europe Distribution Board Market Value (US$ Mn) Forecast, by Country and Sub-region, 2018–2027
Table 16: Europe Distribution Board Market Value (US$ Mn) Forecast, by Power Rating, 2018–2027
Table 17: Europe Distribution Board Market Value (US$ Mn) Forecast, by Pole, 2018–2027
Table 18: Europe Distribution Board Market Value (US$ Mn) Forecast, by End-user, 2018–2027
Table 19: Germany Distribution Board Market Value (US$ Mn) Forecast, by Power Rating, 2018–2027
Table 20: Germany Distribution Board Market Value (US$ Mn) Forecast, by Pole, 2018–2027
Table 21: Germany Distribution Board Market Value (US$ Mn) Forecast, by End-user, 2018–2027
Table 22: U.K. Distribution Board Market Value (US$ Mn) Forecast, by Power Rating, 2018–2027
Table 23: U.K. Distribution Board Market Value (US$ Mn) Forecast, by Pole, 2018–2027
Table 24: U.K. Distribution Board Market Value (US$ Mn) Forecast, by End-user, 2018–2027
Table 25: France Distribution Board Market Value (US$ Mn) Forecast, by Power Rating, 2018–2027
Table 26: France Distribution Board Market Value (US$ Mn) Forecast, by Pole, 2018–2027
Table 27: France Distribution Board Market Value (US$ Mn) Forecast, by End-user, 2018–2027
Table 28: Italy Distribution Board Market Value (US$ Mn) Forecast, by Power Rating, 2018–2027
Table 29: Italy Distribution Board Market Value (US$ Mn) Forecast, by Pole, 2018–2027
Table 30: Italy Distribution Board Market Value (US$ Mn) Forecast, by End-user, 2018–2027
Table 31: Spain Distribution Board Market Value (US$ Mn) Forecast, by Power Rating, 2018–2027
Table 32: Spain Distribution Board Market Value (US$ Mn) Forecast, by Pole, 2018–2027
Table 33: Spain Distribution Board Market Value (US$ Mn) Forecast, by End-user, 2018–2027
Table 34: Rest of Europe Distribution Board Market Value (US$ Mn) Forecast, by Power Rating, 2018–2027
Table 35: Rest of Europe Distribution Board Market Value (US$ Mn) Forecast, by Pole, 2018–2027
Table 36: Rest of Europe Distribution Board Market Value (US$ Mn) Forecast, by End-user, 2018–2027
Table 37: Asia Pacific Distribution Board Market Value (US$ Mn) Forecast, by Country and Sub-region, 2018–2027
Table 38: Asia Pacific Distribution Board Market Value (US$ Mn) Forecast, by Power Rating, 2018–2027
Table 39: Asia Pacific Distribution Board Market Value (US$ Mn) Forecast, by Pole, 2018–2027
Table 40: Asia Pacific Distribution Board Market Value (US$ Mn) Forecast, by End-user, 2018–2027
Table 41: China Distribution Board Market Value (US$ Mn) Forecast, by Power Rating, 2018–2027
Table 42: China Distribution Board Market Value (US$ Mn) Forecast, by Pole, 2018–2027
Table 43: China Distribution Board Market Value (US$ Mn) Forecast, by End-user, 2018–2027
Table 44: India Distribution Board Market Value (US$ Mn) Forecast, by Power Rating, 2018–2027
Table 45: India Distribution Board Market Value (US$ Mn) Forecast, by Pole, 2018–2027
Table 46: India Distribution Board Market Value (US$ Mn) Forecast, by End-user, 2018–2027
Table 47: Japan Distribution Board Market Value (US$ Mn) Forecast, by Power Rating, 2018–2027
Table 48: Japan Distribution Board Market Value (US$ Mn) Forecast, by Pole, 2018–2027
Table 49: Japan Distribution Board Market Value (US$ Mn) Forecast, by End-user, 2018–2027
Table 50: ASEAN Distribution Board Market Value (US$ Mn) Forecast, by Power Rating, 2018–2027
Table 51: ASEAN Distribution Board Market Value (US$ Mn) Forecast, by Pole, 2018–2027
Table 52: ASEAN Distribution Board Market Value (US$ Mn) Forecast, by End-user, 2018–2027
Table 53: Rest of Asia Pacific Distribution Board Market Value (US$ Mn) Forecast, by Power Rating, 2018–2027
Table 54: Rest of Asia Pacific Distribution Board Market Value (US$ Mn) Forecast, by Pole, 2018–2027
Table 55: Rest of Asia Pacific Distribution Board Market Value (US$ Mn) Forecast, by End-user, 2018–2027
Table 56: Latin America Distribution Board Market Value (US$ Mn) Forecast, by Country and Sub-region, 2018–2027
Table 57: Latin America Distribution Board Market Value (US$ Mn) Forecast, by Power Rating, 2018–2027
Table 58: Latin America Distribution Board Market Value (US$ Mn) Forecast, by Pole, 2018–2027
Table 59: Latin America Distribution Board Market Value (US$ Mn) Forecast, by End-user, 2018–2027
Table 60: Brazil Distribution Board Market Value (US$ Mn) Forecast, by Power Rating, 2018–2027
Table 61: Brazil Distribution Board Market Value (US$ Mn) Forecast, by Pole, 2018–2027
Table 62: Brazil Distribution Board Market Value (US$ Mn) Forecast, by End-user, 2018–2027
Table 63: Mexico Distribution Board Market Value (US$ Mn) Forecast, by Power Rating, 2018–2027
Table 64: Mexico Distribution Board Market Value (US$ Mn) Forecast, by Pole, 2018–2027
Table 65: Mexico Distribution Board Market Value (US$ Mn) Forecast, by End-user, 2018–2027
Table 66: Rest of Latin America Distribution Board Market Value (US$ Mn) Forecast, by Power Rating, 2018–2027
Table 67: Rest of Latin America Distribution Board Market Value (US$ Mn) Forecast, by Pole, 2018–2027
Table 68: Rest of Latin America Distribution Board Market Value (US$ Mn) Forecast, by End-user, 2018–2027
Table 69: Middle East & Africa Distribution Board Market Value (US$ Mn) Forecast, by Country and Sub-region, 2018–2027
Table 70: Middle East & Africa Distribution Board Market Value (US$ Mn) Forecast, by Power Rating, 2018–2027
Table 71: Middle East & Africa Distribution Board Market Value (US$ Mn) Forecast, by Pole, 2018–2027
Table 72: Middle East & Africa Distribution Board Market Value (US$ Mn) Forecast, by End-user, 2018–2027
Table 73: GCC Distribution Board Market Value (US$ Mn) Forecast, by Power Rating, 2018–2027
Table 74: GCC Distribution Board Market Value (US$ Mn) Forecast, by Pole, 2018–2027
Table 75: GCC Distribution Board Market Value (US$ Mn) Forecast, by End-user, 2018–2027
Table 76: South Africa Distribution Board Market Value (US$ Mn) Forecast, by Power Rating, 2018–2027
Table 77: South Africa Distribution Board Market Value (US$ Mn) Forecast, by Pole, 2018–2027
Table 78: South Africa Distribution Board Market Value (US$ Mn) Forecast, by End-user, 2018–2027
Table 79: Rest of Middle East & Africa Distribution Board Market Value (US$ Mn) Forecast, by Power Rating, 2018–2027
Table 80: Rest of Middle East & Africa Distribution Board Market Value (US$ Mn) Forecast, by Pole, 2018–2027
Table 81: Rest of Middle East & Africa Distribution Board Market Value (US$ Mn) Forecast, by End-user, 2018–2027
List of Figures
Figure 01: Global Distribution Board Market Value (US$ Mn) Analysis, 2018–2027
Figure 02: Global Distribution Board Market Value Share Analysis, by Pole, 2018 and 2027
Figure 03: Global Distribution Board Market Attractiveness Analysis, by Pole
Figure 04: Global Distribution Board Market Value Share Analysis, by Power Rating, 2018 and 2027
Figure 05: Global Distribution Board Market Attractiveness Analysis, by Power Rating
Figure 06: Global Distribution Board Market Value Share Analysis, by End-user, 2018 and 2027
Figure 07: Global Distribution Board Market Attractiveness Analysis, by End-user
Figure 08: Global Distribution Board Market Value Share Analysis, by Region, 2018 and 2027
Figure 09: Global Distribution Board Market Attractiveness Analysis, by Region
Figure 10: North America Distribution Board Market Value Share Analysis, by Power Rating, 2018 and 2027
Figure 11: North America Distribution Board Market Value Share Analysis, by Pole, 2018 and 2027
Figure 12: North America Distribution Board Market Value Share Analysis, by End-user, 2018 and 2027
Figure 13: North America Distribution Board Market Value Share Analysis, by Country, 2018 and 2027
Figure 14: North America Distribution Board Market Attractiveness Analysis, by Power Rating
Figure 15: North America Distribution Board Market Attractiveness Analysis, by Pole
Figure 16: North America Distribution Board Market Attractiveness Analysis, by End-user
Figure 17: North America Distribution Board Market Attractiveness Analysis, by Country
Figure 18: Europe Distribution Board Market Value Share Analysis, by Power Rating, 2018 and 2027
Figure 19: Europe Distribution Board Market Value Share Analysis, by Pole, 2018 and 2027
Figure 20: Europe Distribution Board Market Value Share Analysis, by End-user, 2018 and 2027
Figure 21: Europe Distribution Board Market Value Share Analysis, by Country and Sub-region, 2018 and 2027
Figure 22: Europe Distribution Board Market Attractiveness Analysis, by Power Rating
Figure 23: Europe Distribution Board Market Attractiveness Analysis, by Pole
Figure 24: Europe Distribution Board Market Attractiveness Analysis, by End-user
Figure 25: Europe Distribution Board Market Attractiveness Analysis, by Country and Sub-region
Figure 26: Asia Pacific Distribution Board Market Value Share Analysis, by Power Rating, 2018 and 2027
Figure 27: Asia Pacific Distribution Board Market Value Share Analysis, by Pole, 2018 and 2027
Figure 28: Asia Pacific Distribution Board Market Value Share Analysis, by End-user, 2018 and 2027
Figure 29: Asia Pacific Distribution Board Market Value Share Analysis, by Country and Sub-region, 2018 and 2027
Figure 30: Asia Pacific Distribution Board Market Attractiveness Analysis, by Power Rating
Figure 31: Asia Pacific Distribution Board Market Attractiveness Analysis, by Pole
Figure 32: Asia Pacific Distribution Board Market Attractiveness Analysis, by End-user
Figure 33: Asia Pacific Distribution Board Market Attractiveness Analysis, by Country and Sub-region
Figure 34: Latin America Distribution Board Market Value Share Analysis, by Power Rating, 2018 and 2027
Figure 35: Latin America Distribution Board Market Value Share Analysis, by Pole, 2018 and 2027
Figure 36: Latin America Distribution Board Market Value Share Analysis, by End-user, 2018 and 2027
Figure 37: Latin America Distribution Board Market Value Share Analysis, by Country and Sub-region, 2018 and 2027
Figure 38: Latin America Distribution Board Market Attractiveness Analysis, by Power Rating
Figure 39: Latin America Distribution Board Market Attractiveness Analysis, by Pole
Figure 40: Latin America Distribution Board Market Attractiveness Analysis, by End-user
Figure 41: Latin America Distribution Board Market Attractiveness Analysis, by Country and Sub-region
Figure 42: Middle East & Africa Distribution Board Market Value Share Analysis, by Power Rating, 2018 and 2027
Figure 43: Middle East & Africa Distribution Board Market Value Share Analysis, by Pole, 2018 and 2027
Figure 44: Middle East & Africa Distribution Board Market Value Share Analysis, by End-user, 2018 and 2027
Figure 45: Middle East & Africa Distribution Board Market Value Share Analysis, by Country and Sub-region, 2018 and 2027
Figure 46: Middle East & Africa Distribution Board Market Attractiveness Analysis, by Power Rating
Figure 47: Middle East & Africa Distribution Board Market Attractiveness Analysis, by Pole
Figure 48: Middle East & Africa Distribution Board Market Attractiveness Analysis, by End-user
Figure 49: Middle East & Africa Distribution Board Market Attractiveness Analysis, by Country and Sub-region
Figure 50: Global Distribution Board Market Share Analysis, by Company, 2018
Copyright © Transparency Market Research, Inc. All Rights reserved
Trust Online

Distribution Board Market