
Reports
Reports
A digital signature is an encrypted and electronic stamp of authentication on digital documents such as PDF files, word files, or online legal contract papers. With recent advancements in digital technology, cloud-based digital signature solutions are gaining traction in the market. The cloud-based segment is expected to account for a significant share of the digital signature market over the forecast period. The global digital signature market is currently driven by benefits provided by solutions such as cost reduction, improved efficiency, time saving, and enriched customer experience.
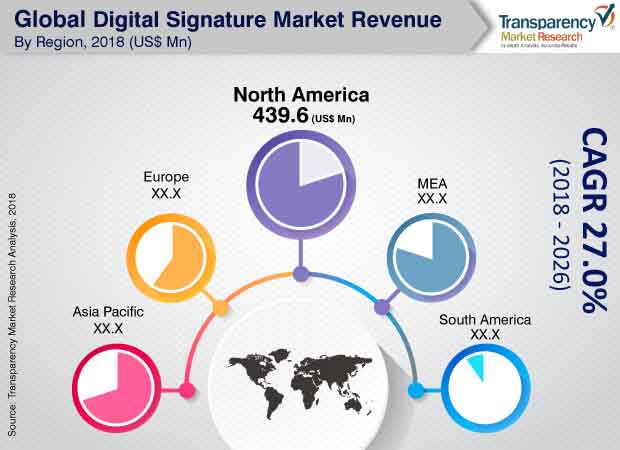
The global digital signature market was valued at US$ 804.8 Mn in 2017 and is expected to expand at a CAGR of 27.0% during the forecast period.
Improved operational efficiency at reduced costs, enhanced security, and organized workflow associated with digital signatures are some of the factors expected to drive the digital signature market. However, lack of awareness regarding the legality of digital signatures and differences in digital signature regulations across various regions are some of the factors restraining the market. Government or industry association initiatives such as awareness programs for different industries could help increase consumer awareness about the legality of digital signatures. Open standard, cloud-based digital signatures, which can be integrated with existing applications, systems, or processes, making an end-to-end workflow organized and uninterrupted are anticipated to present significant opportunities for the digital signature market. Proliferation of tablets and smartphones and the presence of more than seven billion mobile devices across the globe offer significant opportunities for open standard, cloud-based digital signatures, which can be utilized on any mobile device and on any browser.
The global digital signature market is expected to be further driven by rapid growth in Europe. The region is estimated to constitute a significant market share during the forecast period, with the U.K., Germany, and France contributing most to the region’s revenue. The digital signature market in Europe is mainly driven by initiatives undertaken by governments to create opportunities for organizations to conduct cross border business. The ‘Electronic Identification and Trust Services for Electronic Transactions in the Internal Market’ (eIDAS) regulation was implemented by the Council of the European Union in July 2016. The regulation establishes a new legal structure for electronic documents, identification, signatures, and seals throughout the European Union. This regulation is the first of its kind where there is single market recognition for electronic signatures, including digital signatures, and it is consistent throughout all European Union member states.
Moreover, initiatives undertaken by industry participants from the region to promote and spread awareness about the legality of digital signatures are encouraging users to adopt digital signatures. The market in Europe is estimated to expand at a rapid CAGR of 28.2% from 2018 to 2026. Advanced economies of Western Europe, including the U.K., Germany, and France, are expected to drive the growth of the digital signature market in the region. Moreover, the infrastructure of these countries and superior Internet penetration are expected to boost the market in the near future. The digital signature market in Asia Pacific is mainly driven due to initiatives undertaken by industry participants to bridge digital gap in the region. Also, strong rise in the number of Internet-connected users and favorable economic progress in the region have created the need for solutions that can save resources such as time and money while developing smooth business processes. In Asia Pacific, the proliferation of devices such as tablets, smartphones, and computers and the growth of e-commerce have led to an increase in online bank transactions. Digital signature solutions are being implemented to organize the workflow and secure digital transactions, especially in the BFSI and retail industries.
Major players operating in the digital signature market include Adobe systems, Inc., DocuSign Inc., Gemalto N.V., Entrust Datacard Corporation, OneSpan (Esignlive), SIGNiX, Inc., Ascertia, Identrust, Inc., Kofax Inc., Rpost, and Secured Signing Ltd..
1. Preface
1.1. Market Scope
1.2. Market Segmentation
1.3. Key Research Objectives
2. Assumptions and Research Methodology
2.1. Market Taxonomy - Segment Definitions
2.2. Research Methodology
2.2.1. List of Primary and Secondary Sources
2.3. Key Assumptions for Data Modelling
3. Executive Summary: Global Digital Signature Market
4. Market Overview
4.1. Introduction
4.1.1. Product Definition
4.1.2. Industry Evolution/Developments
4.2. Global Market – Macro Economic Factors Overview
4.2.1. World GDP Indicator – For Top Economies
4.2.2. Global ICT Spending (US$ Mn), 2015, 2018, 2026
4.3. Key Trends: Global Digital Signature Market
4.4. Market Factor Analysis
4.4.1. Porter’s Five Forces Analysis
4.4.2. Market Dynamics (Growth Influencers)
4.4.2.1. Drivers
4.4.2.2. Restraints
4.4.2.3. Opportunities
4.4.2.4. Impact Analysis of Drivers & Restraints
4.5. Comparative Analysis of E-signatures and Digital Signatures
4.6. Adoption analysis (%) of E-signature Types, 2017
4.6.1. Click-to-sign Signatures
4.6.2. Basic Electronic Signatures
4.6.3. Advanced Electronic Signatures (AES)
4.6.4. Qualified Electronic Signatures (QES)
4.7. Pricing Model Analysis
4.7.1. By Number of Signatures
4.7.2. By Subscription
4.8. Case Studies: Digital Signature
4.9. Regulations and Policies
4.10. Global Digital Signature Market Analysis and Forecast, 2016 - 2026
4.10.1. Market Revenue Analysis (US$ Mn)
4.10.1.1. Historic Growth Trends, 2012-2017
4.10.1.2. Forecast Trends, 2018-2026
4.11. Market Opportunity Analysis – By Region (Global/North America/Europe/Asia Pacific/Middle East & Africa/South America)
4.11.1. By Region/Country
4.11.2. By Deployment
4.11.3. By Industry Vertical
4.12. Competitive Scenario and Trends
4.12.1. Digital Signature Market Concentration Rate
4.12.2. Mergers & Acquisitions, Expansions
4.13. Market Outlook
5. Global Digital Signature Market Analysis and Forecast, by Deployment
5.1. Overview and Definitions
5.2. Key Segment Analysis
5.3. Digital Signature Market Size (US$ Mn) Forecast, by Deployment, 2016 - 2026
5.3.1. Cloud-based
5.3.2. On-premise
6. Global Digital Signature Market Analysis and Forecast, by Industry Vertical
6.1. Overview and Definitions
6.2. Key Segment Analysis
6.3. Digital Signature Market Size (US$ Mn) Forecast, by Industry Vertical, 2018 - 2026
6.3.1. Banking, Financial Services, and Insurance (BFSI)
6.3.2. Education
6.3.3. Government
6.3.4. Health Care
6.3.5. Legal
6.3.6. Real Estate
6.3.7. Retail
6.3.8. Transportation
6.3.9. Other (Non-profit, IT, Telecom, etc.)
7. Global Digital Signature Market Analysis and Forecast, by Region
7.1. Key Findings
7.2. Key Segment Analysis
7.3. Digital Signature Market Size (US$ Mn) Forecast, by Region, 2016 - 2026
7.3.1. North America
7.3.2. Europe
7.3.3. Asia Pacific
7.3.4. Middle East & Africa
7.3.5. South America
8. North America Digital Signature Market Analysis and Forecast
8.1. Key Findings
8.2. Key Segment Analysis
8.3. Impact Analysis of Drivers & Restraints
8.4. Digital Signature Market Size (US$ Mn) Forecast, by Deployment, 2016 - 2026
8.4.1. Cloud-based
8.4.2. On-premise
8.5. Digital Signature Market Size (US$ Mn) Forecast, by Industry Vertical, 2018 - 2026
8.5.1. Banking, Financial Services, and Insurance (BFSI)
8.5.2. Education
8.5.3. Government
8.5.4. Health Care
8.5.5. Legal
8.5.6. Real Estate
8.5.7. Retail
8.5.8. Transportation
8.5.9. Other (IT & Telecom, Non-profit, etc.)
8.6. Digital Signature Market Size (US$ Mn) Forecast, by Country, 2016 - 2026
8.6.1. The U.S.
8.6.2. Canada
8.6.3. Rest of North America
9. Europe Digital Signature Market Analysis and Forecast
9.1. Key Findings
9.2. Key Segment Analysis
9.3. Impact Analysis of Drivers & Restraints
9.4. Digital Signature Market Size (US$ Mn) Forecast, by Deployment, 2016 - 2026
9.4.1. Cloud-based
9.4.2. On-premise
9.5. Digital Signature Market Size (US$ Mn) Forecast, by Industry Vertical, 2018 - 2026
9.5.1. Banking, Financial Services, and Insurance (BFSI)
9.5.2. Education
9.5.3. Government
9.5.4. Health Care
9.5.5. Legal
9.5.6. Real Estate
9.5.7. Retail
9.5.8. Transportation
9.5.9. Other (IT & Telecom, Non-profit etc.)
9.6. Digital Signature Market Size (US$ Mn) Forecast, by Country, 2016 - 2026
9.6.1. The U.K.
9.6.2. Germany
9.6.3. France
9.6.4. Rest of Europe
10. Asia Pacific Digital Signature Market Analysis and Forecast
10.1. Key Findings
10.2. Key Segment Analysis
10.3. Impact Analysis of Drivers & Restraints
10.4. Digital Signature Market Size (US$ Mn) Forecast, by Deployment, 2016 - 2026
10.4.1. Cloud-based
10.4.2. On-premise
10.5. Digital Signature Market Size (US$ Mn) Forecast, by Industry Vertical, 2018 - 2026
10.5.1. Banking, Financial Services, and Insurance (BFSI)
10.5.2. Education
10.5.3. Government
10.5.4. Health Care
10.5.5. Legal
10.5.6. Real Estate
10.5.7. Retail
10.5.8. Transportation
10.5.9. Other (IT & Telecom, Non-profit etc.)
10.6. Digital Signature Market Size (US$ Mn) Forecast, by Country, 2016 - 2026
10.6.1. China
10.6.2. Japan
10.6.3. Australia
10.6.4. Rest of Asia Pacific
11. Middle East and Africa (MEA) Digital Signature Market Analysis and Forecast
11.1. Key Findings
11.2. Key Segment Analysis
11.3. Impact Analysis of Drivers & Restraints
11.4. Digital Signature Market Size (US$ Mn) Forecast, by Deployment, 2016 - 2026
11.4.1. Cloud-based
11.4.2. On-premise
11.5. Digital Signature Market Size (US$ Mn) Forecast, by Industry Vertical, 2018 - 2026
11.5.1. Banking, Financial Services, and Insurance (BFSI)
11.5.2. Education
11.5.3. Government
11.5.4. Health Care
11.5.5. Legal
11.5.6. Real Estate
11.5.7. Retail
11.5.8. Transportation
11.5.9. Other (IT & Telecom, Non-profit etc.)
11.6. Digital Signature Market Size (US$ Mn) Forecast, by Country, 2016 - 2026
11.6.1. GCC Countries
11.6.2. South Africa
11.6.3. Rest of Middle East and Africa
12. South America Digital Signature Market Analysis and Forecast
12.1. Key Findings
12.2. Key Segment Analysis
12.3. Impact Analysis of Drivers & Restraints
12.4. Digital Signature Market Size (US$ Mn) Forecast, by Deployment, 2016 - 2026
12.4.1. Cloud-based
12.4.2. On-premise
12.5. Digital Signature Market Size (US$ Mn) Forecast, by Industry Vertical, 2018 - 2026
12.5.1. Banking, Financial Services, and Insurance (BFSI)
12.5.2. Education
12.5.3. Government
12.5.4. Health Care
12.5.5. Legal
12.5.6. Real Estate
12.5.7. Retail
12.5.8. Transportation
12.5.9. Other (IT & Telecom, Non-profit, etc.)
12.6. Digital Signature Market Size (US$ Mn) Forecast, by Country, 2016 - 2026
12.6.1. Brazil
12.6.2. Rest of South America
13. Competition Landscape
13.1. Market Player – Competition Matrix
13.2. Digital Signature Market Share Analysis (%), (US$ Mn), by Company (2017)
13.2.1. Global
13.2.2. North America
13.2.3. Europe
13.3. Regional Presence (Intensity Map)
14. Company Profiles
14.1. Adobe Systems, Inc.
14.1.1. Business Overview
14.1.2. Sales Area/Geographical Presence
14.1.3. Key Competitors
14.1.4. Revenue and Strategy
14.2. Ascertia
14.2.1. Business Overview
14.2.2. Sales Area/Geographical Presence
14.2.3. Key Competitors
14.2.4. Revenue and Strategy
14.3. Docusign Inc.
14.3.1. Business Overview
14.3.2. Sales Area/Geographical Presence
14.3.3. Key Competitors
14.3.4. Revenue and Strategy
14.4. Entrust Datacard Corporation
14.4.1. Business Overview
14.4.2. Sales Area/Geographical Presence
14.4.3. Key Competitors
14.4.4. Revenue and Strategy
14.5. OneSpan (Esignlive)
14.5.1. Business Overview
14.5.2. Sales Area/Geographical Presence
14.5.3. Key Competitors
14.5.4. Revenue and Strategy
14.6. SIGNiX, Inc.
14.6.1. Business Overview
14.6.2. Sales Area/Geographical Presence
14.6.3. Key Competitors
14.6.4. Revenue and Strategy
14.7. Gemalto N.V.
14.7.1. Business Overview
14.7.2. Sales Area/Geographical Presence
14.7.3. Key Competitors
14.7.4. Revenue and Strategy
14.8. Identrust, Inc.
14.8.1. Business Overview
14.8.2. Sales Area/Geographical Presence
14.8.3. Key Competitors
14.8.4. Revenue and Strategy
14.9. Kofax Inc.
14.9.1. Business Overview
14.9.2. Sales Area/Geographical Presence
14.9.3. Key Competitors
14.9.4. Revenue and Strategy
14.10. Rpost
14.10.1. Business Overview
14.10.2. Sales Area/Geographical Presence
14.10.3. Key Competitors
14.10.4. Revenue and Strategy
14.11. Secured Signing Ltd.
14.11.1. Business Overview
14.11.2. Sales Area/Geographical Presence
14.11.3. Key Competitors
14.11.4. Revenue and Strategy
15. Key Takeaways
List of Tables
Table 1: Global Digital Signature Market Revenue (US$ Mn) Forecast, by Deployment, 2016 - 2026
Table 2: Global Digital Signature Market Revenue (US$ Mn) Forecast, by Industry Vertical, 2016 - 2026
Table 3: Global Digital Signature Market Revenue (US$ Mn) Forecast, by Industry Vertical, 2016 - 2026
Table 4: Global Digital Signature Market Revenue (US$ Mn) Forecast, by Region, 2016 - 2026
Table 5: North America Digital Signature Market Revenue (US$ Mn) Forecast, by Deployment, 2016 - 2026
Table 6: North America Digital Signature Market Revenue (US$ Mn) Forecast, by Industry Vertical, 2016 - 2026
Table 7: North America Digital Signature Market Revenue (US$ Mn) Forecast, by Industry Vertical, 2016 - 2026
Table 8: North America Digital Signature Market Revenue (US$ Mn) Forecast, by Country, 2016 - 2026
Table 9: Europe Digital Signature Market Revenue (US$ Mn) Forecast, by Deployment, 2016 - 2026
Table 10: Europe Digital Signature Market Revenue (US$ Mn) Forecast, by Industry Vertical, 2016 - 2026
Table 11: Europe Digital Signature Market Revenue (US$ Mn) Forecast, by Industry Vertical, 2016 - 2026
Table 12: Europe Digital Signature Market Revenue (US$ Mn) Forecast, by Country, 2016 - 2026
Table 13: Asia Pacific Digital Signature Market Revenue (US$ Mn) Forecast, by Deployment, 2016 - 2026
Table 14: Asia Pacific Digital Signature Market Revenue (US$ Mn) Forecast, by Industry Vertical, 2016 - 2026
Table 15: Asia Pacific Digital Signature Market Revenue (US$ Mn) Forecast, by Industry Vertical, 2016 - 2026
Table 16: Asia Pacific Digital Signature Market Revenue (US$ Mn) Forecast, by Country, 2016 - 2026
Table 17: Middle East & Africa Digital Signature Market Revenue (US$ Mn) Forecast, by Deployment, 2016 - 2026
Table 18: Middle East & Africa Digital Signature Market Revenue (US$ Mn) Forecast, by Industry Vertical, 2016 - 2026
Table 19: Middle East & Africa Digital Signature Market Revenue (US$ Mn) Forecast, by Industry Vertical, 2016 - 2026
Table 20: Middle East & Africa Digital Signature Market Revenue (US$ Mn) Forecast, by Country, 2016 - 2026
Table 21: South America Digital Signature Market Revenue (US$ Mn) Forecast, by Deployment, 2016 - 2026
Table 22: South America Digital Signature Market Revenue (US$ Mn) Forecast, by Industry Vertical, 2016 - 2026
Table 23: South America Digital Signature Market Revenue (US$ Mn) Forecast, by Industry Vertical, 2016 - 2026
Table 24: South America Digital Signature Market Revenue (US$ Mn) Forecast, by Country, 2016 - 2026
List of Figures
Figure 1: Global Digital Signature Market Size (US$ Mn) Forecast, 2016–2026
Figure 2: North America Digital Signature Market growth
Figure 3: North America Digital Signature Market Share Analysis, by Deployment, 2018
Figure 4: North America Digital Signature Market Share Analysis, by Country, 2018
Figure 5: North America Digital Signature Market Share Analysis, by Industry Vertical, 2018
Figure 6: Europe Digital Signature Market growth
Figure 7: Europe Digital Signature Market Share Analysis, by Deployment, 2018
Figure 8: Europe Digital Signature Market Share Analysis, by Country, 2018
Figure 9: Europe Digital Signature Market Share Analysis, by Industry Vertical, 2018
Figure 10: Asia Pacific Digital Signature Market growth
Figure 12: Asia Pacific Digital Signature Market Share Analysis, by Country, 2018
Figure 11: Asia Pacific Digital Signature Market Share Analysis, by Deployment, 2018
Figure 13: Asia Pacific Digital Signature Market Share Analysis, by Industry Vertical, 2018
Figure 14: Middle East & Africa (MEA) Digital Signature Market growth
Figure 15: Middle East & Africa (MEA) Digital Signature Market Share Analysis, by Deployment, 2018
Figure 16: Middle East & Africa (MEA) Digital Signature Market Share Analysis, by Country, 2018
Figure 17: Middle East & Africa (MEA) Digital Signature Market Share Analysis, by Industry Vertical, 2018
Figure 18: South America Digital Signature Market growth
Figure 19: South America Digital Signature Market Share Analysis, by Deployment, 2018
Figure 20: South America Digital Signature Market Share Analysis, by Country, 2018
Figure 21: South America Digital Signature Market Share Analysis, by Industry Vertical, 2018
Figure 22: Gross Domestic Product (GDP) per Capita; Analysis (1/2) (US$ Mn), by Major Countries, 2012 - 2017
Figure 23: Gross Domestic Product (GDP) Analysis (2/2) (US$ Mn), by Major Countries, 2012 - 2017
Figure 24: Adoption of E-Signatures Types (2017)
Figure 25: Digital Signature Market Size (US$ Mn) Forecast, 2012 – 2017
Figure 26: Global Digital Signature Market Y-o-Y Growth (Value %), 2012 – 2017
Figure 27: Digital Signature Market Size (US$ Mn) Forecast, 2018 - 2016
Figure 28: Global Digital Signature Market Y-o-Y Growth (Value %), 2018 - 2016
Figure 29: Global Digital Signature Market Opportunity Growth Analysis (US$ Mn), 2016 – 2026
Figure 30 Global Digital Signature Market Outlook (Value %), by Deployment
Figure 31: Global Digital Signature Market Outlook (Value %), by Industry Vertical
Figure 32: Global Digital Signature Market Outlook (Value %), by Region
Figure 33: Global Digital Signature Market Revenue Share, by Deployment (2018)
Figure 34: Global Digital Signature Market Revenue Share, by Deployment (2026)
Figure 35: Global Digital Signature Market Revenue Share, by Industry Vertical (2018)
Figure 36: Global Digital Signature Market Revenue Share, by Industry Vertical (2026)
Figure 37: Global Digital Signature Market Revenue Share, by Region (2018)
Figure 38: Global Digital Signature Market Revenue Share, by Region (2026)
Figure 39: North America Digital Signature Market Revenue Share, by Deployment (2018)
Figure 40: North America Digital Signature Market Revenue Share, by Deployment (2026)
Figure 41: North America Digital Signature Market Revenue Share, by Industry Vertical (2018)
Figure 42: North America Digital Signature Market Revenue Share, by Industry Vertical (2026)
Figure 43: North America Digital Signature Market Revenue Share, by Country (2018)
Figure 44: North America Digital Signature Market Revenue Share, by Country (2026)
Figure 45: Europe Digital Signature Market Revenue Share, by Deployment (2018)
Figure 46: Europe Digital Signature Market Revenue Share, by Deployment (2026)
Figure 47: Europe Digital Signature Market Revenue Share, by Industry Vertical (2018)
Figure 48: Europe Digital Signature Market Revenue Share, by Industry Vertical (2026)
Figure 49: Europe Digital Signature Market Revenue Share, by Country (2018)
Figure 50: Europe Digital Signature Market Revenue Share, by Country (2026)
Figure 51: Asia Pacific Digital Signature Market Revenue Share, by Deployment (2018)
Figure 52: Asia Pacific Digital Signature Market Revenue Share, by Deployment (2026)
Figure 53: Asia Pacific Digital Signature Market Revenue Share, by Industry Vertical (2018)
Figure 54: Asia Pacific Digital Signature Market Revenue Share, by Industry Vertical (2026)
Figure 55: Asia Pacific Digital Signature Market Revenue Share, by Country (2018)
Figure 56: Asia Pacific Digital Signature Market Revenue Share, by Country (2026)
Figure 57: Middle East & Africa Digital Signature Market Revenue Share, by Deployment (2018)
Figure 58: Middle East & Africa Digital Signature Market Revenue Share, by Deployment (2026)
Figure 59: Middle East & Africa Digital Signature Market Revenue Share, by Industry Vertical (2018)
Figure 60: Middle East & Africa Digital Signature Market Revenue Share, by Industry Vertical (2026)
Figure 61: Middle East & Africa Digital Signature Market Revenue Share, by Country (2018)
Figure 62: Middle East & Africa Digital Signature Market Revenue Share, by Country (2026)
Figure 63: South America Digital Signature Market Revenue Share, by Deployment (2018)
Figure 64: South America Digital Signature Market Revenue Share, by Deployment (2026)
Figure 65: South America Digital Signature Market Revenue Share, by Industry Vertical (2018)
Figure 66: South America Digital Signature Market Revenue Share, by Industry Vertical (2026)
Figure 67: South America Digital Signature Market Revenue Share, by Country (2018)
Figure 68: South America Digital Signature Market Revenue Share, by Country (2026)
Figure 69: Digital Signature Market Share Analysis (%), by Company (2017)
Figure 70: Digital Signature Market Share Analysis (US$ Mn), by Company (2017)
Figure 71: Digital Signature Market Share Analysis (%), by Company (2017)
Figure 72: Digital Signature Market Share Analysis (US$ Mn), by Company (2017)
Figure 73: Digital Signature Market Share Analysis (%), by Company (2017)
Figure 74: Digital Signature Market Share Analysis (US$ Mn), by Company (2017)
Figure 75 Revenue (US$ Mn) & Y-o-Y Growth (%), 2015–2017
Figure 76: Breakdown of Net Sales, by Geography, 2017
Figure 77: Revenue (US$ Mn) & Y-o-Y Growth (%), 2015–2017
Figure 78: Breakdown of Net Sales, by Geography, 2018*
Figure 79: Revenue (US$ Mn) & Y-o-Y Growth (%), 2015–2017
Figure 80: Breakdown of Net Sales, by Geography, 2017
Copyright © Transparency Market Research, Inc. All Rights reserved
Trust Online

Digital Signature Market Forecast 2018 - 2026