
Reports
Reports
Burner Management System (BMS) Market: Snapshot
Safety is a key concern within every industry that conducts heater/burner-based operations. Any malfunctioning in the heaters in these industries could lead to major loss of life, property, and finance. It could also reduce the availability and accessibility of these industries. This acts as one of the major factors driving the global burner management systems (BMS) market.
Rising government legislations and regulations, along with increasing litigations for accidents, have made the installation of BMS in existing as well as new heaters a must. This has resulted in the increased demand for burner management systems across the globe. Rapid industrial growth has also had a significant impact on the development of this market.
The global market for BMS was estimated to be valued at US$4.58 bn in 2015 and is projected to be worth US$7.39 bn by 2024, expanding at a CAGR of 5.5% therein. Based on volume, the market is forecast to register a 5.6% CAGR from 2016 to 2024.
Oil and Gas Sector Emerges as Leading End-use Segment in BMS Market
On the basis of component, the BMS market is bifurcated into hardware and software. The hardware components used in burner management systems hold a significant share in the overall market revenue owing to their importance in the addition of significant functionalities and in meeting the design criteria for industry-critical operations.
Based on fuel type, the burner management systems market is categorized into oil, gas, and electricity. Oil-based burners led the BMS market owing to their wide-scale usage over the years. The segment accounted for a 41.1% share in the BMS market in 2015. However, electricity-based burners are expected to witness significant growth during the forecast period due to the rising need for a cleaner and safer environment in industries.
By application, the burner management systems market is segmented into boilers, furnaces, and kilns and ovens. The installation of boilers in industries is higher as compared to furnaces and kilns and ovens, which thereby increases the share of this application in the overall market.
On the basis of on end use, the burner management systems market includes power, oil and gas, chemicals, mining, metal, and mineral (mmm), refining, water, specialty chemicals, pharmaceutical, glass, food and beverages, alternate fuel, ceramics, building, automotive, and printing and publishing. The oil and gas sector emerged as the leading end-use segment in the burner management systems market in 2015 owing to the increasing demand for energy worldwide.
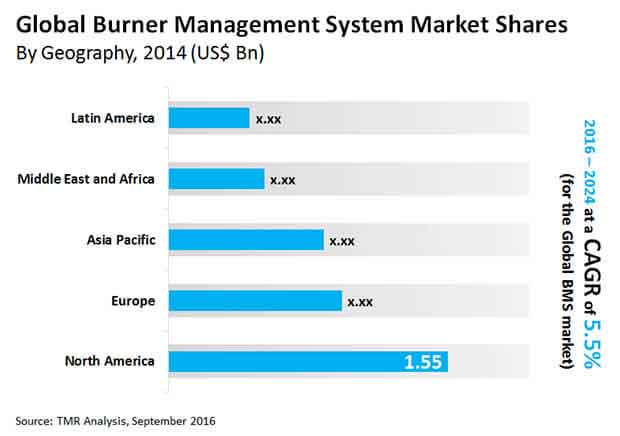
Strong Presence of BMS Manufacturers Driving Market in North America
The global market for burner management systems has been geographically segmented into North America, Europe, Asia Pacific, the Middle East and Africa, and South America. North America held the major share in 2015, accounting for over one-third of the total market based on both revenue and volume. The presence of a large number of BMS manufacturers has made this region a significant market for burner management systems. The total growth of BMS globally from 2014 to 2015 was US$0.23 bn, wherein the share of North America alone was 36.7%.
Asia Pacific is also anticipated to witness significant growth in the burner management systems market through 2024. This can be attributed to the significant population as well as industrial growth across countries such as China, India, and Japan.
Some of the major players in the burner management system market are ABB Ltd., ALSTOM, Honeywell International Inc., BORN, Inc., Doosan Babcock, Pilz GmbH & Co. KG, Siemens AG, Babcock & Wilcox Co., NESTEC Inc., and Titan Logix Corp.
Burner Management System (BMS) Market is expected to reach US$7.39 bn by 2024
Burner Management System (BMS) Market is estimated to rise at a CAGR of 5.5% during forecast period
Rising government legislations and regulations, along with increasing litigations for accidents, have made the installation of BMS are expected to drive the Burner Management System (BMS) Market during the forecast period
North America is more attractive for vendors in the Burner Management System (BMS) Market
Key players of Burner Management System (BMS) Market are ABB Ltd., ALSTOM, Honeywell International Inc., BORN, Inc., Doosan Babcock, Pilz GmbH & Co. KG, Siemens AG, Babcock & Wilcox Co., NESTEC Inc., and Titan Logix Corp
1. Preface
1.1. Market Definition and Scope
1.2. Market Segmentation
1.3. Key Research Objectives
1.4. Research Highlights
2. Assumptions and Research Methodology
3. Executive Summary : Global Burner Management System Market
4. Market Overview
4.1. Introduction
4.1.1. Product Definition
4.1.2. Industry Evolution / Developments
4.2. Key Market Indicators
4.2.1. Heavy investment for increasing power generation capacities
4.3. Market Dynamics
4.3.1. Drivers
4.3.2. Restraints
4.3.3. Opportunity
4.4. Global Burner Management System Market Analysis and Forecasts, 2014 – 2024
4.4.1. Market Revenue Projections (US$ Mn)
4.4.2. Market Volume Projections (Million Units)
4.5. Burner Management System Market - Global Supply Demand Scenario
4.6. Porter’s Five Force Analysis
4.7. Value Chain Analysis
4.8. Market Outlook
5. Global Burner Management System Market Analysis and Forecasts, By Component
5.1. Introduction & Definition
5.2. Key Findings / Developments
5.3. Key Trends
5.4. Market Size (US$ Mn) Forecast By Component, 2014 – 2024
5.4.1. Software
5.4.2. Hardware
5.4.2.1. Actuators and Controllers
5.4.2.2. Flame Detectors
5.4.2.3. Shut-off Valves
5.4.2.4. Ignition Units
5.4.2.5. Alarms and Shutdowns
5.4.2.6. Others (Diagnostic tools, IT hardware, etc.)
5.5. Comparison Matrix
5.6. Market Attractiveness By Component
6. Global Burner Management System Market Analysis and Forecasts, By Fuel Type
6.1. Introduction & Definition
6.2. Key Findings / Developments
6.3. Key Trends
6.4. Market Size and Volume (US$ Mn and Million Units) Forecast By Fuel Type, 2014 – 2024
6.4.1. Oil
6.4.2. Gas
6.4.3. Electricity
6.5. Comparison Matrix
6.6. Market Attractiveness By Fuel Type
7. Global Burner Management System Market Analysis and Forecasts, By Application
7.1. Introduction & Definition
7.2. Key Findings / Developments
7.3. Key Trends
7.4. Market Size and Volume (US$ Mn and Million Units) Forecast By Application, 2014 – 2024
7.4.1. Boilers
7.4.2. Furnace
7.4.3. Kiln and Ovens
7.5. Comparison Matrix
7.6. Market Attractiveness By Application
8. Global Burner Management System Market Analysis and Forecasts, By End-use
8.1. Introduction & Definition
8.2. Key Findings / Developments
8.3. Key Trends
8.4. Market Size and Volume (US$ Mn and Million Units) Forecast By End-use, 2014 – 2024
8.4.1. Oil and Gas
8.4.2. Power
8.4.3. Chemicals
8.4.4. Mining, Metal and Mineral (MMM)
8.4.5. Refining
8.4.6. Water
8.4.7. Specialty Chemicals
8.4.8. Pharmaceutical
8.4.9. Food & Beverages
8.4.10. Glass
8.4.11. Ceramics
8.4.12. Alternate Fuel
8.4.13. Building
8.4.14. Automotive
8.4.15. Printing & Publishing
8.4.16. Others
8.5. Comparison Matrix
8.6. Market Attractiveness By End-use
9. Global Burner Management System Market Analysis and Forecasts, By Region
9.1. Key Findings
9.2. Policies and Regulations
9.3. Market Size and volume (US$ Mn and Million Units) Forecast By Region, 2014 – 2024
9.3.1. North America
9.3.2. Europe
9.3.3. Asia Pacific
9.3.4. Middle East and Africa
9.3.5. South America
9.4. Market Attractiveness By Country/Region
10. North America Burner Management System Market Analysis and Forecast
10.1. Key Findings
10.2. Key Trends
10.3. Market Size (US$ Mn) Forecast By Component, 2014 – 2024
10.3.1. Software
10.3.2. Hardware
10.3.2.1. Actuators and Controllers
10.3.2.2. Flame Detectors
10.3.2.3. Shut-off Valves
10.3.2.4. Ignition Units
10.3.2.5. Alarms and Shutdowns
10.3.3. Others (Diagnostic tools, IT hardware, etc.)
10.4. Market Size and Volume (US$ Mn and Million Units) Forecast By Fuel Type, 2014 – 2024
10.4.1. Oil
10.4.2. Gas
10.4.3. Electricity
10.5. Market Size and Volume (US$ Mn and Million Units) Forecast By Application, 2014 – 2024
10.5.1. Boilers
10.5.2. Furnace
10.5.3. Kiln and Ovens
10.6. Market Size and Volume (US$ Mn and Million Units) Forecast By End-use, 2014 – 2024
10.6.1. Oil and Gas
10.6.2. Power
10.6.3. Chemicals
10.6.4. Mining, Metal and Mineral (MMM)
10.6.5. Refining
10.6.6. Water
10.6.7. Specialty Chemicals
10.6.8. Pharmaceutical
10.6.9. Food & Beverages
10.6.10. Glass
10.6.11. Ceramics
10.6.12. Alternate Fuel
10.6.13. Building
10.6.14. Automotive
10.6.15. Printing & Publishing
10.6.16. Others
10.7. Market Attractiveness Analysis
10.7.1. By Country
10.7.2. By Component
10.7.3. By Application
10.7.4. By End-use
10.8. The U.S. Burner Management System Market Analysis and Forecast
10.8.1. Key Findings
10.8.2. Key Trends
10.8.3. Market Size (US$ Mn) Forecast By Component, 2014 – 2024
10.8.3.1. Software
10.8.3.2. Hardware
10.8.3.2.1. Actuators and Controllers
10.8.3.2.2. Flame Detectors
10.8.3.2.3. Shut-off Valves
10.8.3.2.4. Ignition Units
10.8.3.2.5. Alarms and Shutdowns
10.8.3.2.6. Others (Diagnostic tools, IT hardware, etc.)
10.8.4. Market Size and Volume (US$ Mn and Million Units) Forecast By Fuel Type, 2014 – 2024
10.8.4.1. Oil
10.8.4.2. Gas
10.8.4.3. Electricity
10.8.5. Market Size and Volume (US$ Mn and Million Units) Forecast By Application, 2014 – 2024
10.8.5.1. Boilers
10.8.5.2. Furnace
10.8.5.3. Kiln and Ovens
10.8.6. Market Size and Volume (US$ Mn and Million Units) Forecast By End-use, 2014 – 2024
10.8.6.1. Oil and Gas
10.8.6.2. Power
10.8.6.3. Chemicals
10.8.6.4. Mining, Metal and Mineral (MMM)
10.8.6.5. Refining
10.8.6.6. Water
10.8.6.7. Specialty Chemicals
10.8.6.8. Pharmaceutical
10.8.6.9. Food & Beverages
10.8.6.10. Glass
10.8.6.11. Ceramics
10.8.6.12. Alternate Fuel
10.8.6.13. Building
10.8.6.14. Automotive
10.8.6.15. Printing & Publishing
10.8.6.16. Others
10.9. Market Attractiveness Analysis
10.9.1. By Country
10.9.2. By Component
10.9.3. By Fuel Type
10.9.4. By Application
10.9.5. By End-use
10.10. Canada Burner Management System Market Analysis and Forecast
10.11. Rest of North America Burner Management System Market Analysis and Forecast
*Similar Cross Sectional Analysis would be provided for all regions/countries
11. Europe Burner Management System Market Analysis and Forecast
11.1. Key Findings
11.2. Key Trends
11.3. Market Size (US$ Mn) Forecast By Component, 2014 – 2024
11.3.1. Software
11.3.2. Hardware
11.3.2.1. Actuators and Controllers
11.3.2.2. Flame Detectors
11.3.2.3. Shut-off Valves
11.3.2.4. Ignition Units
11.3.2.5. Alarms and Shutdowns
11.3.3. Others (Diagnostic tools, IT hardware, etc.)
11.4. Market Size and Volume (US$ Mn and Million Units) Forecast By Fuel Type, 2014 – 2024
11.4.1. Oil
11.4.2. Gas
11.4.3. Electricity
11.5. Market Size and Volume (US$ Mn and Million Units) Forecast By Application, 2014 – 2024
11.5.1. Boilers
11.5.2. Furnace
11.5.3. Kiln and Ovens
11.6. Market Size and Volume (US$ Mn and Million Units) Forecast By End-use, 2014 – 2024
11.6.1. Oil and Gas
11.6.2. Power
11.6.3. Chemicals
11.6.4. Mining, Metal and Mineral (MMM)
11.6.5. Refining
11.6.6. Water
11.6.7. Specialty Chemicals
11.6.8. Pharmaceutical
11.6.9. Food & Beverages
11.6.10. Glass
11.6.11. Ceramics
11.6.12. Alternate Fuel
11.6.13. Building
11.6.14. Automotive
11.6.15. Printing & Publishing
11.6.16. Others
11.7. Market Attractiveness Analysis
11.7.1. By Country
11.7.2. By Component
11.7.3. By Fuel Type
11.7.4. By Application
11.7.5. By End-use
11.8. UK Burner Management System Market Analysis and Forecast
11.9. Germany Burner Management System Market Analysis and Forecast
11.10. Italy Burner Management System Market Analysis and Forecast
11.11. France Burner Management System Market Analysis and Forecast
11.12. Russia Burner Management System Market Analysis and Forecast
11.13. Rest of Europe Burner Management System Market Analysis and Forecast
*Cross Sectional Analysis would be provided for all regions/countries
12. Asia Pacific (APAC) Burner Management System Market Analysis and Forecast
12.1. Key Findings
12.2. Key Trends
12.3. Market Size (US$ Mn) Forecast By Component, 2014 – 2024
12.3.1. Software
12.3.2. Hardware
12.3.2.1. Actuators and Controllers
12.3.2.2. Flame Detectors
12.3.2.3. Shut-off Valves
12.3.2.4. Ignition Units
12.3.2.5. Alarms and Shutdowns
12.3.2.6. Others (Diagnostic tools, IT hardware, etc.)
12.4. Market Size and Volume (US$ Mn and Million Units) Forecast By Fuel Type, 2014 – 2024
12.4.1. Oil
12.4.2. Gas
12.4.3. Electricity
12.5. Market Size and Volume (US$ Mn and Million Units) Forecast By Application, 2014 – 2024
12.5.1. Boilers
12.5.2. Furnace
12.5.3. Kiln and Ovens
12.6. Market Size and Volume (US$ Mn and Million Units) Forecast By End-use, 2014 – 2024
12.6.1. Oil and Gas
12.6.2. Power
12.6.3. Chemicals
12.6.4. Mining, Metal and Mineral (MMM)
12.6.5. Refining
12.6.6. Water
12.6.7. Specialty Chemicals
12.6.8. Pharmaceutical
12.6.9. Food & Beverages
12.6.10. Glass
12.6.11. Ceramics
12.6.12. Alternate Fuel
12.6.13. Building
12.6.14. Automotive
12.6.15. Printing & Publishing
12.6.16. Others
12.7. Market Attractiveness Analysis
12.7.1. By Country
12.7.2. By Component
12.7.3. By Fuel Type
12.7.4. By Application
12.7.5. By End-use
12.8. India Burner Management System Market Analysis and Forecast
12.9. China Burner Management System Market Analysis and Forecast
12.10. Korea Burner Management System Market Analysis and Forecast
12.11. Japan Burner Management System Market Analysis and Forecast
12.12. South East Asia (SEA) Burner Management System Market Analysis and Forecast
12.13. Rest of APAC Burner Management System Market Analysis and Forecast
*Cross Sectional Analysis would be provided for all regions/countries
13. Middle East and Africa (MEA) Burner Management System Market Analysis and Forecast
13.1. Key Findings
13.2. Key Trends
13.3. Market Size (US$ Mn) Forecast By Component, 2014 – 2024
13.3.1. Software
13.3.2. Hardware
13.3.2.1. Actuators and Controllers
13.3.2.2. Flame Detectors
13.3.2.3. Shut-off Valves
13.3.2.4. Ignition Units
13.3.2.5. Alarms and Shutdowns
13.3.2.6. Others (Diagnostic tools, IT hardware, etc.)
13.4. Market Size and Volume (US$ Mn and Million Units) Forecast By Fuel Type, 2014 – 2024
13.4.1. Oil
13.4.2. Gas
13.4.3. Electricity
13.5. Market Size and Volume (US$ Mn and Million Units) Forecast By Application, 2014 – 2024
13.5.1. Boilers
13.5.2. Furnace
13.5.3. Kiln and Ovens
13.6. Market Size and Volume (US$ Mn and Million Units) Forecast By End-use, 2014 – 2024
13.6.1. Oil and Gas
13.6.2. Power
13.6.3. Chemicals
13.6.4. Mining, Metal and Mineral (MMM)
13.6.5. Refining
13.6.6. Water
13.6.7. Specialty Chemicals
13.6.8. Pharmaceutical
13.6.9. Food & Beverages
13.6.10. Glass
13.6.11. Ceramics
13.6.12. Alternate Fuel
13.6.13. Building
13.6.14. Automotive
13.6.15. Printing & Publishing
13.6.16. Others
13.7. Market Attractiveness Analysis
13.7.1. By Country
13.7.2. By Component
13.7.3. By Fuel Type
13.7.4. By Application
13.7.5. By End-use
13.8. UAE Burner Management System Market Analysis and Forecast
13.9. Saudi Arabia Burner Management System Market Analysis and Forecast
13.10. South Africa Burner Management System Market Analysis and Forecast
13.11. Rest of MEA Burner Management System Market Analysis and Forecast
*Cross Sectional Analysis would be provided for all regions/countries
14. South America Burner Management System Market Analysis and Forecast
14.1. Key Findings
14.2. Key Trends
14.3. Market Size (US$ Mn) Forecast By Component, 2014 – 2024
14.3.1. Software
14.3.2. Hardware
14.3.2.1. Actuators and Controllers
14.3.2.2. Flame Detectors
14.3.2.3. Shut-off Valves
14.3.2.4. Ignition Units
14.3.2.5. Alarms and Shutdowns
14.3.2.6. Others (Diagnostic tools, IT hardware, etc.)
14.4. Market Size and Volume (US$ Mn and Million Units) Forecast By Fuel Type, 2014 – 2024
14.4.1. Oil
14.4.2. Gas
14.4.3. Electricity
14.5. Market Size and Volume (US$ Mn and Million Units) Forecast By Application, 2014 – 2024
14.5.1. Boilers
14.5.2. Furnace
14.5.3. Kiln and Ovens
14.6. Market Size and Volume (US$ Mn and Million Units) Forecast By End-use, 2014 – 2024
14.6.1. Oil and Gas
14.6.2. Power
14.6.3. Chemicals
14.6.4. Mining, Metal and Mineral (MMM)
14.6.5. Refining
14.6.6. Water
14.6.7. Specialty Chemicals
14.6.8. Pharmaceutical
14.6.9. Food & Beverages
14.6.10. Glass
14.6.11. Ceramics
14.6.12. Alternate Fuel
14.6.13. Building
14.6.14. Automotive
14.6.15. Printing & Publishing
14.6.16. Others
14.7. Market Attractiveness Analysis
14.7.1. By Country
14.7.2. By Component
14.7.3. By Fuel Type
14.7.4. By Application
14.7.5. By End-use
14.8. Brazil Burner Management System Market Analysis and Forecast
14.9. Argentina Burner Management System Market Analysis and Forecast
14.10. Rest of South America Burner Management System Market Analysis and Forecast
*Cross Sectional Analysis would be provided for all regions/countries
15. Competition Landscape
15.1. Market Player – Competition Matrix (By Tier and Size of companies)
15.2. Market Share Analysis By Company (2015)
15.3. Company Profiles (Details – Overview, Financials, Recent Developments, Strategy)
15.3.1. ABB
15.3.1.1. Company Details (Headquarter, Foundation Year, & Employee Strength)
15.3.1.2. Company Description
15.3.1.3. SWOT Analysis
15.3.1.4. Annual Revenue
15.3.1.5. Strategic Overview
15.3.2. Alstom
15.3.2.1. Company Details (Headquarter, Foundation Year, & Employee Strength)
15.3.2.2. Company Description
15.3.2.3. SWOT Analysis
15.3.2.4. Annual Revenue
15.3.2.5. Strategic Overview
15.3.3. Born, Inc.
15.3.3.1. Company Details (Headquarter, Foundation Year, & Employee Strength)
15.3.3.2. Company Description
15.3.3.3. SWOT Analysis
15.3.3.4. Annual Revenue
15.3.3.5. Strategic Overview
15.3.4. Doosan Babcock
15.3.4.1. Company Details (Headquarter, Foundation Year, & Employee Strength)
15.3.4.2. Company Description
15.3.4.3. SWOT Analysis
15.3.4.4. Annual Revenue
15.3.4.5. Strategic Overview
15.3.5. Honeywell International
15.3.5.1. Company Details (Headquarter, Foundation Year, & Employee Strength)
15.3.5.2. Company Description
15.3.5.3. SWOT Analysis
15.3.5.4. Annual Revenue
15.3.5.5. Strategic Overview
15.3.6. Nestec, Inc.
15.3.6.1. Company Details (Headquarter, Foundation Year, & Employee Strength)
15.3.6.2. Company Description
15.3.6.3. SWOT Analysis
15.3.6.4. Annual Revenue
15.3.6.5. Strategic Overview
15.3.7. Pilz GmbH & Co. KG
15.3.7.1. Company Details (Headquarter, Foundation Year, & Employee Strength)
15.3.7.2. Company Description
15.3.7.3. SWOT Analysis
15.3.7.4. Annual Revenue
15.3.7.5. Strategic Overview
15.3.8. Siemens
15.3.8.1. Company Details (Headquarter, Foundation Year, & Employee Strength)
15.3.8.2. Company Description
15.3.8.3. SWOT Analysis
15.3.8.4. Annual Revenue
15.3.8.5. Strategic Overview
15.3.9. The Babcock & Wilcox Company
15.3.9.1. Company Details (Headquarter, Foundation Year, & Employee Strength)
15.3.9.2. Company Description
15.3.9.3. SWOT Analysis
15.3.9.4. Annual Revenue
15.3.9.5. Strategic Overview
15.3.10. Titan Logix Corp.
15.3.10.1. Company Details (Headquarter, Foundation Year, & Employee Strength)
15.3.10.2. Company Description
15.3.10.3. SWOT Analysis
15.3.10.4. Annual Revenue
15.3.10.5. Strategic Overview
16. Key Takeaways
List of Tables
Table 1: Global BMS Market Size (US$ Bn) Forecast, By Component, 2014 – 2024
Table 2: Global BMS Hardware Market Size (US$ Bn) Forecast, By Type, 2014 – 2024
Table 3: Global BMS Market Size (US$ Bn) Forecast, By Fuel Type, 2014 – 2024
Table 4: Global BMS Market Volume (Million Units) Forecast, By Fuel Type, 2014 – 2024
Table 5: Global BMS Market Size (US$ Bn) Forecast, By Application, 2014 – 2024
Table 6: Global BMS Market Volume (Million Units) Forecast, By Application, 2014 – 2024
Table 7: Global BMS Market Size (US$ Bn) Forecast, By End-Use, 2014 – 2024, contd.
Table 8: Global BMS Market Size (US$ Bn) Forecast, By End-Use, 2014 – 2024
Table 9: Global BMS Market Volume (Million Units) Forecast, By End-Use, 2014 – 2024, contd.
Table 10: Global BMS Market Size (Million Units) Forecast, By End-Use, 2014 – 2024
Table 11: Global BMS Market Size (US$ Bn) Forecast, By Region, 2014 – 2024
Table 12: Global BMS Market Volume (Million Units) Forecast, By Region, 2014 – 2024
Table 13: North American BMS Market Size (US$ Bn) Forecast, By Component, 2014 – 2024
Table 14: North America BMS Hardware Market Size (US$ Bn) Forecast, By Type, 2014 – 2024
Table 15: North America BMS Market Size (US$ Bn) Forecast, By Fuel Type, 2014 – 2024
Table 16: North America BMS Market Size (Million Units) Forecast, By Fuel Type, 2014 – 2024
Table 17: North America BMS Market Size (US$ Bn) Forecast, By Application, 2014 – 2024
Table 18: North America BMS Market Volume (Million Units) Forecast, By Application, 2014 – 2024
Table 19: North America BMS Market Size (US$ Bn) Forecast, By End-Use, 2014 – 2024, contd.
Table 20: North America BMS Market Size (US$ Bn) Forecast, By End-Use, 2014 – 2024
Table 21: North America BMS Market Volume (Million Units) Forecast, By End-Use, 2014 – 2024, contd.
Table 22: North America BMS Market Size (Million Units) Forecast, By End-Use, 2014 – 2024
Table 23: The U.S. BMS Market Size (US$ Bn) Forecast, By Component, 2014 – 2024
Table 24: The U.S. BMS Hardware Market Size (US$ Bn) Forecast, By Type, 2014 – 2024
Table 25: The U.S. BMS Market Size (US$ Bn) Forecast, By Fuel Type, 2014 – 2024
Table 26: The U.S. BMS Market Size (Million Units) Forecast, By Fuel Type, 2014 – 2024
Table 27: The U.S. BMS Market Size (US$ Bn) Forecast, By Application, 2014 – 2024
Table 28: The U.S. BMS Market Volume (Million Units) Forecast, By Application, 2014 – 2024
Table 29: The U.S. BMS Market Size (US$ Bn) Forecast, By End-Use, 2014 – 2024, contd.
Table 30: The U.S. BMS Market Size (US$ Bn) Forecast, By End-Use, 2014 – 2024
Table 31: The U.S. BMS Market Volume (Million Units) Forecast, By End-Use, 2014 – 2024, contd.
Table 32: North America BMS Market Size (Million Units) Forecast, By End-Use, 2014 – 2024
Table 33: Canada BMS Market Size (US$ Bn) Forecast, By Component, 2014 – 2024
Table 34: Canada BMS Hardware Market Size (US$ Bn) Forecast, By Type, 2014 – 2024
Table 35: Canada BMS Market Size (US$ Bn) Forecast, By Fuel Type, 2014 – 2024
Table 36: Canada BMS Market Size (Million Units) Forecast, By Fuel Type, 2014 – 2024
Table 37: Canada BMS Market Size (US$ Bn) Forecast, By Application, 2014 – 2024
Table 38: Canada BMS Market Volume (Million Units) Forecast, By Application, 2014 – 2024
Table 39: Canada BMS Market Size (US$ Bn) Forecast, By End-Use, 2014 – 2024, contd.
Table 40: Canada BMS Market Size (US$ Bn) Forecast, By End-Use, 2014 – 2024
Table 41: Canada BMS Market Volume (Million Units) Forecast, By End-Use, 2014 – 2024, contd.
Table 42: Canada BMS Market Size (Million Units) Forecast, By End-Use, 2014 – 2024
Table 43: Rest of North America BMS Market Size (US$ Bn) Forecast, By Component, 2014 – 2024
Table 44: Rest of North America BMS Hardware Market Size (US$ Bn) Forecast, By Type, 2014 – 2024
Table 45: Rest of North America BMS Market Size (US$ Bn) Forecast, By Fuel Type, 2014 – 2024
Table 46: Rest of North America BMS Market Size (Million Units) Forecast, By Fuel Type, 2014 – 2024
Table 47: Rest of North America BMS Market Size (US$ Bn) Forecast, By Application, 2014 – 2024
Table 48: Rest of North America BMS Market Volume (Million Units) Forecast, By Application, 2014 – 2024
Table 49: Rest of North America BMS Market Size (US$ Bn) Forecast, By End-Use, 2014 – 2024, contd.
Table 50: Rest of North America BMS Market Size (US$ Bn) Forecast, By End-Use, 2014 – 2024
Table 51: Rest of North America BMS Market Volume (Million Units) Forecast, By End-Use, 2014 – 2024, contd.
Table 52: Rest of Asia Pacific BMS Market Size (Million Units) Forecast, By End-Use, 2014 – 2024
Table 53: Europe BMS Market Size (US$ Bn) Forecast, By Component, 2014 – 2024
Table 54: Europe BMS Hardware Market Size (US$ Bn) Forecast, By Type, 2014 – 2024
Table 55: Europe BMS Market Size (US$ Bn) Forecast, By Fuel Type, 2014 – 2024
Table 56: Europe BMS Market Volume (Million Units) Forecast, By Fuel Type, 2014 – 2024
Table 57: Europe BMS Market Size (US$ Bn) Forecast, By Application, 2014 – 2024
Table 58: Europe BMS Market Volume (Million Units) Forecast, By Application, 2014 – 2024
Table 59: Europe BMS Market Size (US$ Bn) Forecast, By End-Use, 2014 – 2024, contd.
Table 60: Europe BMS Market Size (US$ Bn) Forecast, By End-Use, 2014 – 2024
Table 61: Europe BMS Market Volume (Million Units) Forecast, By End-Use, 2014 – 2024, contd.
Table 62: Europe BMS Market Volume (Million Units) Forecast, By End-Use, 2014 – 2024
Table 63: The UK BMS Market Size (US$ Bn) Forecast, By Component, 2014 – 2024
Table 64: The UK BMS Hardware Market Size (US$ Bn) Forecast, By Type, 2014 – 2024
Table 65: The UK BMS Market Size (US$ Bn) Forecast, By Fuel Type, 2014 – 2024
Table 66: The UK BMS Market Volume (Million Units) Forecast, By Fuel Type, 2014 – 2024
Table 67: The UK BMS Market Size (US$ Bn) Forecast, By Application, 2014 – 2024
Table 68: The UK BMS Market Volume (Million Units) Forecast, By Application, 2014 – 2024
Table 69: The UK BMS Market Size (US$ Bn) Forecast, By End-Use, 2014 – 2024, contd.
Table 70: The UK BMS Market Size (US$ Bn) Forecast, By End-Use, 2014 – 2024
Table 71: The UK BMS Market Volume (Million Units) Forecast, By End-Use, 2014 – 2024, contd.
Table 72: The UK BMS Market Volume (Million Units) Forecast, By End-Use, 2014 – 2024
Table 73: Germany BMS Market Size (US$ Bn) Forecast, By Component, 2014 – 2024
Table 74: Germany BMS Hardware Market Size (US$ Bn) Forecast, By Type, 2014 – 2024
Table 75: Germany BMS Market Size (US$ Bn) Forecast, By Fuel Type, 2014 – 2024
Table 76: Germany BMS Market Volume (Million Units) Forecast, By Fuel Type, 2014 – 2024
Table 77: Germany BMS Market Size (US$ Bn) Forecast, By Application, 2014 – 2024
Table 78: Germany BMS Market Volume (Million Units) Forecast, By Application, 2014 – 2024
Table 79: Germany BMS Market Size (US$ Bn) Forecast, By End-Use, 2014 – 2024, contd.
Table 80: Germany BMS Market Size (US$ Bn) Forecast, By End-Use, 2014 – 2024
Table 81: Germany BMS Market Volume (Million Units) Forecast, By End-Use, 2014 – 2024, contd.
Table 82: Germany BMS Market Volume (Million Units) Forecast, By End-Use, 2014 – 2024
Table 83: Italy BMS Market Size (US$ Bn) Forecast, By Component, 2014 – 2024
Table 84: Italy BMS Hardware Market Size (US$ Bn) Forecast, By Type, 2014 – 2024
Table 85: Italy BMS Market Size (US$ Bn) Forecast, By Fuel Type, 2014 – 2024
Table 86: Italy BMS Market Volume (Million Units) Forecast, By Fuel Type, 2014 – 2024
Table 87: Italy BMS Market Size (US$ Bn) Forecast, By Application, 2014 – 2024
Table 88: Italy BMS Market Volume (Million Units) Forecast, By Application, 2014 – 2024
Table 89: Italy BMS Market Size (US$ Bn) Forecast, By End-Use, 2014 – 2024, contd.
Table 90: Italy BMS Market Size (US$ Bn) Forecast, By End-Use, 2014 – 2024
Table 91: Italy BMS Market Volume (Million Units) Forecast, By End-Use, 2014 – 2024, contd.
Table 92: Italy BMS Market Volume (Million Units) Forecast, By End-Use, 2014 – 2024
Table 93: France BMS Market Size (US$ Bn) Forecast, By Component, 2014 – 2024
Table 94: France BMS Hardware Market Size (US$ Bn) Forecast, By Type, 2014 – 2024
Table 95: France BMS Market Size (US$ Bn) Forecast, By Fuel Type, 2014 – 2024
Table 96: France BMS Market Volume (Million Units) Forecast, By Fuel Type, 2014 – 2024
Table 97: France BMS Market Size (US$ Bn) Forecast, By Application, 2014 – 2024
Table 98: France BMS Market Volume (Million Units) Forecast, By Application, 2014 – 2024
Table 99: France BMS Market Size (US$ Bn) Forecast, By End-Use, 2014 – 2024, contd.
Table 100: France BMS Market Size (US$ Bn) Forecast, By End-Use, 2014 – 2024
Table 101: France BMS Market Volume (Million Units) Forecast, By End-Use, 2014 – 2024, contd.
Table 102: France BMS Market Volume (Million Units) Forecast, By End-Use, 2014 – 2024
Table 103: Russia BMS Market Size (US$ Bn) Forecast, By Component, 2014 – 2024
Table 104: Russia BMS Hardware Market Size (US$ Bn) Forecast, By Type, 2014 – 2024
Table 105: Russia BMS Market Size (US$ Bn) Forecast, By Fuel Type, 2014 – 2024
Table 106: Russia BMS Market Volume (Million Units) Forecast, By Fuel Type, 2014 – 2024
Table 107: Russia BMS Market Size (US$ Bn) Forecast, By Application, 2014 – 2024
Table 108: Russia BMS Market Volume (Million Units) Forecast, By Application, 2014 – 2024
Table 109: Russia BMS Market Size (US$ Bn) Forecast, By End-Use, 2014 – 2024, contd.
Table 110: Russia BMS Market Size (US$ Bn) Forecast, By End-Use, 2014 – 2024
Table 111: Russia BMS Market Volume (Million Units) Forecast, By End-Use, 2014 – 2024, contd.
Table 112: Russia BMS Market Volume (Million Units) Forecast, By End-Use, 2014 – 2024
Table 113: Rest of Europe BMS Market Size (US$ Bn) Forecast, By Component, 2014 – 2024
Table 114: Rest of Europe BMS Hardware Market Size (US$ Bn) Forecast, By Type, 2014 – 2024
Table 115: Rest of Europe BMS Market Size (US$ Bn) Forecast, By Fuel Type, 2014 – 2024
Table 116: Rest of Europe BMS Market Volume (Million Units) Forecast, By Fuel Type, 2014 – 2024
Table 117: Rest of Europe BMS Market Size (US$ Bn) Forecast, By Application, 2014 – 2024
Table 118: Rest of Europe BMS Market Volume (Million Units) Forecast, By Application, 2014 – 2024
Table 119: Rest of Europe BMS Market Size (US$ Bn) Forecast, By End-Use, 2014 – 2024, contd.
Table 120: Rest of Europe BMS Market Size (US$ Bn) Forecast, By End-Use, 2014 – 2024
Table 121: Rest of Europe BMS Market Volume (Million Units) Forecast, By End-Use, 2014 – 2024, contd.
Table 122: Rest of Europe BMS Market Volume (Million Units) Forecast, By End-Use, 2014 – 2024
Table 123: Asia Pacific BMS Market Size (US$ Bn) Forecast, By Component, 2014 – 2024
Table 124: Asia Pacific BMS Hardware Market Size (US$ Bn) Forecast, By Type, 2014 – 2024
Table 125: Asia Pacific BMS Market Size (US$ Bn) Forecast, By Fuel Type, 2014 – 2024
Table 126: Asia Pacific BMS Market Volume (Million Units) Forecast, By Fuel Type, 2014 – 2024
Table 127: Asia Pacific BMS Market Size (US$ Bn) Forecast, By Application, 2014 – 2024
Table 128: Asia Pacific BMS Market Volume (Million Units) Forecast, By Application, 2014 – 2024
Table 129: Asia Pacific BMS Market Size (US$ Bn) Forecast, By End-Use, 2014 – 2024, contd.
Table 130: Asia Pacific BMS Market Size (US$ Bn) Forecast, By End-Use, 2014 – 2024
Table 131: Asia Pacific BMS Market Volume (Million Units) Forecast, By End-Use, 2014 – 2024, contd.
Table 132: Asia Pacific BMS Market Size (Million Units) Forecast, By End-Use, 2014 – 2024
Table 133: India BMS Market Size (US$ Bn) Forecast, By Component, 2014 – 2024
Table 134: India BMS Hardware Market Size (US$ Bn) Forecast, By Type, 2014 – 2024
Table 135: India BMS Market Size (US$ Bn) Forecast, By Fuel Type, 2014 – 2024
Table 136: India BMS Market Volume (Million Units) Forecast, By Fuel Type, 2014 – 2024
Table 137: India BMS Market Size (US$ Bn) Forecast, By Application, 2014 – 2024
Table 138: India BMS Market Volume (Million Units) Forecast, By Application, 2014 – 2024
Table 139: India BMS Market Size (US$ Bn) Forecast, By End-Use, 2014 – 2024, contd.
Table 140: India BMS Market Size (US$ Bn) Forecast, By End-Use, 2014 – 2024
Table 141: India BMS Market Volume (Million Units) Forecast, By End-Use, 2014 – 2024, contd.
Table 142: India BMS Market Size (Million Units) Forecast, By End-Use, 2014 – 2024
Table 143: China BMS Market Size (US$ Bn) Forecast, By Component, 2014 – 2024
Table 144: China BMS Hardware Market Size (US$ Bn) Forecast, By Type, 2014 – 2024
Table 145: China BMS Market Size (US$ Bn) Forecast, By Fuel Type, 2014 – 2024
Table 146: China BMS Market Volume (Million Units) Forecast, By Fuel Type, 2014 – 2024
Table 147: China BMS Market Size (US$ Bn) Forecast, By Application, 2014 – 2024
Table 148: China BMS Market Volume (Million Units) Forecast, By Application, 2014 – 2024
Table 149: China BMS Market Size (US$ Bn) Forecast, By End-Use, 2014 – 2024, contd.
Table 150: China BMS Market Size (US$ Bn) Forecast, By End-Use, 2014 – 2024
Table 151: China BMS Market Volume (Million Units) Forecast, By End-Use, 2014 – 2024, contd.
Table 152: China BMS Market Size (Million Units) Forecast, By End-Use, 2014 – 2024
Table 153: Korea BMS Market Size (US$ Bn) Forecast, By Component, 2014 – 2024
Table 154: Korea BMS Hardware Market Size (US$ Bn) Forecast, By Type, 2014 – 2024
Table 155: Korea BMS Market Size (US$ Bn) Forecast, By Fuel Type, 2014 – 2024
Table 156: Korea BMS Market Volume(Million Unit) Forecast, By Fuel Type, 2014 – 2024
Table 157: Korea BMS Market Size (US$ Bn) Forecast, By Application, 2014 – 2024
Table 158: Korea BMS Market Volume (Million Units) Forecast, By Application, 2014 – 2024
Table 159: Korea BMS Market Size (US$ Bn) Forecast, By End-Use, 2014 – 2024, contd.
Table 160: Korea BMS Market Size (US$ Bn) Forecast, By End-Use, 2014 – 2024
Table 161: Korea BMS Market Volume (Million Units) Forecast, By End-Use, 2014 – 2024, contd.
Table 162: Korea BMS Market Size (Million Units) Forecast, By End-Use, 2014 – 2024
Table 163: Japan BMS Market Size (US$ Bn) Forecast, By Component, 2014 – 2024
Table 164: Japan BMS Hardware Market Size (US$ Bn) Forecast, By Type, 2014 – 2024
Table 165: Japan BMS Market Size (US$ Bn) Forecast, By Fuel Type, 2014 – 2024
Table 166: Japan BMS Market Volume (Million Units) Forecast, By Fuel Type, 2014 – 2024
Table 167: Japan BMS Market Size (US$ Bn) Forecast, By Application, 2014 – 2024
Table 168: Japan BMS Market Volume (Million Units) Forecast, By Application, 2014 – 2024
Table 169: Japan BMS Market Size (US$ Bn) Forecast, By End-Use, 2014 – 2024, contd.
Table 170: Japan BMS Market Size (US$ Bn) Forecast, By End-Use, 2014 – 2024
Table 171: Japan BMS Market Volume (Million Units) Forecast, By End-Use, 2014 – 2024, contd.
Table 172: Japan BMS Market Size (Million Units) Forecast, By End-Use, 2014 – 2024
Table 173: SEA BMS Market Size (US$ Bn) Forecast, By Component, 2014 – 2024
Table 174: SEA BMS Hardware Market Size (US$ Bn) Forecast, By Type, 2014 – 2024
Table 175: SEA BMS Market Size (US$ Bn) Forecast, By Fuel Type, 2014 – 2024
Table 176: SEA BMS Market Volume (Million Units) Forecast, By Fuel Type, 2014 – 2024
Table 177: SEA BMS Market Size (US$ Bn) Forecast, By Application, 2014 – 2024
Table 178: SEA BMS Market Volume (Million Units) Forecast, By Application, 2014 – 2024
Table 179: SEA BMS Market Size (US$ Bn) Forecast, By End-Use, 2014 – 2024, contd.
Table 180: SEA BMS Market Size (US$ Bn) Forecast, By End-Use, 2014 – 2024
Table 181: SEA BMS Market Volume (Million Units) Forecast, By End-Use, 2014 – 2024, contd.
Table 182: SEA BMS Market Size (Million Units) Forecast, By End-Use, 2014 – 2024
Table 183: Rest of Asia Pacific BMS Market Size (US$ Bn) Forecast, By Component, 2014 – 2024
Table 184: Rest of Asia Pacific BMS Hardware Market Size (US$ Bn) Forecast, By Type, 2014 – 2024
Table 185: Rest of Asia Pacific BMS Market Size (US$ Bn) Forecast, By Fuel Type, 2014 – 2024
Table 186: Rest of Asia Pacific BMS Market Volume (Million Units) Forecast, By Fuel Type, 2014 – 2024
Table 187: Rest of Asia Pacific BMS Market Size (US$ Bn) Forecast, By Application, 2014 – 2024
Table 188: Rest of Asia Pacific BMS Market Volume (Million Units) Forecast, By Application, 2014 – 2024
Table 189: Rest of Asia Pacific BMS Market Size (US$ Bn) Forecast, By End-Use, 2014 – 2024, contd.
Table 190: Rest of Asia Pacific BMS Market Size (US$ Bn) Forecast, By End-Use, 2014 – 2024
Table 191: Rest of Asia Pacific BMS Market Volume (Million Units) Forecast, By End-Use, 2014 – 2024, contd.
Table 192: Rest of Asia Pacific BMS Market Size (Million Units) Forecast, By End-Use, 2014 – 2024
Table 192: MEA BMS Market Size (US$ Bn) Forecast, By Component, 2014 – 2024
Table 193: MEA BMS Hardware Market Size (US$ Bn) Forecast, By Type, 2014 – 2024
Table 194: MEA BMS Market Size (US$ Bn) Forecast, By Fuel Type, 2014 – 2024
Table 195: MEA BMS Market Volume (Million Units) Forecast, By Fuel Type, 2014 – 2024
Table 196: MEA BMS Market Size (US$ Bn) Forecast, By Application, 2014 – 2024
Table 197: MEA BMS Market Volume (Million Units) Forecast, By Application, 2014 – 2024
Table 198: MEA BMS Market Size (US$ Bn) Forecast, By End-Use, 2014 – 2024, contd.
Table 199: MEA BMS Market Size (US$ Bn) Forecast, By End-Use, 2014 – 2024
Table 200: MEA BMS Market Volume (Million Units) Forecast, By End-Use, 2014 – 2024, contd.
Table 201: MEA BMS Market Volume (Million Units) Forecast, By End-Use, 2014 – 2024
Table 202: UAE BMS Market Size (US$ Bn) Forecast, By Component, 2014 – 2024
Table 203: UAE BMS Hardware Market Size (US$ Bn) Forecast, By Type, 2014 – 2024
Table 204: UAE BMS Market Size (US$ Bn) Forecast, By Fuel Type, 2014 – 2024
Table 205: UAE BMS Market Volume (Million Units) Forecast, By Fuel Type, 2014 – 2024
Table 206: UAE BMS Market Size (US$ Bn) Forecast, By Application, 2014 – 2024
Table 207: UAE BMS Market Volume (Million Units) Forecast, By Application, 2014 – 2024
Table 208: UAE BMS Market Size (US$ Bn) Forecast, By End-Use, 2014 – 2024, contd.
Table 209: UAE BMS Market Size (US$ Bn) Forecast, By End-Use, 2014 – 2024
Table 210: UAE BMS Market Volume (Million Units) Forecast, By End-Use, 2014 – 2024, contd.
Table 211: UAE BMS Market Volume (Million Units) Forecast, By End-Use, 2014 – 2024
Table 212: Saudi Arabia BMS Market Size (US$ Bn) Forecast, By Component, 2014 – 2024
Table 213: Saudi Arabia BMS Hardware Market Size (US$ Bn) Forecast, By Type, 2014 – 2024
Table 214: Saudi Arabia BMS Market Size (US$ Bn) Forecast, By Fuel Type, 2014 – 2024
Table 215: Saudi Arabia BMS Market Volume (Million Units) Forecast, By Fuel Type, 2014 – 2024
Table 216: Saudi Arabia BMS Market Size (US$ Bn) Forecast, By Application, 2014 – 2024
Table 217: Saudi Arabia BMS Market Volume (Million Units) Forecast, By Application, 2014 – 2024
Table 218: Saudi Arabia BMS Market Size (US$ Bn) Forecast, By End-Use, 2014 – 2024, contd.
Table 219: Saudi Arabia BMS Market Size (US$ Bn) Forecast, By End-Use, 2014 – 2024
Table 220: Saudi Arabia BMS Market Volume (Million Units) Forecast, By End-Use, 2014 – 2024, contd.
Table 221: Saudi Arabia BMS Market Volume (Million Units) Forecast, By End-Use, 2014 – 2024
Table 222: South Africa BMS Market Size (US$ Bn) Forecast, By Component, 2014 – 2024
Table 223: South Africa BMS Hardware Market Size (US$ Bn) Forecast, By Type, 2014 – 2024
Table 224: South Africa BMS Market Size (US$ Bn) Forecast, By Fuel Type, 2014 – 2024
Table 225: South Africa BMS Market Volume (Million Units) Forecast, By Fuel Type, 2014 – 2024
Table 226: South Africa BMS Market Size (US$ Bn) Forecast, By Application, 2014 – 2024
Table 227: South Africa BMS Market Volume (Million Units) Forecast, By Application, 2014 – 2024
Table 228: South Africa BMS Market Size (US$ Bn) Forecast, By End-Use, 2014 – 2024, contd.
Table 229: South Africa BMS Market Size (US$ Bn) Forecast, By End-Use, 2014 – 2024
Table 230: South Africa BMS Market Volume (Million Units) Forecast, By End-Use, 2014 – 2024, contd.
Table 231: South Africa BMS Market Volume (Million Units) Forecast, By End-Use, 2014 – 2024
Table 232: Rest of MEA BMS Market Size (US$ Bn) Forecast, By Component, 2014 – 2024
Table 233: Rest of MEA BMS Hardware Market Size (US$ Bn) Forecast, By Type, 2014 – 2024
Table 234: Rest of MEA BMS Market Size (US$ Bn) Forecast, By Fuel Type, 2014 – 2024
Table 235: Rest of MEA BMS Market Volume (Million Units) Forecast, By Fuel Type, 2014 – 2024
Table 236: Rest of MEA BMS Market Size (US$ Bn) Forecast, By Application, 2014 – 2024
Table 237: Rest of MEA BMS Market Volume (Million Units) Forecast, By Application, 2014 – 2024
Table 238: Rest of MEA BMS Market Size (US$ Bn) Forecast, By End-Use, 2014 – 2024, contd.
Table 239: Rest of MEA BMS Market Size (US$ Bn) Forecast, By End-Use, 2014 – 2024
Table 240: Rest of MEA BMS Market Volume (Million Units) Forecast, By End-Use, 2014 – 2024, contd.
Table 241: Rest of MEA BMS Market Volume (Million Units) Forecast, By End-Use, 2014 – 2024
Table 242: South America BMS Market Size (US$ Bn) Forecast, By Component, 2014 – 2024
Table 243: South America BMS Hardware Market Size (US$ Bn) Forecast, By Type, 2014 – 2024
Table 244: South America BMS Market Size (US$ Bn) Forecast, By Fuel Type, 2014 – 2024
Table 245: South America BMS Market Size (Million Units) Forecast, By Fuel Type, 2014 – 2024
Table 246: South America BMS Market Size (US$ Bn) Forecast, By Application, 2014 – 2024
Table 247: South America BMS Market Volume (Million Units) Forecast, By Application, 2014 – 2024
Table 248: South America BMS Market Size (US$ Bn) Forecast, By End-Use, 2014 – 2024, contd.
Table 249: South America BMS Market Size (US$ Bn) Forecast, By End-Use, 2014 – 2024
Table 250: South America BMS Market Volume (Million Units) Forecast, By End-Use, 2014 – 2024, contd.
Table 251: South America BMS Market Size (Million Units) Forecast, By End-Use, 2014 – 2024
Table 252: Brazil BMS Market Size (US$ Bn) Forecast, By Component, 2014 – 2024
Table 253: Brazil BMS Hardware Market Size (US$ Bn) Forecast, By Type, 2014 – 2024
Table 254: Brazil BMS Market Size (US$ Bn) Forecast, By Fuel Type, 2014 – 2024
Table 255: Brazil BMS Market Volume (Million Units) Forecast, By Fuel Type, 2014 – 2024
Table 256: Brazil BMS Market Size (US$ Bn) Forecast, By Application, 2014 – 2024
Table 257: Brazil BMS Market Volume (Million Units) Forecast, By Application, 2014 – 2024
Table 258: Brazil BMS Market Size (US$ Bn) Forecast, By End-Use, 2014 – 2024, contd.
Table 259: Brazil BMS Market Size (US$ Bn) Forecast, By End-Use, 2014 – 2024
Table 260: Brazil BMS Market Volume (Million Units) Forecast, By End-Use, 2014 – 2024, contd.
Table 261: Brazil BMS Market Size (Million Units) Forecast, By End-Use, 2014 – 2024
Table 262: Argentina BMS Market Size (US$ Bn) Forecast, By Component, 2014 – 2024
Table 263: Argentina BMS Hardware Market Size (US$ Bn) Forecast, By Type, 2014 – 2024
Table 264: Argentina BMS Market Size (US$ Bn) Forecast, By Fuel Type, 2014 – 2024
Table 265: Argentina BMS Market Volume (Million Units) Forecast, By Fuel Type, 2014 – 2024
Table 266: Argentina BMS Market Size (US$ Bn) Forecast, By Application, 2014 – 2024
Table 267: Argentina BMS Market Volume (Million Units) Forecast, By Application, 2014 – 2024
Table 268: Argentina BMS Market Size (US$ Bn) Forecast, By End-Use, 2014 – 2024, contd.
Table 269: Argentina BMS Market Size (US$ Bn) Forecast, By End-Use, 2014 – 2024
Table 270: Argentina BMS Market Volume (Million Units) Forecast, By End-Use, 2014 – 2024, contd.
Table 271: Argentina BMS Market Size (Million Units) Forecast, By End-Use, 2014 – 2024
Table 272: Rest of South America BMS Market Size (US$ Bn) Forecast, By Component, 2014 – 2024
Table 273: Rest of South America BMS Hardware Market Size (US$ Bn) Forecast, By Type, 2014 – 2024
Table 274: Rest of South America BMS Market Size (US$ Bn) Forecast, By Fuel Type, 2014 – 2024
Table 275: Rest of South America BMS Market Size (Million Units) Forecast, By Fuel Type, 2014 – 2024
Table 276: Rest of South America BMS Market Size (US$ Bn) Forecast, By Application, 2014 – 2024
Table 277: Rest of South America BMS Market Volume (Million Units) Forecast, By Application, 2014 – 2024
Table 278: Rest of South America BMS Market Size (US$ Bn) Forecast, By End-Use, 2014 – 2024, contd.
Table 279: Rest of South America BMS Market Size (US$ Bn) Forecast, By End-Use, 2014 – 2024
Table 280: Rest of South America BMS Market Volume (Million Units) Forecast, By End-Use, 2014 – 2024, contd.
Table 281: Rest of South America BMS Market Size (Million Units) Forecast, By End-Use, 2014 – 2024
List of Figures
Figure 1: Global BMS Market Size and Volume (US$ Bn and Million Units) Forecast, 2014 – 2024
Figure 2: Global Supply Demand Scenario, By Market Players, Gist Graph
Figure 3: Market Value Share By Component (2016)
Figure 5: Market Value Share By Application (2016)
Figure 4: Market Value Share By Fuel Type (2016)
Figure 6: Market Value Share By End-Use (2016)
Figure 7: Global BMS Market Value Share Analysis, By Component, 2016 and 2024
Figure 8: BMS Hardware Graph
Figure 9: BMS Software Graph
Figure 10: Comparison Matrix
Figure 11: BMS Market Attractiveness Analysis, By Component
Figure 12: Global BMS Market Value Share Analysis, By Fuel Type, 2016 and 2024
Figure 13: Global BMS Market Volume Share Analysis, By Fuel Type, 2016 and 2024
Figure 14: Oil Graph
Figure 15: Gas Graph
Figure 16: Power Graph
Figure 17: Comparison Matrix
Figure 18: BMS Market Attractiveness Analysis, By Fuel Type
Figure 19: Global BMS Market Value Share Analysis, By Application, 2016 and 2024
Figure 20: Global BMS Market Volume Share Analysis, By Application, 2016 and 2024
Figure 21: Boilers Graph
Figure 22: Furnace Graph
Figure 23: Kilns and Ovens Graph
Figure 24: Comparison Matrix
Figure 25: BMS Market Attractiveness Analysis, By Application
Figure 26: Global BMS Market Value Share Analysis, By End-Use, 2016 and 2024
Figure 27: Global BMS Market Volume Share Analysis, By End-Use, 2016 and 2024
Figure 28: Segment Growth Matrix, 2016 - 24 (%)
Figure 29: Segment Revenue Contribution, 2016 - 24 (%)
Figure 30: BMS Market Attractiveness Analysis (Top 3), By End-Use
Figure 32: BMS Market Attractiveness Analysis, By Region
Figure 33: North America BMS Market Size (US$ Bn) Forecast, 2014 – 2024
Figure 34: North America BMS Market Size and Volume Y-o-Y Growth Projection, 2014 – 2024
Figure 35: North American BMS Market Value Share Analysis, By Component, 2016 and 2024
Figure 36: North American BMS Market Value Share Analysis, By Fuel Type, 2016 and 2024
Figure 37: North American BMS Market Volume Share Analysis, By Fuel Type, 2016 and 2024
Figure 38: North America BMS Market Value Share Analysis, By Application, 2016 and 2024
Figure 39: North America BMS Market Volume Share Analysis, By Application, 2016 and 2024
Figure 40: North American BMS Market Value Share Analysis, By End-Use, 2016 and 2024
Figure 41: North American BMS Market Volume Share Analysis, By End-Use, 2016 and 2024
Figure 43: North America BMS Market Attractiveness Analysis, By Fuel Type
Figure 45: North America BMS Market Attractiveness Analysis, By End-Use
Figure 44: North America BMS Market Attractiveness Analysis, By Application
Figure 46: North America BMS Market Attractiveness Analysis, By Country
Figure 47: The U.S. BMS Market Size and Volume (US$ Bn and Million Units) Forecast, 2014 – 2024
Figure 48: Canada BMS Market Size and Volume (US$ Bn and Million Units) Forecast, By Component, 2014 – 2024
Figure 49: Rest of North America BMS Market Size and Volume (US$ Bn and Million Units) Forecast, 2014 – 2024
Figure 50: Europe BMS Market Size (US$ Bn and Million Units) Forecast, 2014 – 2024
Figure 51: Europe BMS Market Size and Volume Y-o-Y Growth Projection, 2014 – 2024
Figure 52: Europe BMS Market Value Share Analysis, By Component, 2016 and 2024
Figure 53: Europe BMS Market Value Share Analysis, By Fuel Type, 2016 and 2024
Figure 54: Europe BMS Market Volume Share Analysis, By Fuel Type, 2016 and 2024
Figure 55: Europe BMS Market Value Share Analysis, By Application, 2016 and 2024
Figure 56: Europe BMS Market Volume Share Analysis, By Application, 2016 and 2024
Figure 57: Europe BMS Market Value Share Analysis, By End-Use, 2016 and 2024
Figure 58: Europe BMS Market Volume Share Analysis, By End-Use, 2016 and 2024
Figure 60: Europe BMS Market Attractiveness Analysis, By Application
Figure 62: Europe BMS Market Attractiveness Analysis, By End-Use
Figure 61: Europe BMS Market Attractiveness Analysis, By Fuel Type
Figure 63: Europe BMS Market Attractiveness Analysis, By Country
Figure 64: The UK BMS Market Size and Volume (US$ Bn and Million Units) Forecast, 2014 – 2024
Figure 65: Germany BMS Market Size and Volume (US$ Bn and Million Units) Forecast, 2014 – 2024
Figure 66: Italy BMS Market Size and Volume (US$ Bn and Million Units) Forecast, 2014 – 2024
Figure 67: France BMS Market Size and Volume (US$ Bn and Million Units) Forecast, 2014 – 2024
Figure 68: Russia BMS Market Size and Volume (US$ Bn and Million Units) Forecast, 2014 – 2024
Figure 69: Rest of Europe BMS Market Size and Volume (US$ Bn and Million Units) Forecast, 2014 – 2024
Figure 70: Asia Pacific BMS Market Size (US$ Bn and Million Units) Forecast, 2014 – 2024
Figure 71: Asia Pacific BMS Market Size and Volume Y-o-Y Growth Projection, 2014 – 2024
Figure 72: Asia Pacific BMS Market Value Share Analysis, By Component, 2016 and 2024
Figure 73: Asia Pacific BMS Market Value Share Analysis, By Fuel Type, 2016 and 2024
Figure 74: Asia Pacifica BMS Market Volume Share Analysis, By Fuel Type, 2016 and 2024
Figure 75: Asia Pacific BMS Market Value Share Analysis, By Application, 2016 and 2024
Figure 76: Asia Pacific BMS Market Volume Share Analysis, By Application, 2016 and 2024
Figure 77: Asia Pacific BMS Market Value Share Analysis, By End-Use, 2016 and 2024
Figure 78: Asia Pacific BMS Market Volume Share Analysis, By End-Use, 2016 and 2024
Figure 80: Asia Pacific BMS Market Attractiveness Analysis, By Application
Figure 82: Asia Pacific BMS Market Attractiveness Analysis, By End-Use
Figure 81: Asia Pacific BMS Market Attractiveness Analysis, By Fuel Type
Figure 83: Asia Pacific BMS Market Attractiveness Analysis, By Country
Figure 84: India BMS Market Size and Volume (US$ Bn and Million Units) Forecast, 2014 – 2024
Figure 85: China BMS Market Size and Volume (US$ Bn and Million Units) Forecast, 2014 – 2024
Figure 86: Korea BMS Market Size and Volume (US$ Bn and Million Units) Forecast, 2014 – 2024
Figure 87: Japan BMS Market Size and Volume (US$ Bn and Million Units) Forecast, 2014 – 2024
Figure 88: SEA BMS Market Size and Volume (US$ Bn and Million Units) Forecast, 2014 – 2024
Figure 89: Rest of Asia Pacific BMS Market Size and Volume (US$ Bn and Million Units) Forecast, 2014 – 2024
Figure 90: MEA BMS Market Size (US$ Bn and Million Units) Forecast, 2014 – 2024
Figure 91: MEA BMS Market Size and Volume Y-o-Y Growth Projection, 2014 – 2024
Figure 92: MEA BMS Market Value Share Analysis, By Component, 2016 and 2024
Figure 93: MEA BMS Market Value Share Analysis, By Fuel Type, 2016 and 2024
Figure 94: MEA BMS Market Volume Share Analysis, By Fuel Type, 2016 and 2024
Figure 95: MEA BMS Market Value Share Analysis, By Application, 2016 and 2024
Figure 96: MEA BMS Market Volume Share Analysis, By Application, 2016 and 2024
Figure 97: MEA BMS Market Value Share Analysis, By End-Use, 2016 and 2024
Figure 98: MEA BMS Market Volume Share Analysis, By End-Use, 2016 and 2024
Figure 100: MEA BMS Market Attractiveness Analysis, By Fuel Type
Figure 102: MEA BMS Market Attractiveness Analysis, By End-Use
Figure 101: MEA BMS Market Attractiveness Analysis, By Application
Figure 103: MEA BMS Market Attractiveness Analysis, By Country
Figure 104: UAE BMS Market Size and Volume (US$ Bn and Million Units) Forecast, 2014 – 2024
Figure 105: Saudi Arabia BMS Market Size and Volume (US$ Bn and Million Units) Forecast, 2014 – 2024
Figure 106: South Africa BMS Market Size and Volume (US$ Bn and Million Units) Forecast, By Component, 2014 – 2024
Figure 107: Rest of MEA BMS Market Size and Volume (US$ Bn and Million Units) Forecast, 2014 – 2024
Figure 108: South America BMS Market Size (US$ Bn and Million Units) Forecast, 2014 – 2024
Figure 109: South America BMS Market Size and Volume Y-o-Y Growth Projection, 2014 – 2024
Figure 110: South America BMS Market Value Share Analysis, By Component, 2016 and 2024
Figure 111: South America BMS Market Value Share Analysis, By Fuel Type, 2016 and 2024
Figure 112: South America BMS Market Volume Share Analysis, By Fuel Type, 2016 and 2024
Figure 113: South America BMS Market Value Share Analysis, By Application, 2016 and 2024
Figure 114: South America BMS Market Volume Share Analysis, By Application, 2016 and 2024
Figure 115: South America BMS Market Value Share Analysis, By End-Use, 2016 and 2024
Figure 116: South America BMS Market Volume Share Analysis, By End-Use, 2016 and 2024
Figure 118: South America BMS Market Attractiveness Analysis, By Fuel Type
Figure 120: South America BMS Market Attractiveness Analysis, By End-Use
Figure 119: South America BMS Market Attractiveness Analysis, By Application
Figure 121: South America BMS Market Attractiveness Analysis, By Country
Figure 122: Brazil BMS Market Size and Volume (US$ Bn and Million Units) Forecast, 2014 – 2024
Figure 123: Argentina BMS Market Size and Volume (US$ Bn and Million Units) Forecast, 2014 – 2024
Figure 124: Rest of South America BMS Market Size and Volume (US$ Bn and Million Units) Forecast, 2014 – 2024
Figure 125: Global Burner Management System Market Share Analysis By Company (2015)
Copyright © Transparency Market Research, Inc. All Rights reserved
Trust Online

Burner Management System (BMS) Market Growth Outlook