
Reports
Reports
Analysts’ Viewpoint on Biocompatible 3D Printing Materials Market Scenario
Biocompatible 3D printing materials manufacturers are focusing on key applications, such as implants & prostheses, tissue engineering and prototyping, and surgical guides, owing to a surge in the demand for biocompatible 3D printing materials in the medical industry. Three-dimensional (3D) and four-dimensional (4D) printing is emerging as a trend for the fabrication of complex structures in the biocompatible 3D printing materials market. High precision and layer-by-layer addition of intelligent materials are paving the way for dynamic 3D structures for stakeholders and manufacturers. Moreover, manufacturers are also investing in the development of product quality to consolidate their position in the market. Apart from tissue engineering and biocompatible implant and prosthesis, stakeholders in the biocompatible 3D printing materials market are emphasizing on innovation in synthetic hydrogels, as they have similar properties to bio-polymeric hydrogels, which are used for printing applications. Increased demand for metal implants used in orthopedic and dental applications is being witnessed in the biocompatible 3D printing materials market.
Biocompatible materials are used for 3D printing in various medical applications, including dental and orthopedic implants, drug delivery, hearing aids, tissue engineering scaffolds, and prosthesis.
Commonly employed biocompatible 3D printing materials include polymers, metals, ceramics, bio-inks, composites, and carbon compounds. Polymers are widely used biocompatible 3D printing materials.
3D printing facilitates the easy production of orthopedic implants, dental devices, surgical guides, anatomical models, medical tools, prosthesis, and custom enclosures. 3D printing is also used for the printing of organs, bone regeneration, and drug release.
Biocompatible resins exhibit diverse physical properties, ranging from ultra-hard and tough (non-brittle) to flexible and elastic grades, and they can be custom designed for the manufacturing of medical devices. Biocompatible resin can produce plastic parts with high resolution and accuracy, fine details, and smooth surface finishes. Biocomposites do not produce a toxic or immunological response when exposed to the body or bodily fluids.
Biocompatible 3D printing resin can be utilized for drilling templates, pilot drill guides, and device sizing templates that are accurate, high quality, and meet performance needs. Biocompatible 3D printing filament can effectively use biocompatible plastics, elastomers, and metals for prototypes and functional parts
The global biocompatible 3D printing materials market is estimated to advance significantly during the forecast period, owing to the favorable properties of biocompatible 3D printing materials, specifically for various applications such as implants & prostheses and prototyping & surgical guides.
Extensive research is being undertaken on the development of biocompatible materials to be utilized in the medical industry. Materials used in the medical field need to be biocompatible, as non-compatibility can lead to foreign body reaction in the patient. This can result in inflammation, delay in wound healing, and certain other immunological responses.
Biocompatibility of materials also helps facilitate improvements in surgical time, improve the rate of surgical success, and shorten the length of recovery time required post-surgery.
Consequently, the utilization of biocompatible materials has increased rapidly across the healthcare industry and more specifically in applications such as implants, scaffolds, and tissue engineering. The number of implants, surgeries, and other medical procedures is rising and the need for biocompatible materials across these procedures is anticipated to boost the demand for biocompatible 3D printing materials during the forecast period.
The dental sector is evolving continuously toward the use of latest technological advances. Presently, computer-aided design and manufacturing (CAD/CAM), which includes additive manufacturing (AM) techniques, are often used for the digital workflow in dentistry. Such technologies are used for the design of dental arches and appliances through data recording with intraoral scanners.
The mechanical properties of biocompatible materials have to be taken into account to properly design dental devices with 3D printing technology. An inappropriate choice of material can lead to breakage or high deformation, causing poor performance of the manufactured device.
CAD/CAM technologies are employing new biocompatible materials and the accuracy and speed of the manufacturing process are increasing consistently. Therefore, the demand for biocompatible 3D printing materials is expected to rise in dental appliances.
In terms of product, the global biocompatible 3D printing materials market has been classified into polymers, metals, and others.
The metals segment dominated the global biocompatible 3D printing materials market and held more than 60% share in 2021. This can be primarily because metals offer better corrosion resistance, excellent strength-to weight ratio, low magnetic susceptibility, fatigue resistance, and biocompatibility. Metals that offer high resistance to corrosion; have the capability of being sterilized, and are biocompatible are used for 3D printing of implants and other orthopedic objects. The segment is estimated to expand at a notable CAGR of 16.1% during the forecast period.
In terms of form, the global biocompatible 3D printing materials market has been classified into powder, liquid, and others.
The powder segment dominated the global biocompatible 3D printing materials market and held more than 48% share in 2021. Powder is the predominantly used form of biocompatible 3D printing materials as compared to liquid. Polymers are primarily extruded into filaments and are 3D printed using the fused deposition model (FDM) and the stereolithography (SLA) process. The market share held by the powder segment is expected to rise during the forecast period. The segment is estimated to expand at a prominent CAGR of 16.4% during the forecast period.
In terms of volume, North America leads the global biocompatible 3D printing materials market. This can be ascribed to the strong demand for biocompatible 3D printing materials in orthopedic surgeries, cosmetic implants, and tissue engineering applications in the region. North America is economically and technologically developed. This increases the likelihood of people opting for expensive and sophisticated surgical procedures. North America accounted for more than 35% share of the global biocompatible 3D printing materials market in 2021.
In terms of volume, Europe and Asia Pacific are also major markets for biocompatible 3D printing materials. These regions accounted for 31.5% and 22.0% value share, respectively, of the global market in 2021.
Middle East & Africa is the larger market for biocompatible 3D printing materials than Latin America; however, the market in Latin America is likely to expand at a higher growth rate during the forecast period.
The global biocompatible 3D printing materials market is highly consolidated, with a small number of large-scale vendors controlling majority of the share. Most companies are investing considerably in comprehensive research and development activities, primarily to create environment-friendly products. Expansion of product portfolios and mergers and acquisitions are prominent strategies adopted by key players. 3D Systems, Inc., Envisiontec, Inc., Renishaw plc, Evonik Industries AG, EOS GmbH, Concept Laser, Inc., and Stratasys Ltd. are the key entities operating in the market.
Each of these players has been profiled in the biocompatible 3D printing materials market report based on parameters such as company overview, financial overview, business strategies, product portfolio, business segments, and recent developments
|
Attribute |
Detail |
|
Market Size Value in 2021 |
US$ 4.3 Bn |
|
Market Forecast Value in 2031 |
US$ 19.7 Bn |
|
Growth Rate (CAGR) |
18.4% |
|
Forecast Period |
2022–2031 |
|
Historical Data Available for |
2020 |
|
Quantitative Units |
US$ Bn for Value and Tons for Volume |
|
Market Analysis |
It includes cross-segment analysis at the global as well as regional level. Furthermore, the qualitative analysis includes drivers, restraints, opportunities, key trends, Porter’s Five Forces analysis, value chain analysis, and key trend analysis. |
|
Competition Landscape |
|
|
Format |
Electronic (PDF) + Excel |
|
Market Segmentation |
|
|
Regions Covered |
|
|
Countries Covered |
|
|
Companies Profiled |
|
|
Customization Scope |
Available upon request |
|
Pricing |
Available upon request |
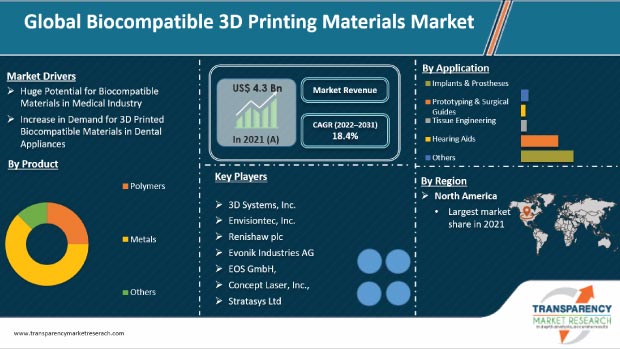
The biocompatible 3D printing materials market stood at US$ 4.3 Bn in 2021.
The biocompatible 3D printing materials market is expected to rise at a CAGR of 18.4% from 2022 to 2031.
Huge potential for biocompatible materials in medical industry and increase in demand of 3d printed biocompatible materials in dental appliances.
Metals was the largest product segment that held more than 60% value share in 2021.
North America was the most lucrative region and held more than 35% share of the global biocompatible 3D printing materials market in 2021.
3D Systems, Inc., Envisiontec, Inc., Renishaw plc, Evonik Industries AG, EOS GmbH, Concept Laser, Inc., and Stratasys Ltd.
1. Executive Summary
1.1. Biocompatible 3D Printing Materials Market Snapshot
1.2. Current Market and Future Potential
2. Market Overview
2.1. Market Segmentation
2.2. Market Trends
2.3. Market Dynamics
2.3.1. Drivers
2.3.2. Restraints
2.3.3. Opportunities
2.4. Porter’s Five Forces Analysis
2.5. Regulatory Analysis
2.6. Value Chain Analysis
2.6.1. List of Biocompatible 3D Printing Materials Manufacturers
2.6.2. List of Potential Customer
3. COVID-19 Impact Analysis
4. Global Biocompatible 3D Printing Materials Market Analysis and Forecast, by Product, 2022–2031
4.1. Introduction and Definitions
4.2. Global Biocompatible 3D Printing Materials Market Volume (Tons) and Value (US$ Bn) Forecast, by Product, 2022–2031
4.2.1. Polymers
4.2.1.1. Polylactic Acid (PLA)
4.2.1.2. Acrylonitrile Butadiene Styrene (ABS)
4.2.1.3. Polypropulenes
4.2.1.4. Polyamides
4.2.1.5. Polycarbonates
4.2.1.6. Photopolymers
4.2.1.7. Others
4.2.2. Metal
4.2.2.1. Titanium
4.2.2.2. Stainless Steel
4.2.2.3. Others
4.2.3. Others (Ceramics and Composites)
4.3. Global Biocompatible 3D Printing Materials Market Attractiveness, by Product
5. Global Biocompatible 3D Printing Materials Market Analysis and Forecast, by Form, 2022–2031
5.1. Introduction and Definitions
5.2. Global Biocompatible 3D Printing Materials Market Volume (Tons) and Value (US$ Bn) Forecast, by Form, 2022–2031
5.2.1. Powder
5.2.2. Liquid
5.2.3. Others
5.3. Global Biocompatible 3D Printing Materials Market Attractiveness, by Form
6. Global Biocompatible 3D Printing Materials Market Analysis and Forecast, Application, 2022–2031
6.1. Introduction and Definitions
6.2. Global Biocompatible 3D Printing Materials Market Volume (Tons) and Value (US$ Bn) Forecast, by Application, 2022–2031
6.2.1. Implants & Prostheses
6.2.2. Prototyping & Surgical Guides
6.2.3. Tissue Engineering
6.2.4. Hearing Aids
6.2.5. Others
6.3. Global Biocompatible 3D Printing Materials Market Attractiveness, by Application
7. Global Biocompatible 3D Printing Materials Market Analysis and Forecast, by Region, 2022–2031
7.1. Key Findings
7.2. Global Biocompatible 3D Printing Materials Market Volume (Tons) and Value (US$ Bn) Forecast, by Region, 2022–2031
7.2.1. North America
7.2.2. Europe
7.2.3. Asia Pacific
7.2.4. Latin America
7.2.5. Middle East & Africa
7.3. Global Biocompatible 3D Printing Materials Market Attractiveness, by Region
8. North America Biocompatible 3D Printing Materials Market Analysis and Forecast, 2022–2031
8.1. Key Findings
8.2. North America Biocompatible 3D Printing Materials Market Volume (Tons) and Value (US$ Bn) Forecast, by Product, 2022–2031
8.3. North America Biocompatible 3D Printing Materials Market Volume (Tons) and Value (US$ Bn) Forecast, by Form, 2022–2031
8.4. North America Biocompatible 3D Printing Materials Market Volume (Tons) and Value (US$ Bn) Forecast, by Application, 2022–2031
8.5. North America Biocompatible 3D Printing Materials Market Volume (Tons) and Value (US$ Bn) Forecast, by Country, 2022–2031
8.5.1. U.S. Biocompatible 3D Printing Materials Market Volume (Tons) and Value (US$ Bn) Forecast, by Product, 2022–2031
8.5.2. U.S. Biocompatible 3D Printing Materials Market Volume (Tons) and Value (US$ Bn) Forecast, by Form, 2022–2031
8.5.3. U.S. Biocompatible 3D Printing Materials Market Volume (Tons) and Value (US$ Bn) Forecast, by Application, 2022–2031
8.5.4. Canada Biocompatible 3D Printing Materials Market Volume (Tons) and Value (US$ Bn) Forecast, by Product, 2022–2031
8.5.5. Canada Biocompatible 3D Printing Materials Market Volume (Tons) and Value (US$ Bn) Forecast, by Form, 2022–2031
8.5.6. Canada Biocompatible 3D Printing Materials Market Volume (Tons) and Value (US$ Bn) Forecast, by Application, 2022–2031
8.6. North America Biocompatible 3D Printing Materials Market Attractiveness Analysis
9. Europe Biocompatible 3D Printing Materials Market Analysis and Forecast, 2022–2031
9.1. Key Findings
9.2. Europe Biocompatible 3D Printing Materials Market Volume (Tons) and Value (US$ Bn) Forecast, by Product, 2022–2031
9.3. Europe Biocompatible 3D Printing Materials Market Volume (Tons) and Value (US$ Bn) Forecast, by Form, 2022–2031
9.4. Europe Biocompatible 3D Printing Materials Market Volume (Tons) and Value (US$ Bn) Forecast, by Application, 2022–2031
9.5. Europe Biocompatible 3D Printing Materials Market Volume (Tons) and Value (US$ Bn) Forecast, by Country and Sub-region, 2022-2031
9.5.1. Germany Biocompatible 3D Printing Materials Market Volume (Tons) and Value (US$ Bn) Forecast, by Product, 2022–2031
9.5.2. Germany Biocompatible 3D Printing Materials Market Volume (Tons) and Value (US$ Bn) Forecast, by Form, 2022–2031
9.5.3. Germany Biocompatible 3D Printing Materials Market Volume (Tons) and Value (US$ Bn) Forecast, by Application, 2022–2031
9.5.4. France Biocompatible 3D Printing Materials Market Volume (Tons) and Value (US$ Bn) Forecast, by Product, 2022–2031
9.5.5. France Biocompatible 3D Printing Materials Market Volume (Tons) and Value (US$ Bn) Forecast, by Form, 2022–2031
9.5.6. France Biocompatible 3D Printing Materials Market Volume (Tons) and Value (US$ Bn) Forecast, by Application, 2022–2031
9.5.7. U.K. Biocompatible 3D Printing Materials Market Volume (Tons) and Value (US$ Bn) Forecast, by Product, 2022–2031
9.5.8. U.K. Biocompatible 3D Printing Materials Market Volume (Tons) and Value (US$ Bn) Forecast, by Form, 2022–2031
9.5.9. U.K. Biocompatible 3D Printing Materials Market Volume (Tons) and Value (US$ Bn) Forecast, by Application, 2022–2031
9.5.10. Italy Biocompatible 3D Printing Materials Market Volume (Tons) and Value (US$ Bn) Forecast, by Product, 2022–2031
9.5.11. Italy. Biocompatible 3D Printing Materials Market Volume (Tons) and Value (US$ Bn) Forecast, by Form, 2022–2031
9.5.12. Italy Biocompatible 3D Printing Materials Market Volume (Tons) and Value (US$ Bn) Forecast, by Application, 2022–2031
9.5.13. Russia & CIS Biocompatible 3D Printing Materials Market Volume (Tons) and Value (US$ Bn) Forecast, by Product, 2022–2031
9.5.14. Russia & CIS Biocompatible 3D Printing Materials Market Volume (Tons) and Value (US$ Bn) Forecast, by Form, 2022–2031
9.5.15. Russia & CIS Biocompatible 3D Printing Materials Market Volume (Tons) and Value (US$ Bn) Forecast, by Application, 2022–2031
9.5.16. Rest of Europe Biocompatible 3D Printing Materials Market Volume (Tons) and Value (US$ Bn) Forecast, by Product, 2022–2031
9.5.17. Rest of Europe Biocompatible 3D Printing Materials Market Volume (Tons) and Value (US$ Bn) Forecast, by Form, 2022–2031
9.5.18. Rest of Europe Biocompatible 3D Printing Materials Market Volume (Tons) and Value (US$ Bn) Forecast, by Application, 2022–2031
9.6. Europe Biocompatible 3D Printing Materials Market Attractiveness Analysis
10. Asia Pacific Biocompatible 3D Printing Materials Market Analysis and Forecast, 2022–2031
10.1. Key Findings
10.2. Asia Pacific Biocompatible 3D Printing Materials Market Volume (Tons) and Value (US$ Bn) Forecast, by Product
10.3. Asia Pacific Biocompatible 3D Printing Materials Market Volume (Tons) and Value (US$ Bn) Forecast, by Form, 2022–2031
10.4. Asia Pacific Biocompatible 3D Printing Materials Market Volume (Tons) and Value (US$ Bn) Forecast, by Application, 2022–2031
10.5. Asia Pacific Biocompatible 3D Printing Materials Market Volume (Tons) and Value (US$ Bn) Forecast, by Country and Sub-region, 2022-2031
10.5.1. China Biocompatible 3D Printing Materials Market Volume (Tons) and Value (US$ Bn) Forecast, by Product, 2022–2031
10.5.2. China Biocompatible 3D Printing Materials Market Volume (Tons) and Value (US$ Bn) Forecast, by Form, 2022–2031
10.5.3. China Biocompatible 3D Printing Materials Market Volume (Tons) and Value (US$ Bn) Forecast, by Application, 2022–2031
10.5.4. Japan Biocompatible 3D Printing Materials Market Volume (Tons) and Value (US$ Bn) Forecast, by Product, 2022–2031
10.5.5. Japan Biocompatible 3D Printing Materials Market Volume (Tons) and Value (US$ Bn) Forecast, by Form, 2022–2031
10.5.6. Japan Biocompatible 3D Printing Materials Market Volume (Tons) and Value (US$ Bn) Forecast, by Application, 2022–2031
10.5.7. India Biocompatible 3D Printing Materials Market Volume (Tons) and Value (US$ Bn) Forecast, by Product, 2022–2031
10.5.8. India Biocompatible 3D Printing Materials Market Volume (Tons) and Value (US$ Bn) Forecast, by Form, 2022–2031
10.5.9. India Biocompatible 3D Printing Materials Market Volume (Tons) and Value (US$ Bn) Forecast, by Application, 2022–2031
10.5.10. ASEAN Biocompatible 3D Printing Materials Market Volume (Tons) and Value (US$ Bn) Forecast, by Product, 2022–2031
10.5.11. ASEAN Biocompatible 3D Printing Materials Market Volume (Tons) and Value (US$ Bn) Forecast, by Form, 2022–2031
10.5.12. ASEAN Biocompatible 3D Printing Materials Market Volume (Tons) and Value (US$ Bn) Forecast, by Application, 2022–2031
10.5.13. Rest of Asia Pacific Biocompatible 3D Printing Materials Market Volume (Tons) and Value (US$ Bn) Forecast, by Product, 2022–2031
10.5.14. Rest of Asia Pacific Biocompatible 3D Printing Materials Market Volume (Tons) and Value (US$ Bn) Forecast, by Form, 2022–2031
10.5.15. Rest of Asia Pacific Biocompatible 3D Printing Materials Market Volume (Tons) and Value (US$ Bn) Forecast, by Application, 2022–2031
10.6. Asia Pacific Biocompatible 3D Printing Materials Market Attractiveness Analysis
11. Latin America Biocompatible 3D Printing Materials Market Analysis and Forecast, 2022–2031
11.1. Key Findings
11.2. Latin America Biocompatible 3D Printing Materials Market Volume (Tons) and Value (US$ Bn) Forecast, by Product, 2022–2031
11.3. Latin America Biocompatible 3D Printing Materials Market Volume (Tons) and Value (US$ Bn) Forecast, by Form, 2022–2031
11.4. Latin America Biocompatible 3D Printing Materials Market Volume (Tons) and Value (US$ Bn) Forecast, by Application, 2022–2031
11.5. Latin America Biocompatible 3D Printing Materials Market Volume (Tons) and Value (US$ Bn) Forecast, by Country and Sub-region, 2022-2031
11.5.1. Brazil Biocompatible 3D Printing Materials Market Volume (Tons) and Value (US$ Bn) Forecast, by Product, 2022–2031
11.5.2. Brazil Biocompatible 3D Printing Materials Market Volume (Tons) and Value (US$ Bn) Forecast, by Form, 2022–2031
11.5.3. Brazil Biocompatible 3D Printing Materials Market Volume (Tons) and Value (US$ Bn) Forecast, by Application, 2022–2031
11.5.4. Mexico Biocompatible 3D Printing Materials Market Volume (Tons) and Value (US$ Bn) Forecast, by Product, 2022–2031
11.5.5. Mexico Biocompatible 3D Printing Materials Market Volume (Tons) and Value (US$ Bn) Forecast, by Form, 2022–2031
11.5.6. Mexico Biocompatible 3D Printing Materials Market Volume (Tons) and Value (US$ Bn) Forecast, by Application, 2022–2031
11.5.7. Rest of Latin America Biocompatible 3D Printing Materials Market Volume (Tons) and Value (US$ Bn) Forecast, by Product, 2022–2031
11.5.8. Rest of Latin America Biocompatible 3D Printing Materials Market Volume (Tons) and Value (US$ Bn) Forecast, by Form, 2022–2031
11.5.9. Rest of Latin America Biocompatible 3D Printing Materials Market Volume (Tons) and Value (US$ Bn) Forecast, by Application, 2022–2031
11.6. Latin America Biocompatible 3D Printing Materials Market Attractiveness Analysis
12. Middle East & Africa Biocompatible 3D Printing Materials Market Analysis and Forecast, 2022–2031
12.1. Key Findings
12.2. Middle East & Africa Biocompatible 3D Printing Materials Market Volume (Tons) and Value (US$ Bn) Forecast, by Product, 2022–2031
12.3. Middle East & Africa Biocompatible 3D Printing Materials Market Volume (Tons) and Value (US$ Bn) Forecast, by Form, 2022–2031
12.4. Middle East & Africa Biocompatible 3D Printing Materials Market Volume (Tons) and Value (US$ Bn) Forecast, by Application, 2022–2031
12.5. Middle East & Africa Biocompatible 3D Printing Materials Market Volume (Tons) and Value (US$ Bn) Forecast, by Country and Sub-region, 2022-2031
12.5.1. GCC Biocompatible 3D Printing Materials Market Volume (Tons) and Value (US$ Bn) Forecast, by Product, 2022–2031
12.5.2. GCC Biocompatible 3D Printing Materials Market Volume (Tons) and Value (US$ Bn) Forecast, by Form, 2022–2031
12.5.3. GCC Biocompatible 3D Printing Materials Market Volume (Tons) and Value (US$ Bn) Forecast, by Application, 2022–2031
12.5.4. South Africa Biocompatible 3D Printing Materials Market Volume (Tons) and Value (US$ Bn) Forecast, by Product, 2022–2031
12.5.5. South Africa Biocompatible 3D Printing Materials Market Volume (Tons) and Value (US$ Bn) Forecast, by Form, 2022–2031
12.5.6. South Africa Biocompatible 3D Printing Materials Market Volume (Tons) and Value (US$ Bn) Forecast, by Application, 2022–2031
12.5.7. Rest of Middle East & Africa Biocompatible 3D Printing Materials Market Volume (Tons) and Value (US$ Bn) Forecast, by Product, 2022–2031
12.5.8. Rest of Middle East & Africa Biocompatible 3D Printing Materials Market Volume (Tons) and Value (US$ Bn) Forecast, by Form, 2022–2031
12.5.9. Rest of Middle East & Africa Biocompatible 3D Printing Materials Market Volume (Tons) and Value (US$ Bn) Forecast, by Application, 2022–2031
12.6. Middle East & Africa Biocompatible 3D Printing Materials Market Attractiveness Analysis
13. Competition Landscape
13.1. Global Biocompatible 3D Printing Materials Company Market Share Analysis, 2022
13.2. Company Profiles (Details – Overview, Financials, Recent Developments, and Strategy)
13.2.1. 3D Systems, Inc.
13.2.1.1. Company Description
13.2.1.2. Business Overview
13.2.1.3. Financial Overview
13.2.1.4. Strategic Overview
13.2.2. Stratasys Ltd.
13.2.2.1. Company Description
13.2.2.2. Business Overview
13.2.2.3. Financial Overview
13.2.2.4. Strategic Overview
13.2.3. Evonik Industries AG
13.2.3.1. Company Description
13.2.3.2. Business Overview
13.2.3.3. Financial Overview
13.2.3.4. Strategic Overview
13.2.4. Polisan Kansai Boya
13.2.4.1. Company Description
13.2.4.2. Business Overview
13.2.4.3. Financial Overview
13.2.4.4. Strategic Overview
13.2.5. Renishaw plc
13.2.5.1. Company Description
13.2.5.2. Business Overview
13.2.5.3. Financial Overview
13.2.5.4. Strategic Overview
13.2.6. Formlabs Inc.
13.2.6.1. Company Description
13.2.6.2. Business Overview
13.2.6.3. Financial Overview
13.2.6.4. Strategic Overview
13.2.7. Sandvik AB
13.2.7.1. Company Description
13.2.7.2. Business Overview
13.2.7.3. Financial Overview
13.2.7.4. Strategic Overview
13.2.8. Elix Polymers SLU
13.2.8.1. Company Description
13.2.8.2. Business Overview
13.2.8.3. Financial Overview
13.2.8.4. Strategic Overview
13.2.9. Concept Laser GmbH
13.2.9.1. Company Description
13.2.9.2. Business Overview
13.2.9.3. Financial Overview
13.2.9.4. Strategic Overview
13.2.10. Apium Additive Technologies GmbH
13.2.10.1. Company Description
13.2.10.2. Business Overview
13.2.10.3. Financial Overview
13.2.10.4. Strategic Overview
13.2.11. EOS GmbH
13.2.11.1. Company Description
13.2.11.2. Business Overview
13.2.11.3. Financial Overview
13.2.11.4. Strategic Overview
13.2.12. Aspect Biosystems Ltd.
13.2.12.1. Company Description
13.2.12.2. Business Overview
13.2.12.3. Financial Overview
13.2.12.4. Strategic Overview
13.2.13. Cemetrix Solutions
13.2.13.1. Company Description
13.2.13.2. Business Overview
13.2.13.3. Financial Overview
13.2.13.4. Strategic Overview
13.2.14. Bioink Solution, Inc.
13.2.14.1. Company Description
13.2.14.2. Business Overview
13.2.14.3. Financial Overview
13.2.14.4. Strategic Overview
14. Primary Research: Key Insights
15. Appendix
List of Tables
Table 1: Global Biocompatible 3D Printing Materials Market Volume (Tons) Forecast, by Product, 2022–2031
Table 2: Global Biocompatible 3D Printing Materials Market Value (US$ Bn) Forecast, by Product, 2022–2031
Table 3: Global Biocompatible 3D Printing Materials Market Volume (Tons) Forecast, by Form, 2022–2031
Table 4: Global Biocompatible 3D Printing Materials Market Value (US$ Bn) Forecast, by Form, 2022–2031
Table 5: Global Biocompatible 3D Printing Materials Market Volume (Tons) Forecast, by Application, 2022–2031
Table 6: Global Biocompatible 3D Printing Materials Market Value (US$ Bn) Forecast, by Application, 2022–2031
Table 7: Global Biocompatible 3D Printing Materials Market Volume (Tons) Forecast, by Region, 2022–2031
Table 8: Global Biocompatible 3D Printing Materials Market Value (US$ Bn) Forecast, by Region, 2022–2031
Table 9: North America Biocompatible 3D Printing Materials Market Volume (Tons) Forecast, by Product, 2022–2031
Table 10: North America Biocompatible 3D Printing Materials Market Value (US$ Bn) Forecast, by Product, 2022–2031
Table 11: North America Biocompatible 3D Printing Materials Market Volume (Tons) Forecast, by Form, 2022–2031
Table 12: North America Biocompatible 3D Printing Materials Market Value (US$ Bn) Forecast, by Form, 2022–2031
Table 13: North America Biocompatible 3D Printing Materials Market Volume (Tons) Forecast, by Application, 2022–2031
Table 14: North America Biocompatible 3D Printing Materials Market Value (US$ Bn) Forecast, by Application, 2022–2031
Table 15: North America Biocompatible 3D Printing Materials Market Volume (Tons) Forecast, by Country, 2022–2031
Table 16: North America Biocompatible 3D Printing Materials Market Value (US$ Bn) Forecast, by Country, 2022–2031
Table 17: U.S. Biocompatible 3D Printing Materials Market Volume (Tons) Forecast, by Product, 2022–2031
Table 18: U.S. Biocompatible 3D Printing Materials Market Value (US$ Bn) Forecast, by Product, 2022–2031
Table 19: U.S. Biocompatible 3D Printing Materials Market Volume (Tons) Forecast, by Form, 2022–2031
Table 20: U.S. Biocompatible 3D Printing Materials Market Value (US$ Bn) Forecast, by Form, 2022–2031
Table 21: U.S. Biocompatible 3D Printing Materials Market Volume (Tons) Forecast, by Application, 2022–2031
Table 22: U.S. Biocompatible 3D Printing Materials Market Value (US$ Bn) Forecast, by Application, 2022–2031
Table 23: Canada Biocompatible 3D Printing Materials Market Volume (Tons) Forecast, by Product, 2022–2031
Table 24: Canada Biocompatible 3D Printing Materials Market Value (US$ Bn) Forecast, by Product, 2022–2031
Table 25: Canada Biocompatible 3D Printing Materials Market Volume (Tons) Forecast, by Form, 2022–2031
Table 26: Canada Biocompatible 3D Printing Materials Market Value (US$ Bn) Forecast, by Form, 2022–2031
Table 27: Canada Biocompatible 3D Printing Materials Market Volume (Tons) Forecast, by Application, 2022–2031
Table 28: Canada Biocompatible 3D Printing Materials Market Value (US$ Bn) Forecast, by Application, 2022–2031
Table 29: Europe Biocompatible 3D Printing Materials Market Volume (Tons) Forecast, by Product, 2022–2031
Table 30: Europe Biocompatible 3D Printing Materials Market Value (US$ Bn) Forecast, by Product, 2022–2031
Table 31: Europe Biocompatible 3D Printing Materials Market Volume (Tons) Forecast, by Form, 2022–2031
Table 32: Europe Biocompatible 3D Printing Materials Market Value (US$ Bn) Forecast, by Form, 2022–2031
Table 33: Europe Biocompatible 3D Printing Materials Market Volume (Tons) Forecast, by Application, 2022–2031
Table 34: Europe Biocompatible 3D Printing Materials Market Value (US$ Bn) Forecast, by Application, 2022–2031
Table 35: Europe Biocompatible 3D Printing Materials Market Volume (Tons) Forecast, by Country and Sub-region, 2022–2031
Table 36: Europe Biocompatible 3D Printing Materials Market Value (US$ Bn) Forecast, by Country and Sub-region, 2022–2031
Table 37: Germany Biocompatible 3D Printing Materials Market Volume (Tons) Forecast, by Product, 2022–2031
Table 38: Germany Biocompatible 3D Printing Materials Market Value (US$ Bn) Forecast, by Product, 2022–2031
Table 39: Germany Biocompatible 3D Printing Materials Market Volume (Tons) Forecast, by Form, 2022–2031
Table 40: Germany Biocompatible 3D Printing Materials Market Value (US$ Bn) Forecast, by Form, 2022–2031
Table 41: Germany Biocompatible 3D Printing Materials Market Volume (Tons) Forecast, by Application, 2022–2031
Table 42: Germany Biocompatible 3D Printing Materials Market Value (US$ Bn) Forecast, by Application, 2022–2031
Table 43: France Biocompatible 3D Printing Materials Market Volume (Tons) Forecast, by Product, 2022–2031
Table 44: France Biocompatible 3D Printing Materials Market Value (US$ Bn) Forecast, by Product, 2022–2031
Table 45: France Biocompatible 3D Printing Materials Market Volume (Tons) Forecast, by Form, 2022–2031
Table 46: France Biocompatible 3D Printing Materials Market Value (US$ Bn) Forecast, by Form, 2022–2031
Table 47: France Biocompatible 3D Printing Materials Market Volume (Tons) Forecast, by Application, 2022–2031
Table 48: France Biocompatible 3D Printing Materials Market Value (US$ Bn) Forecast, by Application, 2022–2031
Table 49: U.K. Biocompatible 3D Printing Materials Market Volume (Tons) Forecast, by Product, 2022–2031
Table 50: U.K. Biocompatible 3D Printing Materials Market Value (US$ Bn) Forecast, by Product, 2022–2031
Table 51: U.K. Biocompatible 3D Printing Materials Market Volume (Tons) Forecast, by Form, 2022–2031
Table 52: U.K. Biocompatible 3D Printing Materials Market Value (US$ Bn) Forecast, by Form, 2022–2031
Table 53: U.K. Biocompatible 3D Printing Materials Market Volume (Tons) Forecast, by Application, 2022–2031
Table 54: U.K. Biocompatible 3D Printing Materials Market Value (US$ Bn) Forecast, by Application, 2022–2031
Table 55: Italy Biocompatible 3D Printing Materials Market Volume (Tons) Forecast, by Product, 2022–2031
Table 56: Italy Biocompatible 3D Printing Materials Market Value (US$ Bn) Forecast, by Product, 2022–2031
Table 57: Italy Biocompatible 3D Printing Materials Market Volume (Tons) Forecast, by Form, 2022–2031
Table 58: Italy Biocompatible 3D Printing Materials Market Value (US$ Bn) Forecast, by Form, 2022–2031
Table 59: Italy Biocompatible 3D Printing Materials Market Volume (Tons) Forecast, by Application, 2022–2031
Table 60: Italy Biocompatible 3D Printing Materials Market Value (US$ Bn) Forecast, by Application, 2022–2031
Table 61: Spain Biocompatible 3D Printing Materials Market Volume (Tons) Forecast, by Product, 2022–2031
Table 62: Spain Biocompatible 3D Printing Materials Market Value (US$ Bn) Forecast, by Product, 2022–2031
Table 63: Spain Biocompatible 3D Printing Materials Market Volume (Tons) Forecast, by Form, 2022–2031
Table 64: Spain Biocompatible 3D Printing Materials Market Value (US$ Bn) Forecast, by Form, 2022–2031
Table 65: Spain Biocompatible 3D Printing Materials Market Volume (Tons) Forecast, by Application, 2022–2031
Table 66: Spain Biocompatible 3D Printing Materials Market Value (US$ Bn) Forecast, by Application, 2022–2031
Table 67: Russia & CIS Biocompatible 3D Printing Materials Market Volume (Tons) Forecast, by Product, 2022–2031
Table 68: Russia & CIS Biocompatible 3D Printing Materials Market Value (US$ Bn) Forecast, by Product, 2022–2031
Table 69: Russia & CIS Biocompatible 3D Printing Materials Market Volume (Tons) Forecast, by Form, 2022–2031
Table 70: Russia & CIS Biocompatible 3D Printing Materials Market Value (US$ Bn) Forecast, by Form, 2022–2031
Table 71: Russia & CIS Biocompatible 3D Printing Materials Market Volume (Tons) Forecast, by Application, 2022–2031
Table 72: Russia & CIS Biocompatible 3D Printing Materials Market Value (US$ Bn) Forecast, by Application, 2022–2031
Table 73: Rest of Europe Biocompatible 3D Printing Materials Market Volume (Tons) Forecast, by Product, 2022–2031
Table 74: Rest of Europe Biocompatible 3D Printing Materials Market Value (US$ Bn) Forecast, by Product, 2022–2031
Table 75: Rest of Europe Biocompatible 3D Printing Materials Market Volume (Tons) Forecast, by Form, 2022–2031
Table 76: Rest of Europe Biocompatible 3D Printing Materials Market Value (US$ Bn) Forecast, by Form, 2022–2031
Table 77: Rest of Europe Biocompatible 3D Printing Materials Market Volume (Tons) Forecast, by Application, 2022–2031
Table 78: Rest of Europe Biocompatible 3D Printing Materials Market Value (US$ Bn) Forecast, by Application, 2022–2031
Table 79: Asia Pacific Biocompatible 3D Printing Materials Market Volume (Tons) Forecast, by Product, 2022–2031
Table 80: Asia Pacific Biocompatible 3D Printing Materials Market Value (US$ Bn) Forecast, by Product, 2022–2031
Table 81: Asia Pacific Biocompatible 3D Printing Materials Market Volume (Tons) Forecast, by Form, 2022–2031
Table 82: Asia Pacific Biocompatible 3D Printing Materials Market Value (US$ Bn) Forecast, by Form, 2022–2031
Table 83: Asia Pacific Biocompatible 3D Printing Materials Market Volume (Tons) Forecast, by Application, 2022–2031
Table 84: Asia Pacific Biocompatible 3D Printing Materials Market Value (US$ Bn) Forecast, by Application, 2022–2031
Table 85: Asia Pacific Biocompatible 3D Printing Materials Market Volume (Tons) Forecast, by Country and Sub-region, 2022–2031
Table 86: Asia Pacific Biocompatible 3D Printing Materials Market Value (US$ Bn) Forecast, by Country and Sub-region, 2022–2031
Table 87: China Biocompatible 3D Printing Materials Market Volume (Tons) Forecast, by Product, 2022–2031
Table 88: China Biocompatible 3D Printing Materials Market Value (US$ Bn) Forecast, by Product 2022–2031
Table 89: China Biocompatible 3D Printing Materials Market Volume (Tons) Forecast, by Form, 2022–2031
Table 90: China Biocompatible 3D Printing Materials Market Value (US$ Bn) Forecast, by Form, 2022–2031
Table 91: China Biocompatible 3D Printing Materials Market Volume (Tons) Forecast, by Application, 2022–2031
Table 92: China Biocompatible 3D Printing Materials Market Value (US$ Bn) Forecast, by Application, 2022–2031
Table 93: Japan Biocompatible 3D Printing Materials Market Volume (Tons) Forecast, by Product, 2022–2031
Table 94: Japan Biocompatible 3D Printing Materials Market Value (US$ Bn) Forecast, by Product, 2022–2031
Table 95: Japan Biocompatible 3D Printing Materials Market Volume (Tons) Forecast, by Form, 2022–2031
Table 96: Japan Biocompatible 3D Printing Materials Market Value (US$ Bn) Forecast, by Form, 2022–2031
Table 97: Japan Biocompatible 3D Printing Materials Market Volume (Tons) Forecast, by Application, 2022–2031
Table 98: Japan Biocompatible 3D Printing Materials Market Value (US$ Bn) Forecast, by Application, 2022–2031
Table 99: India Biocompatible 3D Printing Materials Market Volume (Tons) Forecast, by Product, 2022–2031
Table 100: India Biocompatible 3D Printing Materials Market Value (US$ Bn) Forecast, by Product, 2022–2031
Table 101: India Biocompatible 3D Printing Materials Market Volume (Tons) Forecast, by Form, 2022–2031
Table 102: India Biocompatible 3D Printing Materials Market Value (US$ Bn) Forecast, by Form, 2022–2031
Table 103: India Biocompatible 3D Printing Materials Market Volume (Tons) Forecast, by Application, 2022–2031
Table 104: India Biocompatible 3D Printing Materials Market Value (US$ Bn) Forecast, by Application, 2022–2031
Table 105: India Biocompatible 3D Printing Materials Market Volume (Tons) Forecast, by Application, 2022–2031
Table 106: India Biocompatible 3D Printing Materials Market Value (US$ Bn) Forecast, by Application 2022–2031
Table 107: ASEAN Biocompatible 3D Printing Materials Market Volume (Tons) Forecast, by Product, 2022–2031
Table 108: ASEAN Biocompatible 3D Printing Materials Market Value (US$ Bn) Forecast, by Product, 2022–2031
Table 109: ASEAN Biocompatible 3D Printing Materials Market Volume (Tons) Forecast, by Form, 2022–2031
Table 110: ASEAN Biocompatible 3D Printing Materials Market Value (US$ Bn) Forecast, by Form, 2022–2031
Table 111: ASEAN Biocompatible 3D Printing Materials Market Volume (Tons) Forecast, by Application, 2022–2031
Table 112: ASEAN Biocompatible 3D Printing Materials Market Value (US$ Bn) Forecast, by Application, 2022–2031
Table 113: Rest of Asia Pacific Biocompatible 3D Printing Materials Market Volume (Tons) Forecast, by Product, 2022–2031
Table 114: Rest of Asia Pacific Biocompatible 3D Printing Materials Market Value (US$ Bn) Forecast, by Product, 2022–2031
Table 115: Rest of Asia Pacific Biocompatible 3D Printing Materials Market Volume (Tons) Forecast, by Form, 2022–2031
Table 116: Rest of Asia Pacific Biocompatible 3D Printing Materials Market Value (US$ Bn) Forecast, by Form, 2022–2031
Table 117: Rest of Asia Pacific Biocompatible 3D Printing Materials Market Volume (Tons) Forecast, by Application, 2022–2031
Table 118: Rest of Asia Pacific Biocompatible 3D Printing Materials Market Value (US$ Bn) Forecast, by Application, 2022–2031
Table 119: Latin America Biocompatible 3D Printing Materials Market Volume (Tons) Forecast, by Product, 2022–2031
Table 120: Latin America Biocompatible 3D Printing Materials Market Value (US$ Bn) Forecast, by Product, 2022–2031
Table 121: Latin America Biocompatible 3D Printing Materials Market Volume (Tons) Forecast, by Form, 2022–2031
Table 122: Latin America Biocompatible 3D Printing Materials Market Value (US$ Bn) Forecast, by Form, 2022–2031
Table 123: Latin America Biocompatible 3D Printing Materials Market Volume (Tons) Forecast, by Application, 2022–2031
Table 124: Latin America Biocompatible 3D Printing Materials Market Value (US$ Bn) Forecast, by Application, 2022–2031
Table 125: Latin America Biocompatible 3D Printing Materials Market Volume (Tons) Forecast, by Country and Sub-region, 2022–2031
Table 126: Latin America Biocompatible 3D Printing Materials Market Value (US$ Bn) Forecast, by Country and Sub-region, 2022–2031
Table 127: Brazil Biocompatible 3D Printing Materials Market Volume (Tons) Forecast, by Product, 2022–2031
Table 128: Brazil Biocompatible 3D Printing Materials Market Value (US$ Bn) Forecast, by Product, 2022–2031
Table 129: Brazil Biocompatible 3D Printing Materials Market Volume (Tons) Forecast, by Form, 2022–2031
Table 130: Brazil Biocompatible 3D Printing Materials Market Value (US$ Bn) Forecast, by Form, 2022–2031
Table 131: Brazil Biocompatible 3D Printing Materials Market Volume (Tons) Forecast, by Application, 2022–2031
Table 132: Brazil Biocompatible 3D Printing Materials Market Value (US$ Bn) Forecast, by Application, 2022–2031
Table 133: Mexico Biocompatible 3D Printing Materials Market Volume (Tons) Forecast, by Product, 2022–2031
Table 134: Mexico Biocompatible 3D Printing Materials Market Value (US$ Bn) Forecast, by Product, 2022–2031
Table 135: Mexico Biocompatible 3D Printing Materials Market Volume (Tons) Forecast, by Form, 2022–2031
Table 136: Mexico Biocompatible 3D Printing Materials Market Value (US$ Bn) Forecast, by Form, 2022–2031
Table 137: Mexico Biocompatible 3D Printing Materials Market Volume (Tons) Forecast, by Application, 2022–2031
Table 138: Mexico Biocompatible 3D Printing Materials Market Value (US$ Bn) Forecast, by Application, 2022–2031
Table 139: Rest of Latin America Biocompatible 3D Printing Materials Market Volume (Tons) Forecast, by Product, 2022–2031
Table 140: Rest of Latin America Biocompatible 3D Printing Materials Market Value (US$ Bn) Forecast, by Product, 2022–2031
Table 141: Rest of Latin America Biocompatible 3D Printing Materials Market Volume (Tons) Forecast, by Form, 2022–2031
Table 142: Rest of Latin America Biocompatible 3D Printing Materials Market Value (US$ Bn) Forecast, by Form, 2022–2031
Table 143: Rest of Latin America Biocompatible 3D Printing Materials Market Volume (Tons) Forecast, by Application, 2022–2031
Table 144: Rest of Latin America Biocompatible 3D Printing Materials Market Value (US$ Bn) Forecast, by Application, 2022–2031
Table 145: Middle East & Africa Biocompatible 3D Printing Materials Market Volume (Tons) Forecast, by Product, 2022–2031
Table 146: Middle East & Africa Biocompatible 3D Printing Materials Market Value (US$ Bn) Forecast, by Product, 2022–2031
Table 147: Middle East & Africa Biocompatible 3D Printing Materials Market Volume (Tons) Forecast, by Form, 2022–2031
Table 148: Middle East & Africa Biocompatible 3D Printing Materials Market Value (US$ Bn) Forecast, by Form, 2022–2031
Table 149: Middle East & Africa Biocompatible 3D Printing Materials Market Volume (Tons) Forecast, by Application, 2022–2031
Table 150: Middle East & Africa Biocompatible 3D Printing Materials Market Value (US$ Bn) Forecast, by Application, 2022–2031
Table 151: Middle East & Africa Biocompatible 3D Printing Materials Market Volume (Tons) Forecast, by Country and Sub-region, 2022–2031
Table 152: Middle East & Africa Biocompatible 3D Printing Materials Market Value (US$ Bn) Forecast, by Country and Sub-region, 2022–2031
Table 153: GCC Biocompatible 3D Printing Materials Market Volume (Tons) Forecast, by Product, 2022–2031
Table 154: GCC Biocompatible 3D Printing Materials Market Value (US$ Bn) Forecast, by Product, 2022–2031
Table 155: GCC Biocompatible 3D Printing Materials Market Volume (Tons) Forecast, by Form, 2022–2031
Table 156: GCC Biocompatible 3D Printing Materials Market Value (US$ Bn) Forecast, by Form, 2022–2031
Table 157: GCC Biocompatible 3D Printing Materials Market Volume (Tons) Forecast, by Application, 2022–2031
Table 158: GCC Biocompatible 3D Printing Materials Market Value (US$ Bn) Forecast, by Application, 2022–2031
Table 159: South Africa Biocompatible 3D Printing Materials Market Volume (Tons) Forecast, by Product, 2022–2031
Table 160: South Africa Biocompatible 3D Printing Materials Market Value (US$ Bn) Forecast, by Product, 2022–2031
Table 161: South Africa Biocompatible 3D Printing Materials Market Volume (Tons) Forecast, by Form, 2022–2031
Table 162: South Africa Biocompatible 3D Printing Materials Market Value (US$ Bn) Forecast, by Form, 2022–2031
Table 163: South Africa Biocompatible 3D Printing Materials Market Volume (Tons) Forecast, by Application, 2022–2031
Table 164: South Africa Biocompatible 3D Printing Materials Market Value (US$ Bn) Forecast, by Application, 2022–2031
Table 165: Rest of Middle East & Africa Biocompatible 3D Printing Materials Market Volume (Tons) Forecast, by Product, 2022–2031
Table 166: Rest of Middle East & Africa Biocompatible 3D Printing Materials Market Value (US$ Bn) Forecast, by Product, 2022–2031
Table 167: Rest of Middle East & Africa Biocompatible 3D Printing Materials Market Volume (Tons) Forecast, by Form, 2022–2031
Table 168: Rest of Middle East & Africa Biocompatible 3D Printing Materials Market Value (US$ Bn) Forecast, by Form, 2022–2031
Table 169: Rest of Middle East & Africa Biocompatible 3D Printing Materials Market Volume (Tons) Forecast, by Application, 2022–2031
Table 170: Rest of Middle East & Africa Biocompatible 3D Printing Materials Market Value (US$ Bn) Forecast, by Application, 2022–2031
List of Figures
Figure 1: Global Biocompatible 3D Printing Materials Market Volume Share Analysis, by Product, 2021, 2027, and 2031
Figure 2: Global Biocompatible 3D Printing Materials Market Attractiveness, by Product
Figure 3: Global Biocompatible 3D Printing Materials Market Volume Share Analysis, by Form, 2021, 2027, and 2031
Figure 4: Global Biocompatible 3D Printing Materials Market Attractiveness, by Form
Figure 5: Global Biocompatible 3D Printing Materials Market Volume Share Analysis, by Application, 2021, 2027, and 2031
Figure 6: Global Biocompatible 3D Printing Materials Market Attractiveness, by Application
Figure 7: Global Biocompatible 3D Printing Materials Market Volume Share Analysis, by Region, 2021, 2027, and 2031
Figure 8: Global Biocompatible 3D Printing Materials Market Attractiveness, by Region
Figure 9: North America Biocompatible 3D Printing Materials Market Volume Share Analysis, by Product, 2021, 2027, and 2031
Figure 10: North America Biocompatible 3D Printing Materials Market Attractiveness, by Product
Figure 11: North America Biocompatible 3D Printing Materials Market Attractiveness, by Product
Figure 12: North America Biocompatible 3D Printing Materials Market Volume Share Analysis, by Form, 2021, 2027, and 2031
Figure 13: North America Biocompatible 3D Printing Materials Market Attractiveness, by Form
Figure 14: North America Biocompatible 3D Printing Materials Market Volume Share Analysis, by Application, 2021, 2027, and 2031
Figure 15: North America Biocompatible 3D Printing Materials Market Attractiveness, by Application
Figure 16: North America Biocompatible 3D Printing Materials Market Attractiveness, by Country and Sub-region
Figure 17: Europe Biocompatible 3D Printing Materials Market Volume Share Analysis, by Product, 2021, 2027, and 2031
Figure 18: Europe Biocompatible 3D Printing Materials Market Attractiveness, by Product
Figure 19: Europe Biocompatible 3D Printing Materials Market Volume Share Analysis, by Form, 2021, 2027, and 2031
Figure 20: Europe Biocompatible 3D Printing Materials Market Attractiveness, by Form
Figure 21: Europe Biocompatible 3D Printing Materials Market Volume Share Analysis, by Application, 2021, 2027, and 2031
Figure 22: Europe Biocompatible 3D Printing Materials Market Attractiveness, by Application
Figure 23: Europe Biocompatible 3D Printing Materials Market Volume Share Analysis, by Country and Sub-region, 2021, 2027, and 2031
Figure 24: Europe Biocompatible 3D Printing Materials Market Attractiveness, by Country and Sub-region
Figure 25: Asia Pacific Biocompatible 3D Printing Materials Market Volume Share Analysis, by Product, 2021, 2027, and 2031
Figure 26: Asia Pacific Biocompatible 3D Printing Materials Market Attractiveness, by Product
Figure 27: Asia Pacific Biocompatible 3D Printing Materials Market Volume Share Analysis, by Form, 2021, 2027, and 2031
Figure 28: Asia Pacific Biocompatible 3D Printing Materials Market Attractiveness, by Form
Figure 29: Asia Pacific Biocompatible 3D Printing Materials Market Volume Share Analysis, by Application, 2021, 2027, and 2031
Figure 30: Asia Pacific Biocompatible 3D Printing Materials Market Attractiveness, by Application
Figure 31: Asia Pacific Biocompatible 3D Printing Materials Market Volume Share Analysis, by Country and Sub-region, 2021, 2027, and 2031
Figure 32: Asia Pacific Biocompatible 3D Printing Materials Market Attractiveness, by Country and Sub-region
Figure 33: Latin America Biocompatible 3D Printing Materials Market Volume Share Analysis, by Product, 2021, 2027, and 2031
Figure 34: Latin America Biocompatible 3D Printing Materials Market Attractiveness, by Product
Figure 35: Latin America Biocompatible 3D Printing Materials Market Volume Share Analysis, by Form, 2021, 2027, and 2031
Figure 36: Latin America Biocompatible 3D Printing Materials Market Attractiveness, by Form
Figure 37: Latin America Biocompatible 3D Printing Materials Market Volume Share Analysis, by Application, 2021, 2027, and 2031
Figure 38: Latin America Biocompatible 3D Printing Materials Market Attractiveness, by Application
Figure 39: Latin America Biocompatible 3D Printing Materials Market Volume Share Analysis, by Country and Sub-region, 2021, 2027, and 2031
Figure 40: Latin America Biocompatible 3D Printing Materials Market Attractiveness, by Country and Sub-region
Figure 41: Middle East & Africa Biocompatible 3D Printing Materials Market Volume Share Analysis, by Product, 2021, 2027, and 2031
Figure 42: Middle East & Africa Biocompatible 3D Printing Materials Market Attractiveness, by Product
Figure 43: Middle East & Africa Biocompatible 3D Printing Materials Market Volume Share Analysis, by Form, 2021, 2027, and 2031
Figure 44: Middle East & Africa Biocompatible 3D Printing Materials Market Attractiveness, by Form
Figure 45: Middle East & Africa Biocompatible 3D Printing Materials Market Volume Share Analysis, by Application, 2021, 2027, and 2031
Figure 46: Middle East & Africa Biocompatible 3D Printing Materials Market Attractiveness, by Application
Figure 47: Middle East & Africa Biocompatible 3D Printing Materials Market Volume Share Analysis, by Country and Sub-region, 2021, 2027, and 2031
Figure 48: Middle East & Africa Biocompatible 3D Printing Materials Market Attractiveness, by Country and Sub-region
Copyright © Transparency Market Research, Inc. All Rights reserved
Trust Online

Biocompatible 3D Printing Materials Market