
Reports
Reports
Global Bioactive Wound Management Market: Snapshot
The global market for bioactive wound management has been observing a significant surge in its size, thanks to tremendous rise in the geriatric population and the prevalence of diabetes that, consequently, has led to an increment in various wound-caused diseases. Apart from this, the augmenting preference for tissue replacement therapy, escalating awareness pertaining to healthcare among consumers, and the upswing in the demand for bioactive material are boosting the growth of this market substantially.
Various chronic diseases, such as diabetes, cardiovascular disorder, peripheral vascular disorder, and several other debilitating diseases have led to an alarming rise in the cases of chronic wounds, which, subsequently, has propelled the uptake of advanced wound care products, resulting in the growth of the global bioactive wound management market. However, the high cost associated with the deployment of bioactive wound management solutions may hamper this market from growing smoothly over the next few years.
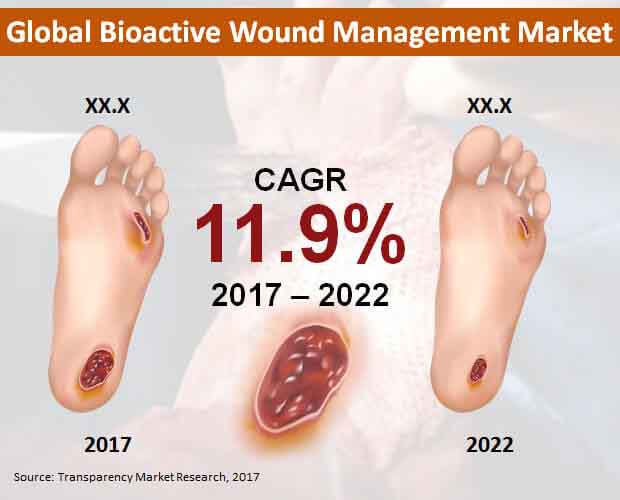
Nonetheless, the increasing adoption of technologically advanced and highly effective wound care products among medical professionals is likely to create the need for efficient management, which will reflect greatly on this market in the years to come. The market’s opportunity is anticipated to rise to US$1.1 bn by 2017 end. Proliferating at a CAGR of 11.90% between 2017 and 2022, it is likely to reach US$2.05 bn by the end of 2022.
Tropical Dressings to Report Higher Demand
The global market for bioactive wound management is primarily studied on the basis of the product, end user, and the application. On the basis of the product, the market is classified into collagen-based dressings, xenografts, bioengineered skin substitutes, allografts, and topical dressings. The demand for tropical dressings is comparatively higher than other products in this market, making the tropical dressing segment the dominant one. Rising at a CAGR of 8.50% between 2017 and 2022, this segment is likely to maintain its dominance over the next few years.
By application, the market is bifurcated into venous leg ulcers, pressure ulcers, diabetic foot ulcers, burn wounds, and surgical wounds. Since burns are the most common physical injuries across the world, the demand for bioactive wound management solutions is greater in burn wounds. Researchers expect this trend to remain so over the forthcoming years. Hospitals, clinics, ambulatory surgical centers (ASCs), and trauma centers have surfaced as the prime end users of bioactive wound management solutions, worldwide.
North America to Continue to Dominate
North America, Asia Pacific excluding Japan (APEJ), Europe, the Middle East and Africa (MEA), Latin America, and Japan have emerged as the main regional markets for bioactive wound management. Expanding at a CAGR of 12.80%, the North America market for bioactive wound management is expected to continue to dominate the global market during the period from 2017 to 2022. The presence of a highly advanced and sophisticated healthcare infrastructure is likely to boost this regional market in the near future.
Among other regional markets, APEJ is anticipated to report a promising growth over the coming years on account of the advancement in medical and healthcare infrastructure in various emerging Asian economies. The implementation of favorable reimbursement policies is also projected to reflect positively on this regional market in the years to come.
Acelity L.P. Inc., MiMedx Group Inc., Smith & Nephew Plc., Integra Lifesciences Holdings Corp., 3M Co., Wright Medical Group N.V., Covalon Technologies Ltd., ACell Inc., and Symatese are the main players operating in the global bioactive wound management market.
Bioactive Wound Management Market to See New Avenues to Meet Needs of Advanced Wound Care for Traumatic Injuries
Rise in prevalence of chronic diseases is a key trend in the bioactive wound management market. Over the past few years, a number of new techniques for advanced wound healing that target various aspects of wound healing has hit the market. In particular, bioengineered skin substitutes and tropical dressings has attracted wide attention among companies operating in the market. Chitosan, chitin and their derivatives, and collagen are some of the popular materials gaining traction for next-gen bioactive wound management. A growing body of studies and clinical trials have led to expanding understanding of the mechanisms of how these bioactive substances affect the various key mechanism of wound healing, such as in burn wound. The bioactive wound management market is making strides on the back of new multimodal bioactive material approaches for wound healing. Resultantly, a wide range of multifaceted bioactive dressing has opened new avenues in polymeric scaffold. Growing demand for new bioactive management is perhaps more evident in diabetics, such as in case of managing chronic foot ulcers. The high burden can be gauged from the fact that a large proportion of patients with untreated ulcers witness diabetic limb amputations. Thus, the growing research on treatment of diabetic foot ulcers with the help of bioactive substances is a key trend in the bioactive wound management market.
In recent years, novel approaches such as those based on small molecules will open new avenues in the bioactive wound management market. The macro- and micro-economic shocks led by Covid-19-led lockdowns have impacted the demand and supply of raw materials and final products in several of the manufacturing industries. This is a key trend that will considerably shape the future prospects in the bioactive wound management market. Further, new digital technologies used in medical and lifesciences industries will pave way to some of the exciting avenues for stakeholders in the market.
1. Global Bioactive Wound Management Market - Executive Summary
2. Global Bioactive Wound Management Market Overview
2.1. Introduction
2.1.1. Global Bioactive Wound Management Market Taxonomy
2.1.2. Global Bioactive Wound Management Market Definition
2.2. Global Bioactive Wound Management Market Size (US$ Mn) and Forecast, 2012-2022
2.2.1. Global Bioactive Wound Management Market Y-o-Y Growth
2.3. Global Bioactive Wound Management Market Dynamics
2.4. Supply Chain
2.5. Cost Structure
2.6. Pricing Analysis
2.7. Pipeline Assessment
2.8. Regulatory Scenario
2.9. Key Participants Market Presence (Intensity Map) By Region
3. Global Bioactive Wound Management Market Analysis and Forecast By Product
3.1. Global Bioactive Wound Management Market Size and Forecast By Product, 2012-2022
3.1.1. Xenografts Market Size and Forecast, 2012-2022
3.1.1.1. Revenue (US$ Mn) Comparison, By Region
3.1.1.2. Market Share Comparison, By Region
3.1.1.3. Y-o-Y growth Comparison, By Region
3.1.2. Allografts Market Size and Forecast, 2012-2022
3.1.2.1. Revenue (US$ Mn) Comparison, By Region
3.1.2.2. Market Share Comparison, By Region
3.1.2.3. Y-o-Y growth Comparison, By Region
3.1.3. Bioengineered Skin Substitutes Market Size and Forecast, 2012-2022
3.1.3.1. Revenue (US$ Mn) Comparison, By Region
3.1.3.2. Market Share Comparison, By Region
3.1.3.3. Y-o-Y growth Comparison, By Region
3.1.4. Collagen-based Dressings Market Size and Forecast, 2012-2022
3.1.4.1. Revenue (US$ Mn) Comparison, By Region
3.1.4.2. Market Share Comparison, By Region
3.1.4.3. Y-o-Y growth Comparison, By Region
3.1.5. Topical Dressings Market Size and Forecast, 2012-2022
3.1.5.1. Revenue (US$ Mn) Comparison, By Region
3.1.5.2. Market Share Comparison, By Region
3.1.5.3. Y-o-Y growth Comparison, By Region
4. Global Bioactive Wound Management Market Analysis and Forecast By End User
4.1. Global Bioactive Wound Management Market Size and Forecast By End User, 2012-2022
4.1.1. Hospitals Market Size and Forecast, 2012-2022
4.1.1.1. Revenue (US$ Mn) Comparison, By Region
4.1.1.2. Market Share Comparison, By Region
4.1.1.3. Y-o-Y growth Comparison, By Region
4.1.2. Clinics Market Size and Forecast, 2012-2022
4.1.2.1. Revenue (US$ Mn) Comparison, By Region
4.1.2.2. Market Share Comparison, By Region
4.1.2.3. Y-o-Y growth Comparison, By Region
4.1.3. Ambulatory Surgical Centers Market Size and Forecast, 2012-2022
4.1.3.1. Revenue (US$ Mn) Comparison, By Region
4.1.3.2. Market Share Comparison, By Region
4.1.3.3. Y-o-Y growth Comparison, By Region
4.1.4. Trauma Centers Market Size and Forecast, 2012-2022
4.1.4.1. Revenue (US$ Mn) Comparison, By Region
4.1.4.2. Market Share Comparison, By Region
4.1.4.3. Y-o-Y growth Comparison, By Region
5. Global Bioactive Wound Management Market Analysis and Forecast By Application
5.1. Global Bioactive Wound Management Market Size and Forecast By Application, 2012-2022
5.1.1. Venous Leg Ulcers Market Size and Forecast, 2012-2022
5.1.1.1. Revenue (US$ Mn) Comparison, By Region
5.1.1.2. Market Share Comparison, By Region
5.1.1.3. Y-o-Y growth Comparison, By Region
5.1.2. Diabetic Foot Ulcers Market Size and Forecast, 2012-2022
5.1.2.1. Revenue (US$ Mn) Comparison, By Region
5.1.2.2. Market Share Comparison, By Region
5.1.2.3. Y-o-Y growth Comparison, By Region
5.1.3. Pressure Ulcers Market Size and Forecast, 2012-2022
5.1.3.1. Revenue (US$ Mn) Comparison, By Region
5.1.3.2. Market Share Comparison, By Region
5.1.3.3. Y-o-Y growth Comparison, By Region
5.1.4. Surgical Wounds Market Size and Forecast, 2012-2022
5.1.4.1. Revenue (US$ Mn) Comparison, By Region
5.1.4.2. Market Share Comparison, By Region
5.1.4.3. Y-o-Y growth Comparison, By Region
5.1.5. Burn Wounds Market Size and Forecast, 2012-2022
5.1.5.1. Revenue (US$ Mn) Comparison, By Region
5.1.5.2. Market Share Comparison, By Region
5.1.5.3. Y-o-Y growth Comparison, By Region
6. Global Bioactive Wound Management Market Analysis and Forecast By Region
6.1. Global Bioactive Wound Management Market Size and Forecast, 2012-2022
6.1.1. North America Bioactive Wound Management Market Size and Forecast, 2012-2022
6.1.1.1. Revenue (US$ Mn) Comparison, By Product
6.1.1.2. Revenue (US$ Mn) Comparison, By End User
6.1.1.3. Revenue (US$ Mn) Comparison, By Application
6.1.2. Latin America Bioactive Wound Management Market Size and Forecast, 2012-2022
6.1.2.1. Revenue (US$ Mn) Comparison, By Product
6.1.2.2. Revenue (US$ Mn) Comparison, By End User
6.1.2.3. Revenue (US$ Mn) Comparison, By Application
6.1.3. Europe Bioactive Wound Management Market Size and Forecast, 2012-2022
6.1.3.1. Revenue (US$ Mn) Comparison, By Product
6.1.3.2. Revenue (US$ Mn) Comparison, By End User
6.1.3.3. Revenue (US$ Mn) Comparison, By Application
6.1.4. Japan Bioactive Wound Management Market Size and Forecast, 2012-2022
6.1.4.1. Revenue (US$ Mn) Comparison, By Product
6.1.4.2. Revenue (US$ Mn) Comparison, By End User
6.1.4.3. Revenue (US$ Mn) Comparison, By Application
6.1.5. APEJ Bioactive Wound Management Market Size and Forecast, 2012-2022
6.1.5.1. Revenue (US$ Mn) Comparison, By Product
6.1.5.2. Revenue (US$ Mn) Comparison, By End User
6.1.5.3. Revenue (US$ Mn) Comparison, By Application
6.1.6. MEA Bioactive Wound Management Market Size and Forecast, 2012-2022
6.1.6.1. Revenue (US$ Mn) Comparison, By Product
6.1.6.2. Revenue (US$ Mn) Comparison, By End User
6.1.6.3. Revenue (US$ Mn) Comparison, By Application
7. North America Bioactive Wound Management Market Analysis and Forecast, By Country, 2012-2022
7.1. US Bioactive Wound Management Market Size and Forecast, 2012-2022
7.1.1. Revenue (US$ Mn) Comparison, By Product
7.1.2. Revenue (US$ Mn) Comparison, By End User
7.1.3. Revenue (US$ Mn) Comparison, By Application
7.2. Canada Bioactive Wound Management Market Size and Forecast, 2012-2022
7.2.1. Revenue (US$ Mn) Comparison, By Product
7.2.2. Revenue (US$ Mn) Comparison, By End User
7.2.3. Revenue (US$ Mn) Comparison, By Application
8. Latin America Bioactive Wound Management Market Analysis and Forecast, By Country, 2012-2022
8.1. Brazil Bioactive Wound Management Market Size and Forecast, 2012-2022
8.1.1. Revenue (US$ Mn) Comparison, By Product
8.1.2. Revenue (US$ Mn) Comparison, By End User
8.1.3. Revenue (US$ Mn) Comparison, By Application
8.2. Mexico Bioactive Wound Management Market Size and Forecast, 2012-2022
8.2.1. Revenue (US$ Mn) Comparison, By Product
8.2.2. Revenue (US$ Mn) Comparison, By End User
8.2.3. Revenue (US$ Mn) Comparison, By Application
8.3. Argentina Bioactive Wound Management Market Size and Forecast, 2012-2022
8.3.1. Revenue (US$ Mn) Comparison, By Product
8.3.2. Revenue (US$ Mn) Comparison, By End User
8.3.3. Revenue (US$ Mn) Comparison, By Application
9. Europe Bioactive Wound Management Market Analysis and Forecast, By Country, 2012-2022
9.1. Germany Bioactive Wound Management Market Size and Forecast, 2012-2022
9.1.1. Revenue (US$ Mn) Comparison, By Product
9.1.2. Revenue (US$ Mn) Comparison, By End User
9.1.3. Revenue (US$ Mn) Comparison, By Application
9.2. UK Bioactive Wound Management Market Size and Forecast, 2012-2022
9.2.1. Revenue (US$ Mn) Comparison, By Product
9.2.2. Revenue (US$ Mn) Comparison, By End User
9.2.3. Revenue (US$ Mn) Comparison, By Application
9.3. France Bioactive Wound Management Market Size and Forecast, 2012-2022
9.3.1. Revenue (US$ Mn) Comparison, By Product
9.3.2. Revenue (US$ Mn) Comparison, By End User
9.3.3. Revenue (US$ Mn) Comparison, By Application
9.4. Spain Bioactive Wound Management Market Size and Forecast, 2012-2022
9.4.1. Revenue (US$ Mn) Comparison, By Product
9.4.2. Revenue (US$ Mn) Comparison, By End User
9.4.3. Revenue (US$ Mn) Comparison, By Application
9.5. Italy Bioactive Wound Management Market Size and Forecast, 2012-2022
9.5.1. Revenue (US$ Mn) Comparison, By Product
9.5.2. Revenue (US$ Mn) Comparison, By End User
9.5.3. Revenue (US$ Mn) Comparison, By Application
9.6. Nordic Bioactive Wound Management Market Size and Forecast, 2012-2022
9.6.1. Revenue (US$ Mn) Comparison, By Product
9.6.2. Revenue (US$ Mn) Comparison, By End User
9.6.3. Revenue (US$ Mn) Comparison, By Application
10. Japan Bioactive Wound Management Market Analysis and Forecast, By Country, 2012-2022
10.1. Japan Bioactive Wound Management Market Size and Forecast, 2012-2022
10.1.1. Revenue (US$ Mn) Comparison, By Product
10.1.2. Revenue (US$ Mn) Comparison, By End User
10.1.3. Revenue (US$ Mn) Comparison, By Application
11. APEJ Bioactive Wound Management Market Analysis and Forecast, By Country, 2012-2022
11.1. China Bioactive Wound Management Market Size and Forecast, 2012-2022
11.1.1. Revenue (US$ Mn) Comparison, By Product
11.1.2. Revenue (US$ Mn) Comparison, By End User
11.1.3. Revenue (US$ Mn) Comparison, By Application
11.2. India Bioactive Wound Management Market Size and Forecast, 2012-2022
11.2.1. Revenue (US$ Mn) Comparison, By Product
11.2.2. Revenue (US$ Mn) Comparison, By End User
11.2.3. Revenue (US$ Mn) Comparison, By Application
11.3. Malaysia Bioactive Wound Management Market Size and Forecast, 2012-2022
11.3.1. Revenue (US$ Mn) Comparison, By Product
11.3.2. Revenue (US$ Mn) Comparison, By End User
11.3.3. Revenue (US$ Mn) Comparison, By Application
11.4. Thailand Bioactive Wound Management Market Size and Forecast, 2012-2022
11.4.1. Revenue (US$ Mn) Comparison, By Product
11.4.2. Revenue (US$ Mn) Comparison, By End User
11.4.3. Revenue (US$ Mn) Comparison, By Application
11.5. Singapore Bioactive Wound Management Market Size and Forecast, 2012-2022
11.5.1. Revenue (US$ Mn) Comparison, By Product
11.5.2. Revenue (US$ Mn) Comparison, By End User
11.5.3. Revenue (US$ Mn) Comparison, By Application
11.6. Australia Bioactive Wound Management Market Size and Forecast, 2012-2022
11.6.1. Revenue (US$ Mn) Comparison, By Product
11.6.2. Revenue (US$ Mn) Comparison, By End User
11.6.3. Revenue (US$ Mn) Comparison, By Application
12. MEA Bioactive Wound Management Market Analysis and Forecast, By Country, 2012-2022
12.1. GCC Countries Bioactive Wound Management Market Size and Forecast, 2012-2022
12.1.1. Revenue (US$ Mn) Comparison, By Product
12.1.2. Revenue (US$ Mn) Comparison, By End User
12.1.3. Revenue (US$ Mn) Comparison, By Application
12.2. South Africa Bioactive Wound Management Market Size and Forecast, 2012-2022
12.2.1. Revenue (US$ Mn) Comparison, By Product
12.2.2. Revenue (US$ Mn) Comparison, By End User
12.2.3. Revenue (US$ Mn) Comparison, By Application
12.3. Nigeria Bioactive Wound Management Market Size and Forecast, 2012-2022
12.3.1. Revenue (US$ Mn) Comparison, By Product
12.3.2. Revenue (US$ Mn) Comparison, By End User
12.3.3. Revenue (US$ Mn) Comparison, By Application
12.4. Israel Bioactive Wound Management Market Size and Forecast, 2012-2022
12.4.1. Revenue (US$ Mn) Comparison, By Product
12.4.2. Revenue (US$ Mn) Comparison, By End User
12.4.3. Revenue (US$ Mn) Comparison, By Application
13. Global Bioactive Wound Management Market Company Share, Competition Landscape and Company Profiles
13.1. Company Share Analysis
13.2. Competition Landscape
13.3. Company Profiles
13.3.1. Smith & Nephew Plc.
13.3.2. Convatec Group Plc.
13.3.3. Symatese
13.3.4. Integra Lifesciences Holdings Corporation
13.3.5. MiMedx Group, Inc.
13.3.6. ACell, Inc.
13.3.7.Wright Medical Group N.V.
13.3.8.Acelity L.P. Inc.
13.3.9. 3M Company
13.3.10.Covalon Technologies Ltd.
14. Research Methodology
15. Secondary and Primary Sources
16. Assumptions and Acronyms
17. Disclaimer
List of Tables
TABLE 1 Global Bioactive Wound Management Market Value (US$ Mn), 2012-2016
TABLE 2 Global Bioactive Wound Management Market Value (US$ Mn), 2017-2022
TABLE 3 Global Bioactive Wound Management Market Value (US$ Mn) and Y-o-Y, 2015-2022
TABLE 4 Global Xenografts Segment Value (US$ Mn), By Region 2012-2016
TABLE 5 Global Xenografts Segment Value (US$ Mn), By Region 2017-2022
TABLE 6 Global Xenografts Segment Market Share, By Region 2012-2016
TABLE 7 Global Xenografts Segment Market Share, By Region 2017-2022
TABLE 8 Global Xenografts Segment Y-o-Y, By Region 2015-2022
TABLE 9 Global Allografts Segment Value (US$ Mn), By Region 2012-2016
TABLE 10 Global Allografts Segment Value (US$ Mn), By Region 2017-2022
TABLE 11 Global Allografts Segment Market Share, By Region 2012-2016
TABLE 12 Global Allografts Segment Market Share, By Region 2017-2022
TABLE 13 Global Allografts Segment Y-o-Y, By Region 2015-2022
TABLE 14 Global Bioengineered Skin Substitutes Segment Value (US$ Mn), By Region 2012-2016
TABLE 15 Global Bioengineered Skin Substitutes Segment Value (US$ Mn), By Region 2017-2022
TABLE 16 Global Bioengineered Skin Substitutes Segment Market Share, By Region 2012-2016
TABLE 17 Global Bioengineered Skin Substitutes Segment Market Share, By Region 2017-2022
TABLE 18 Global Bioengineered Skin Substitutes Segment Y-o-Y, By Region 2015-2022
TABLE 19 Global Collagen-based Dressings Segment Value (US$ Mn), By Region 2012-2016
TABLE 20 Global Collagen-based Dressings Segment Value (US$ Mn), By Region 2017-2022
TABLE 21 Global Collagen-based Dressings Segment Market Share, By Region 2012-2016
TABLE 22 Global Collagen-based Dressings Segment Market Share, By Region 2017-2022
TABLE 23 Global Collagen-based Dressings Segment Y-o-Y, By Region 2015-2022
TABLE 24 Global Topical Dressings Segment Value (US$ Mn), By Region 2012-2016
TABLE 25 Global Topical Dressings Segment Value (US$ Mn), By Region 2017-2022
TABLE 26 Global Topical Dressings Segment Market Share, By Region 2012-2016
TABLE 27 Global Topical Dressings Segment Market Share, By Region 2017-2022
TABLE 28 Global Topical Dressings Segment Y-o-Y, By Region 2015-2022
TABLE 29 Global Hospitals Segment Value (US$ Mn), By Region 2012-2016
TABLE 30 Global Hospitals Segment Value (US$ Mn), By Region 2017-2022
TABLE 31 Global Hospitals Segment Market Share, By Region 2012-2016
TABLE 32 Global Hospitals Segment Market Share, By Region 2017-2022
TABLE 33 Global Hospitals Segment Y-o-Y, By Region 2015-2022
TABLE 34 Global Clinics Segment Value (US$ Mn), By Region 2012-2016
TABLE 35 Global Clinics Segment Value (US$ Mn), By Region 2017-2022
TABLE 36 Global Clinics Segment Market Share, By Region 2012-2016
TABLE 37 Global Clinics Segment Market Share, By Region 2017-2022
TABLE 38 Global Clinics Segment Y-o-Y, By Region 2015-2022
TABLE 39 Global Ambulatory Surgical Centers Segment Value (US$ Mn), By Region 2012-2016
TABLE 40 Global Ambulatory Surgical Centers Segment Value (US$ Mn), By Region 2017-2022
TABLE 41 Global Ambulatory Surgical Centers Segment Market Share, By Region 2012-2016
TABLE 42 Global Ambulatory Surgical Centers Segment Market Share, By Region 2017-2022
TABLE 43 Global Ambulatory Surgical Centers Segment Y-o-Y, By Region 2015-2022
TABLE 44 Global Trauma Centers Segment Value (US$ Mn), By Region 2012-2016
TABLE 45 Global Trauma Centers Segment Value (US$ Mn), By Region 2017-2022
TABLE 46 Global Trauma Centers Segment Market Share, By Region 2012-2016
TABLE 47 Global Trauma Centers Segment Market Share, By Region 2017-2022
TABLE 48 Global Trauma Centers Segment Y-o-Y, By Region 2015-2022
TABLE 49 Global Venous Leg Ulcers Segment Value (US$ Mn), By Region 2012-2016
TABLE 50 Global Venous Leg Ulcers Segment Value (US$ Mn), By Region 2017-2022
TABLE 51 Global Venous Leg Ulcers Segment Market Share, By Region 2012-2016
TABLE 52 Global Venous Leg Ulcers Segment Market Share, By Region 2017-2022
TABLE 53 Global Venous Leg Ulcers Segment Y-o-Y, By Region 2015-2022
TABLE 54 Global Diabetic Foot Ulcers Segment Value (US$ Mn), By Region 2012-2016
TABLE 55 Global Diabetic Foot Ulcers Segment Value (US$ Mn), By Region 2017-2022
TABLE 56 Global Diabetic Foot Ulcers Segment Market Share, By Region 2012-2016
TABLE 57 Global Diabetic Foot Ulcers Segment Market Share, By Region 2017-2022
TABLE 58 Global Diabetic Foot Ulcers Segment Y-o-Y, By Region 2015-2022
TABLE 59 Global Pressure Ulcers Segment Value (US$ Mn), By Region 2012-2016
TABLE 60 Global Pressure Ulcers Segment Value (US$ Mn), By Region 2017-2022
TABLE 61 Global Pressure Ulcers Segment Market Share, By Region 2012-2016
TABLE 62 Global Pressure Ulcers Segment Market Share, By Region 2017-2022
TABLE 63 Global Pressure Ulcers Segment Y-o-Y, By Region 2015-2022
TABLE 64 Global Surgical Wounds Segment Value (US$ Mn), By Region 2012-2016
TABLE 65 Global Surgical Wounds Segment Value (US$ Mn), By Region 2017-2022
TABLE 66 Global Surgical Wounds Segment Market Share, By Region 2012-2016
TABLE 67 Global Surgical Wounds Segment Market Share, By Region 2017-2022
TABLE 68 Global Surgical Wounds Segment Y-o-Y, By Region 2015-2022
TABLE 69 Global Burn Wounds Segment Value (US$ Mn), By Region 2012-2016
TABLE 70 Global Burn Wounds Segment Value (US$ Mn), By Region 2017-2022
TABLE 71 Global Burn Wounds Segment Market Share, By Region 2012-2016
TABLE 72 Global Burn Wounds Segment Market Share, By Region 2017-2022
TABLE 73 Global Burn Wounds Segment Y-o-Y, By Region 2015-2022
TABLE 74 North America Bioactive Wound Management Market Value (US$ Mn), By Product 2012-2016
TABLE 75 North America Bioactive Wound Management Market Value (US$ Mn), By Product 2017-2022
TABLE 76 North America Bioactive Wound Management Market Value (US$ Mn), By End User 2012-2016
TABLE 77 North America Bioactive Wound Management Market Value (US$ Mn), By End User 2017-2022
TABLE 78 North America Bioactive Wound Management Market Value (US$ Mn), By Application 2012-2016
TABLE 79 North America Bioactive Wound Management Market Value (US$ Mn), By Application 2017-2022
TABLE 80 Latin America Bioactive Wound Management Market Value (US$ Mn), By Product 2012-2016
TABLE 81 Latin America Bioactive Wound Management Market Value (US$ Mn), By Product 2017-2022
TABLE 82 Latin America Bioactive Wound Management Market Value (US$ Mn), By End User 2012-2016
TABLE 83 Latin America Bioactive Wound Management Market Value (US$ Mn), By End User 2017-2022
TABLE 84 Latin America Bioactive Wound Management Market Value (US$ Mn), By Application 2012-2016
TABLE 85 Latin America Bioactive Wound Management Market Value (US$ Mn), By Application 2017-2022
TABLE 86 Europe Bioactive Wound Management Market Value (US$ Mn), By Product 2012-2016
TABLE 87 Europe Bioactive Wound Management Market Value (US$ Mn), By Product 2017-2022
TABLE 88 Europe Bioactive Wound Management Market Value (US$ Mn), By End User 2012-2016
TABLE 89 Europe Bioactive Wound Management Market Value (US$ Mn), By End User 2017-2022
TABLE 90 Europe Bioactive Wound Management Market Value (US$ Mn), By Application 2012-2016
TABLE 91 Europe Bioactive Wound Management Market Value (US$ Mn), By Application 2017-2022
TABLE 92 Japan Bioactive Wound Management Market Value (US$ Mn), By Product 2012-2016
TABLE 93 Japan Bioactive Wound Management Market Value (US$ Mn), By Product 2017-2022
TABLE 94 Japan Bioactive Wound Management Market Value (US$ Mn), By End User 2012-2016
TABLE 95 Japan Bioactive Wound Management Market Value (US$ Mn), By End User 2017-2022
TABLE 96 Japan Bioactive Wound Management Market Value (US$ Mn), By Application 2012-2016
TABLE 97 Japan Bioactive Wound Management Market Value (US$ Mn), By Application 2017-2022
TABLE 98 APEJ Bioactive Wound Management Market Value (US$ Mn), By Product 2012-2016
TABLE 99 APEJ Bioactive Wound Management Market Value (US$ Mn), By Product 2017-2022
TABLE 100 APEJ Bioactive Wound Management Market Value (US$ Mn), By End User 2012-2016
TABLE 101 APEJ Bioactive Wound Management Market Value (US$ Mn), By End User 2017-2022
TABLE 102 APEJ Bioactive Wound Management Market Value (US$ Mn), By Application 2012-2016
TABLE 103 APEJ Bioactive Wound Management Market Value (US$ Mn), By Application 2017-2022
TABLE 104 MEA Bioactive Wound Management Market Value (US$ Mn), By Product 2012-2016
TABLE 105 MEA Bioactive Wound Management Market Value (US$ Mn), By Product 2017-2022
TABLE 106 MEA Bioactive Wound Management Market Value (US$ Mn), By End User 2012-2016
TABLE 107 MEA Bioactive Wound Management Market Value (US$ Mn), By End User 2017-2022
TABLE 108 MEA Bioactive Wound Management Market Value (US$ Mn), By Application 2012-2016
TABLE 109 MEA Bioactive Wound Management Market Value (US$ Mn), By Application 2017-2022
TABLE 110 US Bioactive Wound Management Market Value (US$ Mn), By Product 2012-2016
TABLE 111 US Bioactive Wound Management Market Value (US$ Mn), By Product 2017-2022
TABLE 112 US Bioactive Wound Management Market Value (US$ Mn), By End User 2012-2016
TABLE 113 US Bioactive Wound Management Market Value (US$ Mn), By End User 2017-2022
TABLE 114 US Bioactive Wound Management Market Value (US$ Mn), By Application 2012-2016
TABLE 115 US Bioactive Wound Management Market Value (US$ Mn), By Application 2017-2022
TABLE 116 Canada Bioactive Wound Management Market Value (US$ Mn), By Product 2012-2016
TABLE 117 Canada Bioactive Wound Management Market Value (US$ Mn), By Product 2017-2022
TABLE 118 Canada Bioactive Wound Management Market Value (US$ Mn), By End User 2012-2016
TABLE 119 Canada Bioactive Wound Management Market Value (US$ Mn), By End User 2017-2022
TABLE 120 Canada Bioactive Wound Management Market Value (US$ Mn), By Application 2012-2016
TABLE 121 Canada Bioactive Wound Management Market Value (US$ Mn), By Application 2017-2022
TABLE 122 Brazil Bioactive Wound Management Market Value (US$ Mn), By Product 2012-2016
TABLE 123 Brazil Bioactive Wound Management Market Value (US$ Mn), By Product 2017-2022
TABLE 124 Brazil Bioactive Wound Management Market Value (US$ Mn), By End User 2012-2016
TABLE 125 Brazil Bioactive Wound Management Market Value (US$ Mn), By End User 2017-2022
TABLE 126 Brazil Bioactive Wound Management Market Value (US$ Mn), By Application 2012-2016
TABLE 127 Brazil Bioactive Wound Management Market Value (US$ Mn), By Application 2017-2022
TABLE 128 Mexico Bioactive Wound Management Market Value (US$ Mn), By Product 2012-2016
TABLE 129 Mexico Bioactive Wound Management Market Value (US$ Mn), By Product 2017-2022
TABLE 130 Mexico Bioactive Wound Management Market Value (US$ Mn), By End User 2012-2016
TABLE 131 Mexico Bioactive Wound Management Market Value (US$ Mn), By End User 2017-2022
TABLE 132 Mexico Bioactive Wound Management Market Value (US$ Mn), By Application 2012-2016
TABLE 133 Mexico Bioactive Wound Management Market Value (US$ Mn), By Application 2017-2022
TABLE 134 Argentina Bioactive Wound Management Market Value (US$ Mn), By Product 2012-2016
TABLE 135 Argentina Bioactive Wound Management Market Value (US$ Mn), By Product 2017-2022
TABLE 136 Argentina Bioactive Wound Management Market Value (US$ Mn), By End User 2012-2016
TABLE 137 Argentina Bioactive Wound Management Market Value (US$ Mn), By End User 2017-2022
TABLE 138 Argentina Bioactive Wound Management Market Value (US$ Mn), By Application 2012-2016
TABLE 139 Argentina Bioactive Wound Management Market Value (US$ Mn), By Application 2017-2022
TABLE 140 Germany Bioactive Wound Management Market Value (US$ Mn), By Product 2012-2016
TABLE 141 Germany Bioactive Wound Management Market Value (US$ Mn), By Product 2017-2022
TABLE 142 Germany Bioactive Wound Management Market Value (US$ Mn), By End User 2012-2016
TABLE 143 Germany Bioactive Wound Management Market Value (US$ Mn), By End User 2017-2022
TABLE 144 Germany Bioactive Wound Management Market Value (US$ Mn), By Application 2012-2016
TABLE 145 Germany Bioactive Wound Management Market Value (US$ Mn), By Application 2017-2022
TABLE 146 UK Bioactive Wound Management Market Value (US$ Mn), By Product 2012-2016
TABLE 147 UK Bioactive Wound Management Market Value (US$ Mn), By Product 2017-2022
TABLE 148 UK Bioactive Wound Management Market Value (US$ Mn), By End User 2012-2016
TABLE 149 UK Bioactive Wound Management Market Value (US$ Mn), By End User 2017-2022
TABLE 150 UK Bioactive Wound Management Market Value (US$ Mn), By Application 2012-2016
TABLE 151 UK Bioactive Wound Management Market Value (US$ Mn), By Application 2017-2022
TABLE 152 France Bioactive Wound Management Market Value (US$ Mn), By Product 2012-2016
TABLE 153 France Bioactive Wound Management Market Value (US$ Mn), By Product 2017-2022
TABLE 154 France Bioactive Wound Management Market Value (US$ Mn), By End User 2012-2016
TABLE 155 France Bioactive Wound Management Market Value (US$ Mn), By End User 2017-2022
TABLE 156 France Bioactive Wound Management Market Value (US$ Mn), By Application 2012-2016
TABLE 157 France Bioactive Wound Management Market Value (US$ Mn), By Application 2017-2022
TABLE 158 Spain Bioactive Wound Management Market Value (US$ Mn), By Product 2012-2016
TABLE 159 Spain Bioactive Wound Management Market Value (US$ Mn), By Product 2017-2022
TABLE 160 Spain Bioactive Wound Management Market Value (US$ Mn), By End User 2012-2016
TABLE 161 Spain Bioactive Wound Management Market Value (US$ Mn), By End User 2017-2022
TABLE 162 Spain Bioactive Wound Management Market Value (US$ Mn), By Application 2012-2016
TABLE 163 Spain Bioactive Wound Management Market Value (US$ Mn), By Application 2017-2022
TABLE 164 Italy Bioactive Wound Management Market Value (US$ Mn), By Product 2012-2016
TABLE 165 Italy Bioactive Wound Management Market Value (US$ Mn), By Product 2017-2022
TABLE 166 Italy Bioactive Wound Management Market Value (US$ Mn), By End User 2012-2016
TABLE 167 Italy Bioactive Wound Management Market Value (US$ Mn), By End User 2017-2022
TABLE 168 Italy Bioactive Wound Management Market Value (US$ Mn), By Application 2012-2016
TABLE 169 Italy Bioactive Wound Management Market Value (US$ Mn), By Application 2017-2022
TABLE 170 Nordic Bioactive Wound Management Market Value (US$ Mn), By Product 2012-2016
TABLE 171 Nordic Bioactive Wound Management Market Value (US$ Mn), By Product 2017-2022
TABLE 172 Nordic Bioactive Wound Management Market Value (US$ Mn), By End User 2012-2016
TABLE 173 Nordic Bioactive Wound Management Market Value (US$ Mn), By End User 2017-2022
TABLE 174 Nordic Bioactive Wound Management Market Value (US$ Mn), By Application 2012-2016
TABLE 175 Nordic Bioactive Wound Management Market Value (US$ Mn), By Application 2017-2022
TABLE 176 Japan Bioactive Wound Management Market Value (US$ Mn), By Product 2012-2016
TABLE 177 Japan Bioactive Wound Management Market Value (US$ Mn), By Product 2017-2022
TABLE 178 Japan Bioactive Wound Management Market Value (US$ Mn), By End User 2012-2016
TABLE 179 Japan Bioactive Wound Management Market Value (US$ Mn), By End User 2017-2022
TABLE 180 Japan Bioactive Wound Management Market Value (US$ Mn), By Application 2012-2016
TABLE 181 Japan Bioactive Wound Management Market Value (US$ Mn), By Application 2017-2022
TABLE 182 China Bioactive Wound Management Market Value (US$ Mn), By Product 2012-2016
TABLE 183 China Bioactive Wound Management Market Value (US$ Mn), By Product 2017-2022
TABLE 184 China Bioactive Wound Management Market Value (US$ Mn), By End User 2012-2016
TABLE 185 China Bioactive Wound Management Market Value (US$ Mn), By End User 2017-2022
TABLE 186 China Bioactive Wound Management Market Value (US$ Mn), By Application 2012-2016
TABLE 187 China Bioactive Wound Management Market Value (US$ Mn), By Application 2017-2022
TABLE 188 India Bioactive Wound Management Market Value (US$ Mn), By Product 2012-2016
TABLE 189 India Bioactive Wound Management Market Value (US$ Mn), By Product 2017-2022
TABLE 190 India Bioactive Wound Management Market Value (US$ Mn), By End User 2012-2016
TABLE 191 India Bioactive Wound Management Market Value (US$ Mn), By End User 2017-2022
TABLE 192 India Bioactive Wound Management Market Value (US$ Mn), By Application 2012-2016
TABLE 193 India Bioactive Wound Management Market Value (US$ Mn), By Application 2017-2022
TABLE 194 Malaysia Bioactive Wound Management Market Value (US$ Mn), By Product 2012-2016
TABLE 195 Malaysia Bioactive Wound Management Market Value (US$ Mn), By Product 2017-2022
TABLE 196 Malaysia Bioactive Wound Management Market Value (US$ Mn), By End User 2012-2016
TABLE 197 Malaysia Bioactive Wound Management Market Value (US$ Mn), By End User 2017-2022
TABLE 198 Malaysia Bioactive Wound Management Market Value (US$ Mn), By Application 2012-2016
TABLE 199 Malaysia Bioactive Wound Management Market Value (US$ Mn), By Application 2017-2022
TABLE 200 Thailand Bioactive Wound Management Market Value (US$ Mn), By Product 2012-2016
TABLE 201 Thailand Bioactive Wound Management Market Value (US$ Mn), By Product 2017-2022
TABLE 202 Thailand Bioactive Wound Management Market Value (US$ Mn), By End User 2012-2016
TABLE 203 Thailand Bioactive Wound Management Market Value (US$ Mn), By End User 2017-2022
TABLE 204 Thailand Bioactive Wound Management Market Value (US$ Mn), By Application 2012-2016
TABLE 205 Thailand Bioactive Wound Management Market Value (US$ Mn), By Application 2017-2022
TABLE 206 Singapore Bioactive Wound Management Market Value (US$ Mn), By Product 2012-2016
TABLE 207 Singapore Bioactive Wound Management Market Value (US$ Mn), By Product 2017-2022
TABLE 208 Singapore Bioactive Wound Management Market Value (US$ Mn), By End User 2012-2016
TABLE 209 Singapore Bioactive Wound Management Market Value (US$ Mn), By End User 2017-2022
TABLE 210 Singapore Bioactive Wound Management Market Value (US$ Mn), By Application 2012-2016
TABLE 211 Singapore Bioactive Wound Management Market Value (US$ Mn), By Application 2017-2022
TABLE 212 Australia Bioactive Wound Management Market Value (US$ Mn), By Product 2012-2016
TABLE 213 Australia Bioactive Wound Management Market Value (US$ Mn), By Product 2017-2022
TABLE 214 Australia Bioactive Wound Management Market Value (US$ Mn), By End User 2012-2016
TABLE 215 Australia Bioactive Wound Management Market Value (US$ Mn), By End User 2017-2022
TABLE 216 Australia Bioactive Wound Management Market Value (US$ Mn), By Application 2012-2016
TABLE 217 Australia Bioactive Wound Management Market Value (US$ Mn), By Application 2017-2022
TABLE 218 GCC Countries Bioactive Wound Management Market Value (US$ Mn), By Product 2012-2016
TABLE 219 GCC Countries Bioactive Wound Management Market Value (US$ Mn), By Product 2017-2022
TABLE 220 GCC Countries Bioactive Wound Management Market Value (US$ Mn), By End User 2012-2016
TABLE 221 GCC Countries Bioactive Wound Management Market Value (US$ Mn), By End User 2017-2022
TABLE 222 GCC Countries Bioactive Wound Management Market Value (US$ Mn), By Application 2012-2016
TABLE 223 GCC Countries Bioactive Wound Management Market Value (US$ Mn), By Application 2017-2022
TABLE 224 South Africa Bioactive Wound Management Market Value (US$ Mn), By Product 2012-2016
TABLE 225 South Africa Bioactive Wound Management Market Value (US$ Mn), By Product 2017-2022
TABLE 226 South Africa Bioactive Wound Management Market Value (US$ Mn), By End User 2012-2016
TABLE 227 South Africa Bioactive Wound Management Market Value (US$ Mn), By End User 2017-2022
TABLE 228 South Africa Bioactive Wound Management Market Value (US$ Mn), By Application 2012-2016
TABLE 229 South Africa Bioactive Wound Management Market Value (US$ Mn), By Application 2017-2022
TABLE 230 Nigeria Bioactive Wound Management Market Value (US$ Mn), By Product 2012-2016
TABLE 231 Nigeria Bioactive Wound Management Market Value (US$ Mn), By Product 2017-2022
TABLE 232 Nigeria Bioactive Wound Management Market Value (US$ Mn), By End User 2012-2016
TABLE 233 Nigeria Bioactive Wound Management Market Value (US$ Mn), By End User 2017-2022
TABLE 234 Nigeria Bioactive Wound Management Market Value (US$ Mn), By Application 2012-2016
TABLE 235 Nigeria Bioactive Wound Management Market Value (US$ Mn), By Application 2017-2022
TABLE 236 Israel Bioactive Wound Management Market Value (US$ Mn), By Product 2012-2016
TABLE 237 Israel Bioactive Wound Management Market Value (US$ Mn), By Product 2017-2022
TABLE 238 Israel Bioactive Wound Management Market Value (US$ Mn), By End User 2012-2016
TABLE 239 Israel Bioactive Wound Management Market Value (US$ Mn), By End User 2017-2022
TABLE 240 Israel Bioactive Wound Management Market Value (US$ Mn), By Application 2012-2016
TABLE 241 Israel Bioactive Wound Management Market Value (US$ Mn), By Application 2017-2022
List of Figures
FIG. 1 Global Bioactive Wound Management Market Value (US$ Mn), 2012-2016
FIG. 2 Global Bioactive Wound Management Market Value (US$ Mn) Forecast, 2017-2022
FIG. 3 Global Bioactive Wound Management Market Value (US$ Mn) and Y-o-Y, 2015-2022
FIG. 4 Global Xenografts Segment Market Value (US$ Mn) By Region, 2012-2016
FIG. 5 Global Xenografts Segment Market Value (US$ Mn) By Region, 2017-2022
FIG. 6 Global Xenografts Segment Y-o-Y Growth Rate, By Region, 2015-2022
FIG. 7 Global Allografts Segment Market Value (US$ Mn) By Region, 2012-2016
FIG. 8 Global Allografts Segment Market Value (US$ Mn) By Region, 2017-2022
FIG. 9 Global Allografts Segment Y-o-Y Growth Rate, By Region, 2015-2022
FIG. 10 Global Bioengineered Skin Substitutes Segment Market Value (US$ Mn) By Region, 2012-2016
FIG. 11 Global Bioengineered Skin Substitutes Segment Market Value (US$ Mn) By Region, 2017-2022
FIG. 12 Global Bioengineered Skin Substitutes Segment Y-o-Y Growth Rate, By Region, 2015-2022
FIG. 13 Global Collagen-based Dressings Segment Market Value (US$ Mn) By Region, 2012-2016
FIG. 14 Global Collagen-based Dressings Segment Market Value (US$ Mn) By Region, 2017-2022
FIG. 15 Global Collagen-based Dressings Segment Y-o-Y Growth Rate, By Region, 2015-2022
FIG. 16 Global Topical Dressings Segment Market Value (US$ Mn) By Region, 2012-2016
FIG. 17 Global Topical Dressings Segment Market Value (US$ Mn) By Region, 2017-2022
FIG. 18 Global Topical Dressings Segment Y-o-Y Growth Rate, By Region, 2015-2022
FIG. 19 Global Hospitals Segment Market Value (US$ Mn) By Region, 2012-2016
FIG. 20 Global Hospitals Segment Market Value (US$ Mn) By Region, 2017-2022
FIG. 21 Global Hospitals Segment Y-o-Y Growth Rate, By Region, 2015-2022
FIG. 22 Global Clinics Segment Market Value (US$ Mn) By Region, 2012-2016
FIG. 23 Global Clinics Segment Market Value (US$ Mn) By Region, 2017-2022
FIG. 24 Global Clinics Segment Y-o-Y Growth Rate, By Region, 2015-2022
FIG. 25 Global Ambulatory Surgical Centers Segment Market Value (US$ Mn) By Region, 2012-2016
FIG. 26 Global Ambulatory Surgical Centers Segment Market Value (US$ Mn) By Region, 2017-2022
FIG. 27 Global Ambulatory Surgical Centers Segment Y-o-Y Growth Rate, By Region, 2015-2022
FIG. 28 Global Trauma Centers Segment Market Value (US$ Mn) By Region, 2012-2016
FIG. 29 Global Trauma Centers Segment Market Value (US$ Mn) By Region, 2017-2022
FIG. 30 Global Trauma Centers Segment Y-o-Y Growth Rate, By Region, 2015-2022
FIG. 31 Global Venous Leg Ulcers Segment Market Value (US$ Mn) By Region, 2012-2016
FIG. 32 Global Venous Leg Ulcers Segment Market Value (US$ Mn) By Region, 2017-2022
FIG. 33 Global Venous Leg Ulcers Segment Y-o-Y Growth Rate, By Region, 2015-2022
FIG. 34 Global Diabetic Foot Ulcers Segment Market Value (US$ Mn) By Region, 2012-2016
FIG. 35 Global Diabetic Foot Ulcers Segment Market Value (US$ Mn) By Region, 2017-2022
FIG. 36 Global Diabetic Foot Ulcers Segment Y-o-Y Growth Rate, By Region, 2015-2022
FIG. 37 Global Pressure Ulcers Segment Market Value (US$ Mn) By Region, 2012-2016
FIG. 38 Global Pressure Ulcers Segment Market Value (US$ Mn) By Region, 2017-2022
FIG. 39 Global Pressure Ulcers Segment Y-o-Y Growth Rate, By Region, 2015-2022
FIG. 40 Global Surgical Wounds Segment Market Value (US$ Mn) By Region, 2012-2016
FIG. 41 Global Surgical Wounds Segment Market Value (US$ Mn) By Region, 2017-2022
FIG. 42 Global Surgical Wounds Segment Y-o-Y Growth Rate, By Region, 2015-2022
FIG. 43 Global Burn Wounds Segment Market Value (US$ Mn) By Region, 2012-2016
FIG. 44 Global Burn Wounds Segment Market Value (US$ Mn) By Region, 2017-2022
FIG. 45 Global Burn Wounds Segment Y-o-Y Growth Rate, By Region, 2015-2022
FIG. 46 North America Bioactive Wound Management Market Value (US$ Mn), By Product 2012-2016
FIG. 47 North America Bioactive Wound Management Market Value (US$ Mn), By Product 2017-2022
FIG. 48 North America Bioactive Wound Management Market Value (US$ Mn), By End User 2012-2016
FIG. 49 North America Bioactive Wound Management Market Value (US$ Mn), By End User 2017-2022
FIG. 50 North America Bioactive Wound Management Market Value (US$ Mn), By Application 2012-2016
FIG. 51 North America Bioactive Wound Management Market Value (US$ Mn), By Application 2017-2022
FIG. 52 Latin America Bioactive Wound Management Market Value (US$ Mn), By Product 2012-2016
FIG. 53 Latin America Bioactive Wound Management Market Value (US$ Mn), By Product 2017-2022
FIG. 54 Latin America Bioactive Wound Management Market Value (US$ Mn), By End User 2012-2016
FIG. 55 Latin America Bioactive Wound Management Market Value (US$ Mn), By End User 2017-2022
FIG. 56 Latin America Bioactive Wound Management Market Value (US$ Mn), By Application 2012-2016
FIG. 57 Latin America Bioactive Wound Management Market Value (US$ Mn), By Application 2017-2022
FIG. 58 Europe Bioactive Wound Management Market Value (US$ Mn), By Product 2012-2016
FIG. 59 Europe Bioactive Wound Management Market Value (US$ Mn), By Product 2017-2022
FIG. 60 Europe Bioactive Wound Management Market Value (US$ Mn), By End User 2012-2016
FIG. 61 Europe Bioactive Wound Management Market Value (US$ Mn), By End User 2017-2022
FIG. 62 Europe Bioactive Wound Management Market Value (US$ Mn), By Application 2012-2016
FIG. 63 Europe Bioactive Wound Management Market Value (US$ Mn), By Application 2017-2022
FIG. 64 Japan Bioactive Wound Management Market Value (US$ Mn), By Product 2012-2016
FIG. 65 Japan Bioactive Wound Management Market Value (US$ Mn), By Product 2017-2022
FIG. 66 Japan Bioactive Wound Management Market Value (US$ Mn), By End User 2012-2016
FIG. 67 Japan Bioactive Wound Management Market Value (US$ Mn), By End User 2017-2022
FIG. 68 Japan Bioactive Wound Management Market Value (US$ Mn), By Application 2012-2016
FIG. 69 Japan Bioactive Wound Management Market Value (US$ Mn), By Application 2017-2022
FIG. 70 APEJ Bioactive Wound Management Market Value (US$ Mn), By Product 2012-2016
FIG. 71 APEJ Bioactive Wound Management Market Value (US$ Mn), By Product 2017-2022
FIG. 72 APEJ Bioactive Wound Management Market Value (US$ Mn), By End User 2012-2016
FIG. 73 APEJ Bioactive Wound Management Market Value (US$ Mn), By End User 2017-2022
FIG. 74 APEJ Bioactive Wound Management Market Value (US$ Mn), By Application 2012-2016
FIG. 75 APEJ Bioactive Wound Management Market Value (US$ Mn), By Application 2017-2022
FIG. 76 MEA Bioactive Wound Management Market Value (US$ Mn), By Product 2012-2016
FIG. 77 MEA Bioactive Wound Management Market Value (US$ Mn), By Product 2017-2022
FIG. 78 MEA Bioactive Wound Management Market Value (US$ Mn), By End User 2012-2016
FIG. 79 MEA Bioactive Wound Management Market Value (US$ Mn), By End User 2017-2022
FIG. 80 MEA Bioactive Wound Management Market Value (US$ Mn), By Application 2012-2016
FIG. 81 MEA Bioactive Wound Management Market Value (US$ Mn), By Application 2017-2022
Copyright © Transparency Market Research, Inc. All Rights reserved
Trust Online

Bioactive Wound Management Market