
Reports
Reports
In the automotive space, manufacturers are developing novel techniques to avoid cold start engine damages. For this, manufacturers in the viscosity index improvers market for automotive are developing engine oils with nanoparticles to reduce engine damages. These engine oils are being increasingly used in light-duty automotive industries to reach higher ability and efficiency in vehicles, in comparison with ordinary engine oils.
The production of engine oil is estimated to reach ~1,004 kilotons by 2027 in the viscosity index improvers market for automotive. Due to this rising trend, manufacturers are unveiling nanolubricant engine oils with a combination of MWCNT (multi wall carbon nanotubes)-ZnO (zinc oxide nanoparticles). These nanoparticles significantly reduce viscosity, which helps in preventing damage caused while starting an engine in a cold start condition.
On the other hand, manufacturers in the viscosity index improvers market for automotive are innovating suitable copolymer combinations such as hydrogenated styrene-isoprene (HSD) copolymers that enhance thermal oxidation stability in vehicle engines. The growing demand for HSD copolymers is influenced by their stability and thickening ability in long-span multistage internal combustion engine oil.
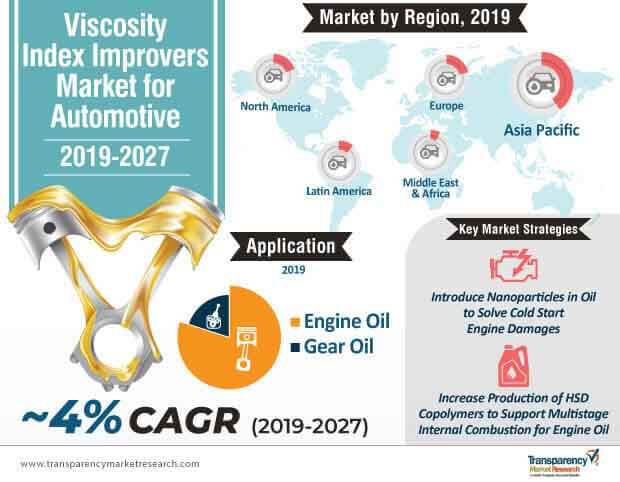
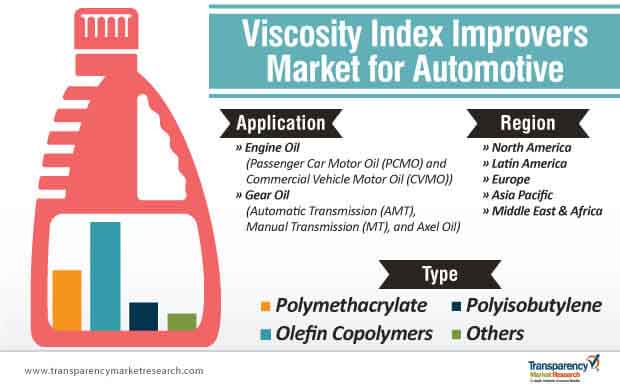
In the viscosity index improvers market for automotive, the production of oil additives for passenger car motor oil (PCMO) was valued at ~400 kilo tons in 2018. This shows that, consumers are highly dependent on stakeholders in the automotive supply chain for high-performance gear and engine oils that withstand extreme temperatures and contamination. This demand has given rise to multi-function engine oils that also keep the oil system clean, protect the oil system from corrosion, and suppress foaming.
Manufacturers are competing on the data front by collating on engine/fleet service data that supports the development of advanced additive and lubricant formulations. The demand for high mileage oil is also fueling the realm of the viscosity index improvers market for automotive. As consumers are becoming more conscious about car and engine oil maintenance, the availability of high mileage oil serves as an add-on for consumers who seek efficient vehicle performance.
In the past couple of years, oil prices have declined, which has also impacted the price of base oil and viscosity index improvers (VVI). Stringent government regulations have also affected the prices of oil additives in the viscosity index improvers market for automotive. Manufacturers also need to meet strict emission-control requirements laid down by governments.
Experts in the domain of viscosity index improvers market for automotive suggest that, the increasing pace of technological changes is not meeting the specific development methods of manufacturers. These methods are criticized to be laborious and overly complex.
To overcome these challenges, manufacturers make sure to meet industry standards in the viscosity index improvers market for automotive. Abiding by these quality standards is helping manufacturers invent and manufacture superior products that speed-up the acceptance of the product’s practicality in the global market.
Analysts’ Viewpoint on Viscosity Index Improvers Market for Automotive
Manufacturers in the viscosity index improvers market for automotive are developing oil additives that prevent the hardening of wax particles in motor oil in regions with extreme cold conditions. They are gathering field performance data to innovate new combinations in copolymers. However, one of the major challenges that manufacturers are experiencing is the influx of electric vehicles, which has impacted the demand for gear and engine oils with additives. As such, manufacturers are expanding production arms in other industries such as the marine industry. They are also increasing research & development to adopt production techniques that cater to electric vehicles (EVs). Due to the growing trend of EV adoption, manufacturers should produce fluids that meet the new technical requirements of electric powertrains.
Global Viscosity Index Improvers Market for Automotive: Description
Viscosity Index Improvers Market for Automotive: Increased Demand for Lubricants in Automotive Industry
Longer Engine Oil Drain Intervals to Hamper Viscosity Index Improvers Market for Automotive
Viscosity Index Improvers Market for Automotive: Increasing Demand for Better Fuel Economy to Present New Opportunities
Viscosity Index Improvers Market for Automotive: Recent Developments, Expansions, Acquisitions, and New Contracts
Asia Pacific a Prominent Viscosity Index Improvers Market for Automotive
Global Viscosity Index Improvers Market for Automotive Highly Competitive
1. Preface
1.1. Report Scope and Market Segmentation
1.2. Research Highlights
2. Assumptions and Research Methodology
2.1. Assumptions and Acronyms Used
2.2. Research Methodology
3. Executive Summary: Global Viscosity Index Improvers Market for Automotive Industry
3.1. Market Snapshot
3.2. Top Three Trends
4. Market Overview
4.1. Product Overview
4.2. Key Industry Developments
4.3. Market Indicators
5. Market Dynamics
5.1. Drivers and Restraints Snapshot Analysis
5.1.1. Drivers
5.1.2. Restraints
5.1.3. Opportunities
5.2. Impact of Electric Vehicles on Lubricant Consumption in Automobiles
5.3. Global Viscosity Index Improvers Market for Automotive Industry Analysis and Forecast, 2018-2027
5.4. Porter’s Five Forces Analysis
5.4.1. Threat of Substitutes
5.4.2. Bargaining Power of Buyers
5.4.3. Bargaining Power of Suppliers
5.4.4. Threat of New Entrants
5.4.5. Degree of Competition
5.5. Regulatory Scenario
5.6. Value Chain Analysis
6. Global Viscosity Index Improvers Market for Automotive Industry Volume (Kilo Tons) and Value (US$ Mn) Analysis, by Type
6.1. Key Findings and Introduction
6.2. Global Viscosity Index Improvers Market for Automotive Industry Volume (Kilo Tons) and Value (US$ Mn) Forecast, by Type, 2018–2027
6.2.1. Global Viscosity Index Improvers Market for Automotive Industry Volume (Kilo Tons) and Value (US$ Mn) Forecast, by Polymethacrylate, 2018–2027
6.2.2. Global Viscosity Index Improvers Market for Automotive Industry Volume (Kilo Tons) and Value (US$ Mn) Forecast, by Olefin Copolymer, 2018–2027
6.2.3. Global Viscosity Index Improvers Market for Automotive Industry Volume (Kilo Tons) and Value (US$ Mn) Forecast, by Polyisobutylene, 2018–2027
6.2.4. Global Viscosity Index Improvers Market for Automotive Industry Volume (Kilo Tons) and Value (US$ Mn) Forecast, by Others, 2018–2027
6.3. Global Viscosity Index Improvers Market for Automotive Industry Attractiveness Analysis, by Type
7. Global Viscosity Index Improvers Market for Automotive Industry Volume (Kilo Tons) and Value (US$ Mn) Analysis, by Application
7.1. Key Findings and Introduction
7.2. Global Viscosity Index Improvers Market for Automotive Industry Volume (Kilo Tons) and Value (US$ Mn) Forecast, by Application, 2018–2027
7.2.1. Global Viscosity Index Improvers Market for Automotive Industry Volume (Kilo Tons) and Value (US$ Mn) Forecast, by Engine Oil, 2018–2027
7.2.1.1. Global Viscosity Index Improvers Market for Automotive Industry Volume (Kilo Tons) and Value (US$ Mn) Forecast, by Commercial Vehicle Motor Oil (CVMO), 2018–2027
7.2.1.2. Global Viscosity Index Improvers Market for Automotive Industry Volume (Kilo Tons) and Value (US$ Mn) Forecast, by Passenger Car Motor Oil (PCMO), 2018–2027
7.2.2. Global Viscosity Index Improvers Market for Automotive Industry Volume (Kilo Tons) and Value (US$ Mn) Forecast, by Gear Oil, 2018–2027
7.2.2.1. Global Viscosity Index Improvers Market for Automotive Industry Volume (Kilo Tons) and Value (US$ Mn) Forecast, by Automatic Transmission (AMT), 2018–2027
7.2.2.2. Global Viscosity Index Improvers Market for Automotive Industry Volume (Kilo Tons) and Value (US$ Mn) Forecast, by Manual Transmission (MT), 2018–2027
7.2.2.3. Global Viscosity Index Improvers Market for Automotive Industry Volume (Kilo Tons) and Value (US$ Mn) Forecast, by Axel Oil, 2018–2027
7.3. Global Viscosity Index Improvers Market for Automotive Industry Attractiveness Analysis, by Application
8. Global Viscosity Index Improvers Market for Automotive Industry Analysis, by Region
8.1. Key Findings
8.2. Global Viscosity Index Improvers Market for Automotive Industry Volume (Kilo Tons) and Value (US$ Mn) Forecast, by Region
8.2.1. North America
8.2.2. Europe
8.2.3. Asia Pacific
8.2.4. Latin America
8.2.5. Middle East & Africa
8.3. Global Viscosity Index Improvers Market for Automotive Industry Attractiveness Analysis, by Region
9. North America Viscosity Index Improvers Market for Automotive Industry Overview
9.1. Key Findings
9.2. North America Viscosity Index Improvers Market for Automotive Industry Volume (Kilo Tons) and Value (US$ Mn) Forecast, by Type, 2018–2027
9.3. North America Viscosity Index Improvers Market for Automotive Industry Volume (Kilo Tons) and Value (US$ Mn) Forecast, by Application, 2018–2027
9.4. North America Viscosity Index Improvers Market for Automotive Industry Volume (Kilo Tons) and Value (US$ Mn) Forecast, by Country
9.4.1. U.S. Viscosity Index Improvers Market for Automotive Industry Volume (Kilo Tons) and Value (US$ Mn) Forecast, by Type, 2018–2027
9.4.2. U.S. Viscosity Index Improvers Market for Automotive Industry Volume (Kilo Tons) and Value (US$ Mn) Forecast, by Application, 2018–2027
9.4.3. Canada Viscosity Index Improvers Market for Automotive Industry Volume (Kilo Tons) and Value (US$ Mn) Forecast, by Type, 2018–2027
9.4.4. Canada Viscosity Index Improvers Market for Automotive Industry Volume (Kilo Tons) and Value (US$ Mn) Forecast, by Application, 2018–2027
9.5. North America Viscosity Index Improvers Market for Automotive Industry Attractiveness Analysis, by Type
9.6. North America Viscosity Index Improvers Market for Automotive Industry Attractiveness Analysis, by Application
9.7. North America Viscosity Index Improvers Market for Automotive Industry Attractiveness Analysis, by Country
10. Europe Viscosity Index Improvers Market for Automotive Industry Overview
10.1. Key Findings
10.2. Europe Viscosity Index Improvers Market for Automotive Industry Volume (Kilo Tons) and Value (US$ Mn) Forecast, by Type, 2018–2027
10.3. Europe Viscosity Index Improvers Market for Automotive Industry Volume (Kilo Tons) and Value (US$ Mn) Forecast, by Application, 2018–2027
10.4. Europe Viscosity Index Improvers Market for Automotive Industry Volume (Kilo Tons) and Value (US$ Mn) and Forecast, by Country and Sub-region
10.4.1. Germany Viscosity Index Improvers Market for Automotive Industry Volume (Kilo Tons) and Value (US$ Mn) Forecast, by Type, 2018–2027
10.4.2. Germany Viscosity Index Improvers Market for Automotive Industry Volume (Kilo Tons) and Value (US$ Mn) Forecast, by Application, 2018–2027
10.4.3. France Viscosity Index Improvers Market for Automotive Industry Volume (Kilo Tons) and Value (US$ Mn) Forecast, by Type, 2018–2027
10.4.4. France Viscosity Index Improvers Market for Automotive Industry Volume (Kilo Tons) and Value (US$ Mn) Forecast, by Application, 2018–2027
10.4.5. U.K. Viscosity Index Improvers Market for Automotive Industry Volume (Kilo Tons) and Value (US$ Mn) Forecast, by Type, 2018–2027
10.4.6. U.K. Viscosity Index Improvers Market for Automotive Industry Volume (Kilo Tons) and Value (US$ Mn) Forecast, by Application, 2018–2027
10.4.7. Italy Viscosity Index Improvers Market for Automotive Industry Volume (Kilo Tons) and Value (US$ Mn) Forecast, by Type, 2018–2027
10.4.8. Italy Viscosity Index Improvers Market for Automotive Industry Volume (Kilo Tons) and Value (US$ Mn) Forecast, by Application, 2018–2027
10.4.9. Spain Viscosity Index Improvers Market for Automotive Industry Volume (Kilo Tons) and Value (US$ Mn) Forecast, by Type, 2018–2027
10.4.10. Spain Viscosity Index Improvers Market for Automotive Industry Volume (Kilo Tons) and Value (US$ Mn) Forecast, by Application, 2018–2027
10.4.11. Russia & CIS Viscosity Index Improvers Market for Automotive Industry Volume (Kilo Tons) and Value (US$ Mn) Forecast, by Type, 2018–2027
10.4.12. Russia & CIS Viscosity Index Improvers Market for Automotive Industry Volume (Kilo Tons) and Value (US$ Mn) Forecast, by Application, 2018–2027
10.4.13. Rest of Europe Viscosity Index Improvers Market for Automotive Industry Volume (Kilo Tons) and Value (US$ Mn) Forecast, by Type, 2018–2027
10.4.14. Rest of Europe Viscosity Index Improvers Market for Automotive Industry Volume (Kilo Tons) and Value (US$ Mn) Forecast, by Application, 2018–2027
10.5. Europe Viscosity Index Improvers Market for Automotive Industry Attractiveness Analysis, by Type
10.6. Europe Viscosity Index Improvers Market for Automotive Industry Attractiveness Analysis, by Application
10.7. Europe Viscosity Index Improvers Market for Automotive Industry Attractiveness Analysis, by Country and Sub-region
11. Asia Pacific Viscosity Index Improvers Market for Automotive Industry Overview
11.1. Key Findings
11.2. Asia Pacific Viscosity Index Improvers Market for Automotive Industry Volume (Kilo Tons) and Value (US$ Mn) Forecast, by Type, 2018–2027
11.3. Asia Pacific Viscosity Index Improvers Market for Automotive Industry Volume (Kilo Tons) and Value (US$ Mn) Forecast, by Application, 2018–2027
11.4. Asia Pacific Viscosity Index Improvers Market for Automotive Industry Volume (Kilo Tons) and Value (US$ Mn) Forecast, by Country and Sub-region
11.4.1. China Viscosity Index Improvers Market for Automotive Industry Volume (Kilo Tons) and Value (US$ Mn) Forecast, by Type, 2018–2027
11.4.2. China Viscosity Index Improvers Market for Automotive Industry Volume (Kilo Tons) and Value (US$ Mn) Forecast, by Application, 2018–2027
11.4.3. India Viscosity Index Improvers Market for Automotive Industry Volume (Kilo Tons) and Value (US$ Mn) Forecast, by Type
11.4.4. India Viscosity Index Improvers Market for Automotive Industry Volume (Kilo Tons) and Value (US$ Mn) Forecast, by Application, 2018–2027
11.4.5. Japan Viscosity Index Improvers Market for Automotive Industry Volume (Kilo Tons) and Value (US$ Mn) Forecast, by Type
11.4.6. Japan Viscosity Index Improvers Market for Automotive Industry Volume (Kilo Tons) and Value (US$ Mn) Forecast, by Application, 2018–2027
11.4.7. ASEAN Viscosity Index Improvers Market for Automotive Industry Volume (Kilo Tons) and Value (US$ Mn) Forecast, by Type
11.4.8. ASEAN Viscosity Index Improvers Market for Automotive Industry Volume (Kilo Tons) and Value (US$ Mn) Forecast, by Application, 2018–2027
11.4.9. Rest of Asia Pacific Viscosity Index Improvers Market for Automotive Industry Volume (Kilo Tons) and Value (US$ Mn) Forecast, by Type
11.4.10. Rest of Asia Pacific Viscosity Index Improvers Market for Automotive Industry Volume (Kilo Tons) and Value (US$ Mn) Forecast, by Application, 2018–2027
11.5. Asia Pacific Viscosity Index Improvers Market for Automotive Industry Attractiveness Analysis, by Type
11.6. Asia Pacific Viscosity Index Improvers Market for Automotive Industry Attractiveness Analysis, by Application
11.7. Asia Pacific Viscosity Index Improvers Market for Automotive Industry Attractiveness Analysis, by Country and Sub-region
12. Middle East & Africa Viscosity Index Improvers Market for Automotive Industry Overview
12.1. Key Findings
12.2. Middle East & Africa Viscosity Index Improvers Market for Automotive Industry Volume (Kilo Tons) and Value (US$ Mn) Forecast, by Type, 2018–2027
12.3. Middle East & Africa Viscosity Index Improvers Market for Automotive Industry Volume (Kilo Tons) and Value (US$ Mn) Forecast, by Application, 2018–2027
12.4. Middle East & Africa Viscosity Index Improvers Market for Automotive Industry Volume (Kilo Tons) and Value (US$ Mn) Forecast, by Country and Sub-region
12.4.1. GCC Viscosity Index Improvers Market for Automotive Industry Volume (Kilo Tons) and Value (US$ Mn) Forecast, by Type, 2018–2027
12.4.2. GCC Viscosity Index Improvers Market for Automotive Industry Volume (Kilo Tons) and Value (US$ Mn) Forecast, by Application, 2018–2027
12.4.3. South Africa Viscosity Index Improvers Market for Automotive Industry Volume (Kilo Tons) and Value (US$ Mn) Forecast, by Type, 2018–2027
12.4.4. South Africa Viscosity Index Improvers Market for Automotive Industry Volume (Kilo Tons) and Value (US$ Mn) Forecast, by Application, 2018–2027
12.4.5. Rest of Middle East & Africa Viscosity Index Improvers Market for Automotive Industry Volume (Kilo Tons) and Value (US$ Mn) Forecast, by Type, 2018–2027
12.4.6. Rest of Middle East & Africa Viscosity Index Improvers Market for Automotive Industry Volume (Kilo Tons) and Value (US$ Mn) Forecast, by Application, 2018–2027
12.5. Middle East & Africa Viscosity Index Improvers Market for Automotive Industry Attractiveness Analysis, by Type
12.6. Middle East & Africa Viscosity Index Improvers Market for Automotive Industry Attractiveness Analysis, by Application
12.7. Middle East & Africa Viscosity Index Improvers Market for Automotive Industry Attractiveness Analysis, by Country and Sub-region
13. Latin America Viscosity Index Improvers Market for Automotive Industry Overview
13.1. Key Findings
13.2. Latin America Viscosity Index Improvers Market for Automotive Industry Volume (Kilo Tons) and Value (US$ Mn) Forecast, by Type, 2018–2027
13.3. Latin America Viscosity Index Improvers Market for Automotive Industry Volume (Kilo Tons) and Value (US$ Mn) Forecast, by Application, 2018–2027
13.4. Latin America Viscosity Index Improvers Market for Automotive Industry Volume (Kilo Tons) and Value (US$ Mn) Forecast, by Country and Sub-region
13.4.1. Brazil Viscosity Index Improvers Market for Automotive Industry Volume (Kilo Tons) and Value (US$ Mn) Forecast, by Type, 2018–2027
13.4.2. Brazil Viscosity Index Improvers Market for Automotive Industry Volume (Kilo Tons) and Value (US$ Mn) Forecast, by Application, 2018–2027
13.4.3. Mexico Viscosity Index Improvers Market for Automotive Industry Volume (Kilo Tons) and Value (US$ Mn) Forecast, by Type, 2018–2027
13.4.4. Mexico Viscosity Index Improvers Market for Automotive Industry Volume (Kilo Tons) and Value (US$ Mn) Forecast, by Application, 2018–2027
13.4.5. Rest of Latin America Viscosity Index Improvers Market for Automotive Industry Volume (Kilo Tons) and Value (US$ Mn) Forecast, by Type, 2018–2027
13.4.6. Rest of Latin America Viscosity Index Improvers Market for Automotive Industry Volume (Kilo Tons) and Value (US$ Mn) Forecast, by Application, 2018–2027
13.5. Latin America Viscosity Index Improvers Market for Automotive Industry Attractiveness Analysis, by Type
13.6. Latin America Viscosity Index Improvers Market for Automotive Industry Attractiveness Analysis, by Application
13.7. Latin America Viscosity Index Improvers Market for Automotive Industry Attractiveness Analysis, by Country and Sub-region
14. Competition Landscape
14.1. Global Viscosity Index Improvers Market for Automotive Industry Share Analysis, by Company (2018)
14.2. Competition Matrix
14.2.1. Evonik Industries
14.2.2. Chevron Oronite Company LLC
14.3. Market Footprint Analysis
14.4. Competitive Business Strategies
14.5. Company Profiles
14.5.1. The Lubrizol Corporation
14.5.1.1. Company Details
14.5.1.2. Company Description
14.5.1.3. Business Overview
14.5.1.4. Financial Details
14.5.1.5. Strategic Overview/Recent Developments
14.5.2. BASF Corporation
14.5.2.1. Company Details
14.5.2.2. Company Description
14.5.2.3. Business Overview
14.5.2.4. Financial Details
14.5.2.5. Strategic Overview/Recent Developments
14.5.3. Mitsui Chemicals, Inc
14.5.3.1. Company Details
14.5.3.2. Company Description
14.5.3.3. Business Overview
14.5.3.4. Financial Details
14.5.3.5. Strategic Overview/Recent Developments
14.5.4. Chevron Oronite Company LLC
14.5.4.1. Company Details
14.5.4.2. Company Description
14.5.4.3. Business Overview
14.5.4.4. Strategic Overview/Recent Developments
14.5.5. Evonik Industries
14.5.5.1. Company Details
14.5.5.2. Company Description
14.5.5.3. Business Overview
14.5.5.4. Financial Details
14.5.5.5. Strategic Overview/Recent Developments
14.5.6. Afton Chemical
14.5.6.1. Company Details
14.5.6.2. Company Description
14.5.6.3. Business Overview
14.5.6.4. Strategic Overview/Recent Developments
14.5.7. Nanjing Runyou Chemical industry Additive Co., Ltd.
14.5.7.1. Company Details
14.5.7.2. Company Description
14.5.7.3. Business Overview
14.5.8. Shenyang Great Wall Lubricating Oil Manufacturing Co. Ltd.
14.5.8.1. Company Details
14.5.8.2. Company Description
14.5.8.3. Business Overview
14.5.9. Sanyo Chemical Industries, Ltd.
14.5.9.1. Company Details
14.5.9.2. Company Description
14.5.9.3. Business Overview
14.5.9.4. Financial Details
14.5.9.5. Strategic Overview/Recent Developments
14.5.10. Prasol Chemicals Pvt. Ltd
14.5.10.1. Company Details
14.5.10.2. Company Description
14.5.10.3. .Business Overview
14.5.11. BPT Chemicals
14.5.11.1. Company Details
14.5.11.2. Company Description
14.5.11.3. Business Overview
14.5.12. Jilin Xingyun Chemical Co., Ltd
14.5.12.1. Company Details
14.5.12.2. Company Description
14.5.12.3. Business Overview
14.5.13. ARLANXEO
14.5.13.1. Company Details
14.5.13.2. Company Description
14.5.13.3. Business Overview
List of Tables
Table 01: Impact of Electric Vehicles on Lubricant Consumption in Automobiles
Table 02: Global Viscosity Index Improvers Market for Automotive Volume (Kilo Tons) Forecast, by Type, 2018–2027
Table 03: Global Viscosity Index Improvers Market for Automotive Value (US$ Mn) Forecast, by Type, 2018–2027
Table 04: Global Viscosity Index Improvers Market for Automotive Volume (Kilo Tons) Forecast, by Application, 2018–2027
Table 05: Global Viscosity Index Improvers Market for Automotive Value (US$ Mn) Forecast, by Application, 2018–2027
Table 06: Global Viscosity Index Improvers Market for Automotive Volume (Kilo Tons) Forecast, by Region, 2018–2027
Table 07: Global Viscosity Index Improvers Market for Automotive Value (US$ Mn) Forecast, by Region, 2018–2027
Table 08: North America Viscosity Index Improvers Market for Automotive Volume (Kilo Tons) Forecast, by Type, 2018–2027
Table 09: North America Viscosity Index Improvers Market for Automotive Value (US$ Mn) Forecast, by Type, 2018–2027
Table 10: North America Viscosity Index Improvers Market for Automotive Volume (Kilo Tons) Forecast, by Application, 2018–2027
Table 11: North America Viscosity Index Improvers Market for Automotive Value (US$ Mn) Forecast, by Application, 2018–2027
Table 12: North America Viscosity Index Improvers Market for Automotive Volume (Kilo Tons) Forecast, by Country, 2018–2027
Table 13: North America Viscosity Index Improvers Market for Automotive Value (US$ Mn) Forecast, by Country, 2018–2027
Table 14: U.S. Viscosity Index Improvers Market for Automotive Volume (Kilo Tons) Forecast, by Type, 2018–2027
Table 15: U.S. Viscosity Index Improvers Market for Automotive Value (US$ Mn) Forecast, by Type, 2018–2027
Table 16: U.S. Viscosity Index Improvers Market for Automotive Volume (Kilo Tons) Forecast, by Application, 2018–2027
Table 17: U.S. Viscosity Index Improvers Market for Automotive Value (US$ Mn) Forecast, by Application, 2018–2027
Table 18: Canada Viscosity Index Improvers Market for Automotive Volume (Kilo Tons) Forecast, by Type, 2018–2027
Table 19: Canada Viscosity Index Improvers Market for Automotive Value (US$ Mn) Forecast, by Type, 2018–2027
Table 20: Canada Viscosity Index Improvers Market for Automotive Volume (Kilo Tons) Forecast, by Application, 2018–2027
Table 21: Canada Viscosity Index Improvers Market for Automotive Value (US$ Mn) Forecast, by Application, 2018–2027
Table 22: Europe Viscosity Index Improvers Market for Automotive Volume (Kilo Tons) Forecast, by Type, 2018–2027
Table 23: Europe Viscosity Index Improvers Market for Automotive Value (US$ Mn) Forecast, by Type, 2018–2027
Table 24: Europe Viscosity Index Improvers Market for Automotive Volume (Kilo Tons) Forecast, by Application, 2018–2027
Table 25: Europe Viscosity Index Improvers Market for Automotive Value (US$ Mn) Forecast, by Application, 2018–2027
Table 26: Europe Viscosity Index Improvers Market for Automotive Volume (Kilo Tons) Forecast, by Country and Sub-region, 2018–2027
Table 27: Europe Viscosity Index Improvers Market for Automotive Value (US$ Mn) Forecast, by Country and Sub-region, 2018–2027
Table 28: Germany Viscosity Index Improvers Market for Automotive Volume (Kilo Tons) Forecast, by Type, 2018–2027
Table 29: Germany Viscosity Index Improvers Market for Automotive Value (US$ Mn) Forecast, by Type, 2018–2027
Table 30: Germany Viscosity Index Improvers Market for Automotive Volume (Kilo Tons) Forecast, by Application, 2018–2027
Table 31: Germany Viscosity Index Improvers Market for Automotive Value (US$ Mn) Forecast, by Application, 2018–2027
Table 32: France Viscosity Index Improvers Market for Automotive Volume (Kilo Tons) Forecast, by Type, 2018–2027
Table 33: France Viscosity Index Improvers Market for Automotive Value (US$ Mn) Forecast, by Type, 2018–2027
Table 34: France Viscosity Index Improvers Market for Automotive Volume (Kilo Tons) Forecast, by Application, 2018–2027
Table 35: France Viscosity Index Improvers Market for Automotive Value (US$ Mn) Forecast, by Application, 2018–2027
Table 36: U.K. Viscosity Index Improvers Market for Automotive Volume (Kilo Tons) Forecast, by Type, 2018–2027
Table 37: U.K. Viscosity Index Improvers Market for Automotive Value (US$ Mn) Forecast, by Type, 2018–2027
Table 38: U.K. Viscosity Index Improvers Market for Automotive Volume (Kilo Tons) Forecast, by Application, 2018–2027
Table 39: U.K. Viscosity Index Improvers Market for Automotive Value (US$ Mn) Forecast, by Application, 2018–2027
Table 40: Italy Viscosity Index Improvers Market for Automotive Volume (Kilo Tons) Forecast, by Type, 2018–2027
Table 41: Italy Viscosity Index Improvers Market for Automotive Value (US$ Mn) Forecast, by Type, 2018–2027
Table 42: Italy Viscosity Index Improvers Market for Automotive Volume (Kilo Tons) Forecast, by Application, 2018–2027
Table 43: Italy Viscosity Index Improvers Market for Automotive Value (US$ Mn) Forecast, by Application, 2018–2027
Table 44: Spain Viscosity Index Improvers Market for Automotive Volume (Kilo Tons) Forecast, by Type, 2018–2027
Table 45: Spain Viscosity Index Improvers Market for Automotive Value (US$ Mn) Forecast, by Type, 2018–2027
Table 46: Spain Viscosity Index Improvers Market for Automotive Volume (Kilo Tons) Forecast, by Application, 2018–2027
Table 47: Spain Viscosity Index Improvers Market for Automotive Value (US$ Mn) Forecast, by Application, 2018–2027
Table 48: Russia & CIS Viscosity Index Improvers Market for Automotive Volume (Kilo Tons) Forecast, by Type, 2018–2027
Table 49: Russia & CIS Viscosity Index Improvers Market for Automotive Value (US$ Mn) Forecast, by Type, 2018–2027
Table 50: Russia & CIS Viscosity Index Improvers Market for Automotive Volume (Kilo Tons) Forecast, by Application, 2018–2027
Table 51: Russia & CIS Viscosity Index Improvers Market for Automotive Value (US$ Mn) Forecast, by Application, 2018–2027
Table 52: Rest of Europe Viscosity Index Improvers Market for Automotive Volume (Kilo Tons) Forecast, by Type, 2018–2027
Table 53: Rest of Europe Viscosity Index Improvers Market for Automotive Value (US$ Mn) Forecast, by Type, 2018–2027
Table 54: Rest of Europe Viscosity Index Improvers Market for Automotive Volume (Kilo Tons) Forecast, by Application, 2018–2027
Table 55: Rest of Europe Viscosity Index Improvers Market for Automotive Value (US$ Mn) Forecast, by Application, 2018–2027
Table 56: Asia Pacific Viscosity Index Improvers Market for Automotive Volume (Kilo Tons) Forecast, by Type, 2018–2027
Table 57: Asia Pacific Viscosity Index Improvers Market for Automotive Value (US$ Mn) Forecast, by Type, 2018–2027
Table 58: Asia Pacific Viscosity Index Improvers Market for Automotive Volume (Kilo Tons) Forecast, by Application, 2018–2027
Table 59: Asia Pacific Viscosity Index Improvers Market for Automotive Value (US$ Mn) Forecast, by Application, 2018–2027
Table 60: Asia Pacific Viscosity Index Improvers Market for Automotive Volume (Kilo Tons) Forecast, by Country and Sub-region, 2018–2027
Table 61: Asia Pacific Viscosity Index Improvers Market for Automotive Value (US$ Mn) Forecast, by Country and Sub-region, 2018–2027
Table 62: China Viscosity Index Improvers Market for Automotive Volume (Kilo Tons) Forecast, by Type, 2018–2027
Table 63: China Viscosity Index Improvers Market for Automotive Value (US$ Mn) Forecast, by Type, 2018–2027
Table 64: China Viscosity Index Improvers Market for Automotive Volume (Kilo Tons) Forecast, by Application, 2018–2027
Table 65: China Viscosity Index Improvers Market for Automotive Value (US$ Mn) Forecast, by Application, 2018–2027
Table 66: India Viscosity Index Improvers Market for Automotive Volume (Kilo Tons) Forecast, by Type, 2018–2027
Table 67: India Viscosity Index Improvers Market for Automotive Value (US$ Mn) Forecast, by Type, 2018–2027
Table 68: India Viscosity Index Improvers Market for Automotive Volume (Kilo Tons) Forecast, by Application, 2018–2027
Table 69: India Viscosity Index Improvers Market for Automotive Value (US$ Mn) Forecast, by Application, 2018–2027
Table 70: Japan Viscosity Index Improvers Market for Automotive Volume (Kilo Tons) Forecast, by Type, 2018–2027
Table 71: Japan Viscosity Index Improvers Market for Automotive Value (US$ Mn) Forecast, by Type, 2018–2027
Table 72: Japan Viscosity Index Improvers Market for Automotive Volume (Kilo Tons) Forecast, by Application, 2018–2027
Table 73: Japan Viscosity Index Improvers Market for Automotive Value (US$ Mn) Forecast, by Application, 2018–2027
Table 74: ASEAN Viscosity Index Improvers Market for Automotive Volume (Kilo Tons) Forecast, by Type, 2018–2027
Table 75: ASEAN Viscosity Index Improvers Market for Automotive Value (US$ Mn) Forecast, by Type, 2018–2027
Table 76: ASEAN Viscosity Index Improvers Market for Automotive Volume (Kilo Tons) Forecast, by Application, 2018–2027
Table 77: ASEAN Viscosity Index Improvers Market for Automotive Value (US$ Mn) Forecast, by Application, 2018–2027
Table 78: Rest of Asia Pacific Viscosity Index Improvers Market for Automotive Volume (Kilo Tons) Forecast, by Type, 2018–2027
Table 79: Rest of Asia Pacific Viscosity Index Improvers Market for Automotive Value (US$ Mn) Forecast, by Type, 2018–2027
Table 80: Rest of Asia Pacific Viscosity Index Improvers Market for Automotive Volume (Kilo Tons) Forecast, by Application, 2018–2027
Table 81: Rest of Asia Pacific Viscosity Index Improvers Market for Automotive Value (US$ Mn) Forecast, by Application, 2018–2027
Table 82: Middle East & Africa Viscosity Index Improvers Market for Automotive Volume (Kilo Tons) Forecast, by Type, 2018–2027
Table 83: Middle East & Africa Viscosity Index Improvers Market for Automotive Value (US$ Mn) Forecast, by Type, 2018–2027
Table 84: Middle East & Africa Viscosity Index Improvers Market for Automotive Volume (Kilo Tons) Forecast, by Application, 2018–2027
Table 85: Middle East & Africa Viscosity Index Improvers Market for Automotive Value (US$ Mn) Forecast, by Application, 2018–2027
Table 86: Middle East & Africa Viscosity Index Improvers Market for Automotive Volume (Kilo Tons) Forecast, by Country and Sub-region, 2018–2027
Table 87: Middle East & Africa Viscosity Index Improvers Market for Automotive Value (US$ Mn) Forecast, by Country and Sub-region, 2018–2027
Table 88: GCC Viscosity Index Improvers Market for Automotive Volume (Kilo Tons) Forecast, by Type, 2018–2027
Table 89: GCC Viscosity Index Improvers Market for Automotive Value (US$ Mn) Forecast, by Type, 2018–2027
Table 90: GCC Viscosity Index Improvers Market for Automotive Volume (Kilo Tons) Forecast, by Application, 2018–2027
Table 91: GCC Viscosity Index Improvers Market for Automotive Value (US$ Mn) Forecast, by Application, 2018–2027
Table 92: South Africa Viscosity Index Improvers Market for Automotive Volume (Kilo Tons) Forecast, by Type, 2018–2027
Table 93: South Africa Viscosity Index Improvers Market for Automotive Value (US$ Mn) Forecast, by Type, 2018–2027
Table 94: South Africa Viscosity Index Improvers Market for Automotive Volume (Kilo Tons) Forecast, by Application, 2018–2027
Table 95: South Africa Viscosity Index Improvers Market for Automotive Value (US$ Mn) Forecast, by Application, 2018–2027
Table 96: Rest of Middle East & Africa Viscosity Index Improvers Market for Automotive Volume (Kilo Tons) Forecast, by Type, 2018–2027
Table 97: Rest of Middle East & Africa Viscosity Index Improvers Market for Automotive Value (US$ Mn) Forecast, by Type, 2018–2027
Table 98: Rest of Middle East & Africa Viscosity Index Improvers Market for Automotive Volume (Kilo Tons) Forecast, by Application, 2018–2027
Table 99: Rest of Middle East & Africa Viscosity Index Improvers Market for Automotive Value (US$ Mn) Forecast, by Application, 2018–2027
Table 100: Latin America Viscosity Index Improvers Market for Automotive Volume (Kilo Tons) Forecast, by Type, 2018–2027
Table 101: Latin America Viscosity Index Improvers Market for Automotive Value (US$ Mn) Forecast, by Type, 2018–2027
Table 102: Latin America Viscosity Index Improvers Market for Automotive Volume (Kilo Tons) Forecast, by Application, 2018–2027
Table 103: Latin America Viscosity Index Improvers Market for Automotive Value (US$ Mn) Forecast, by Application, 2018–2027
Table 104: Latin America Viscosity Index Improvers Market for Automotive Volume (Kilo Tons) Forecast, by Country and Sub-region, 2018–2027
Table 105: Latin America Viscosity Index Improvers Market for Automotive Value (US$ Mn) Forecast, by Country and Sub-region, 2018–2027
Table 106: Brazil Viscosity Index Improvers Market for Automotive Volume (Kilo Tons) Forecast, by Type, 2018–2027
Table 107: Brazil Viscosity Index Improvers Market for Automotive Value (US$ Mn) Forecast, by Type, 2018–2027
Table 108: Brazil Viscosity Index Improvers Market for Automotive Volume (Kilo Tons) Forecast, by Application, 2018–2027
Table 109: Brazil Viscosity Index Improvers Market for Automotive Value (US$ Mn) Forecast, by Application, 2018–2027
Table 110: Mexico Viscosity Index Improvers Market for Automotive Volume (Kilo Tons) Forecast, by Type, 2018–2027
Table 111: Mexico Viscosity Index Improvers Market for Automotive Value (US$ Mn) Forecast, by Type, 2018–2027
Table 112: Mexico Viscosity Index Improvers Market for Automotive Volume (Kilo Tons) Forecast, by Application, 2018–2027
Table 113: Mexico Viscosity Index Improvers Market for Automotive Value (US$ Mn) Forecast, by Application, 2018–2027
Table 114: Rest of Latin America Viscosity Index Improvers Market for Automotive Volume (Kilo Tons) Forecast, by Type, 2018–2027
Table 115: Rest of Latin America Viscosity Index Improvers Market for Automotive Value (US$ Mn) Forecast, by Type, 2018–2027
Table 116: Rest of Latin America Viscosity Index Improvers Market for Automotive Volume (Kilo Tons) Forecast, by Application, 2018–2027
Table 117: Rest of Latin America Viscosity Index Improvers Market for Automotive Value (US$ Mn) Forecast, by Application, 2018–2027
List of Figures
Figure 01: Global Viscosity Index Improvers Market for Automotive Value (US$ Mn) & Volume (Kilo Tons) Forecast, 2018-2027
Figure 02: Global Viscosity Index Improvers Market for Automotive Value Share Analysis, by Type, 2018 and 2027
Figure 03: Global Viscosity Index Improvers Market for Automotive Attractiveness Analysis, by Type, 2019-2027
Figure 04: Global Viscosity Index Improvers Market for Automotive Value Share Analysis, by Application, 2018 and 2027
Figure 05: Global Viscosity Index Improvers Market for Automotive Attractiveness Analysis, by Application, 2019-2027
Figure 06: Global Viscosity Index Improvers Market for Automotive Value Share Analysis, by Region, 2018 and 2027
Figure 07: Global Viscosity Index Improvers Market for Automotive Attractiveness Analysis, by Region, 2019-2027
Figure 08: North America Viscosity Index Improvers Market for Automotive Value Share Analysis, by Type, 2018 and 2027
Figure 09: North America Viscosity Index Improvers Market for Automotive Value Share Analysis, by Application, 2018 and 2027
Figure 10: North America Viscosity Index Improvers Market for Automotive Value Share Analysis, by Country, 2018 and 2027
Figure 11: North America Viscosity Index Improvers Market for Automotive Attractiveness Analysis, by Type, 2019-2027
Figure 12: North America Viscosity Index Improvers Market for Automotive Attractiveness Analysis by Application, 2019-2027
Figure 13: North America Viscosity Index Improvers Market for Automotive Attractiveness Analysis, by Country, 2019-2027
Figure 14: Europe Viscosity Index Improvers Market for Automotive Value Share Analysis, by Type, 2018 and 2027
Figure 15: Europe Viscosity Index Improvers Market for Automotive Value Share Analysis, by Application, 2018 and 2027
Figure 16: Europe Viscosity Index Improvers Market for Automotive Value Share Analysis, by Country and Sub-region, 2018 and 2027
Figure 17: Europe Viscosity Index Improvers Market for Automotive Value Share Analysis, by Type, 2019-2027
Figure 18: Europe Viscosity Index Improvers Market for Automotive Value Share Analysis, by Application, 2019-2027
Figure 19: Europe Viscosity Index Improvers Market for Automotive Attractiveness Analysis, by Country and Sub-region, 2019-2027
Figure 20: Asia Pacific Viscosity Index Improvers Market for Automotive Value Share Analysis, by Type, 2018 and 2027
Figure 21: Asia Pacific Viscosity Index Improvers Market for Automotive Value Share Analysis, by Application, 2018 and 2027
Figure 22: Asia Pacific Viscosity Index Improvers Market for Automotive Value Share Analysis, by Country and Sub-region, 2018 and 2027
Figure 23: Asia Pacific Viscosity Index Improvers Market for Automotive Attractiveness Analysis, by Type, 2018
Figure 24: Asia Pacific Viscosity Index Improvers Market for Automotive Attractiveness Analysis, by Application, 2018
Figure 25: Asia Pacific Viscosity Index Improvers Market for Automotive Attractiveness Analysis, by Country and Sub-region, 2018
Figure 26: Middle East & Africa Viscosity Index Improvers Market for Automotive Value Share Analysis, by Type, 2018 and 2027
Figure 27: MEA Viscosity Index Improvers Market for Automotive Value Share Analysis, by Application, 2018 and 2027
Figure 28: Middle East & Africa Viscosity Index Improvers Market for Automotive Value Share Analysis, by Country and Sub-region, 2018 and 2027
Figure 29: Middle East & Africa Viscosity Index Improvers Market for Automotive Attractiveness Analysis, by Type, 2019-2027
Figure 30: Middle East & Africa Viscosity Index Improvers Market for Automotive Attractiveness Analysis, by Application, 2019-2027
Figure 31: Middle East & Africa Viscosity Index Improvers Market for Automotive Attractiveness Analysis, by Country and Sub-region, 2019-2027
Figure 32: Latin America Viscosity Index Improvers Market for Automotive Value Share Analysis, by Type, 2018 and 2027
Figure 33: Latin America Viscosity Index Improvers Market for Automotive Value Share Analysis, by Application, 2018 and 2027
Figure 34: Latin America Viscosity Index Improvers Market for Automotive Value Share Analysis, by Country and Sub-region, 2018 and 2027
Figure 35: Latin America Viscosity Index Improvers Market for Automotive Attractiveness Analysis, by Type, 2019-2027
Figure 36: Latin America Viscosity Index Improvers Market for Automotive Attractiveness Analysis, by Application, 2019-2027
Figure 37: Latin America Viscosity Index Improvers Market for Automotive Attractiveness Analysis, by Country and Sub-region, 2019-2027
Copyright © Transparency Market Research, Inc. All Rights reserved
Trust Online

Automotive Viscosity Index Improvers Market (Forecast 2019 - 2027)