
Reports
Reports
Analysts’ Viewpoint on Market Scenario
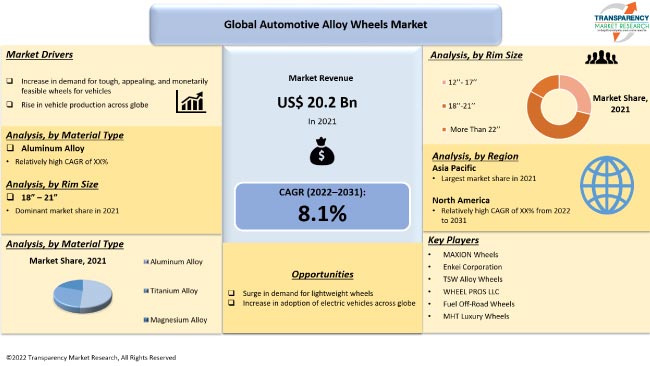
Increase in demand for lightweight vehicles from consumers across the globe is anticipated to increase the market value for automotive alloy wheels during the forecast period. Reduction of weight becomes a crucial requirement, as the amount of carbon dioxide emitted is proportionate to the size of the automobile and the amount of gasoline consumed. This has prompted several automakers to produce lightweight, cost-efficient, safe, and more environment-friendly vehicles.
Rapid urbanization, economic growth, and emergence of electric vehicles are key factors that are expected to accelerate market demand for automotive alloy wheels in the next few years. Alloy wheels are increasingly being preferred by consumers over factory-installed wheels due to their appealing appearance. Customization of vehicles is a current trend, which is likely to drive automotive alloy wheels business opportunities in the near future. However, high cost of wheels made of magnesium and aluminum alloys is expected to hamper market development during the forecast period.
Automotive wheels made from an alloy of aluminum or magnesium are known as alloy wheels. Metals and other elements are mixed to produce alloy wheels. Compared to pure metals, which are softer and more ductile, they often offer better strength. Aluminum alloy wheels are a popular choice for passenger cars due to their superior heat conductivity, anti-corrosive qualities, and weight advantage over steel wheels. Several manufacturers brand their products by molding their emblems into the rim. Market demand for automotive alloy wheels is expected to increase during the forecast period, owing to rise in spending power of customers and increase in the demand for lightweight vehicles across the globe.
Manufacturers are focusing on the manufacture of lightweight and fuel-efficient vehicles. Therefore, adoption of alloy wheels is crucial for automakers and suppliers around the globe. Steel wheels are heavier than alloy wheels, and their production is complex. Therefore, automakers are increasingly fitting alloy wheels to reduce weight and enhance fuel efficiency of their vehicles. Consequently, consumers are more likely to opt for vehicles with lightweight alloy wheels in the near future.
Vehicle production is rising at a rapid pace across the globe. Increase in demand for lightweight alloy wheels and rims in developing countries such as India, China, Brazil, and Mexico is projected to augment the automotive alloy wheels market size in the next few years. Furthermore, rise in implementation of emission standards in these nations is also expected to boost the demand for alloy wheels.
Popularity of electric cars is increasing across the globe. An electric vehicle must be lightweight to optimize the battery range. Electric cars are fitted with alloy wheels, as they help reduce the overall weight of the vehicle. Therefore, increase in electric car sales is likely to further boost the market demand for automotive alloy wheels in the near future.
Rise in disposable income of consumers and recovery of the world economy are major factors driving the demand for smart car alloy mag wheels. Wheel manufacturers are focusing on producing esthetically pleasing wheels due to rise in demand from consumers. Use of alloys enables the manufacture or fabrication of sophisticated designs and complex shapes. Rise in competition among automakers to produce tough and attractive wheels for vehicles is likely to fuel market development in the near future.
Alloy wheels have changed from being just a technical component to a stylish accent that enhances the vehicle's brand. The automotive alloy wheels industry is anticipated to grow during the forecast period due to the rise in market demand for automotive alloy wheels among young consumers.
In terms of material type, market segmentation comprises aluminum alloy, titanium alloy, and magnesium alloy. The aluminum alloy segment held 55.2% share in 2021. It is likely to dominate the global market during the forecast period.
Aluminum and nickel are combined to make aluminum alloy wheels. Most wheels currently are made of cast aluminum alloy, which means that molten aluminum is poured into a mold to make wheels. These wheels are more attractive than steel wheels. They are light in weight and strong. Additionally, aluminum is a highly adaptable material that offers several benefits. It is flexible and possesses high corrosion resistance, as well as strong electrical and thermal conductivity. Therefore, aluminum alloy wheels are expected to witness high demand globally during the forecast period.
Based on rim size, the automotive alloy wheels market has been segmented into 12”- 17”, 18”- 21”, and more than 22”. According to the automotive alloy wheels market forecast report, the 18”-21” segment is expected to account for 54.2% share and grow at a CAGR of more than 8.3% by the end of the forecast period.
The top 30 selling vehicles worldwide are dominated by SUVs and pickup trucks. These vehicles have larger rims than sedans and hatchbacks. Most SUVs and pickup trucks start out with 18" rims and increase to 21" in size. 18"- 21" inch wheels are more prevalent in the U.S. market; however, 17" and 18"-inch wheels are standard in top-selling passenger cars in Europe. Therefore, demand for 18"- 21" rime-sized wheels is increasing across the globe. Additionally, ongoing premiumization trend in India is likely to offer significant business opportunities for automotive alloy wheels manufacturers in the near future.
The automotive alloy wheel market size in Asia Pacific is estimated to grow at a rapid pace in the near future due to the expansion of the automotive sector and rise in living standards, particularly in nations such as Japan, China, and India. Moreover, market expansion in the region is anticipated to be aided by the lucrative presence of two-wheeler manufacturers in the region.
North America is anticipated to hold significant market share during the forecast period due to the increase in popularity of alloy wheels in the region. High spending incomes of consumers in the U.S. and Canada is another factor anticipated to boost market progress during the projection period.
The automotive alloy wheel market in Europe is anticipated to expand considerably in the next few years, owing to the presence of prominent automakers in the region. The alloy wheel industry in Middle East & Africa is estimated to grow at a moderate pace in the near future.
The global market is consolidated, with a large number of manufacturers controlling the market share. Major companies have started adopting new technologies to increase the market value for automotive alloy wheels. Important strategies adopted by leading players include mergers, acquisitions, and expansion of product portfolios. Automotive alloy wheels market forecast report highlights major drives, market opportunities, leading regions, etc.
MAXION Wheels, BORBET GmbH, Enkei Corporation, MHT Luxury Wheels, RONAL GROUP, Stamford Sport Wheels, Superior Industries International, Inc., TSW Alloy Wheels, Fuel Off-Road Wheels, CITIC Dicastal Wheel Manufacturing Co, WHEELPROS LLC, and Alcoa Wheels are some of the prominent players operating in the market.
Key players profiled in the automotive alloy wheels business report are based on parameters such as product portfolio, company overview, financial overview, business segments, business strategies, and recent developments.
|
Attribute |
Detail |
|
Market Size Value in 2021 |
US$ 20.2 Bn |
|
Market Forecast Value in 2031 |
US$ 44.2 Bn |
|
Growth Rate (CAGR) |
8.1% |
|
Forecast Period |
2022–2031 |
|
Historical Data Available for |
2017–2021 |
|
Quantitative Units |
US$ Bn for Value and Thousand Units for Volume |
|
Market Analysis |
It includes cross segment analysis at global as well as regional level. Furthermore, qualitative analysis includes drivers, restraints, opportunities, key trends, Porter’s Five Forces analysis, value chain analysis, and key trend analysis. |
|
Competition Landscape |
|
|
Format |
Electronic (PDF) + Excel |
|
Automotive Alloy Wheels Market Segmentation |
|
|
Regions Covered |
|
|
Countries Covered |
|
|
Companies Profile |
|
|
Customization Scope |
Available upon request |
|
Pricing |
Available upon request |
It was valued at US$ 20.2 Bn in 2021.
It is expected to advance at a CAGR of 8.1% by 2031.
It is likely to be valued at US$ 44.2 Bn by 2031.
Increase in demand for tough, appealing, and cost-effective wheels for vehicles and rise in vehicle production across the globe.
The aluminum alloy segment accounted for 55.2% share in 2021.
Asia Pacific is a highly lucrative region in the market.
MAXION Wheels, BORBET GmbH, Enkei Corporation, MHT Luxury Wheels, RONAL GROUP, Stamford Sport Wheels, Superior Industries International, Inc., TSW Alloy Wheels, Fuel Off-Road Wheels, CITIC Dicastal Wheel Manufacturing Co, WHEELPROS LLC, and Alcoa Wheels.
1. Executive Summary
1.1. Global Market Outlook
1.1.1. Market Volume (Thousand Units) and Value (US$ Bn), 2017-2031
1.2. Competitive Dashboard Analysis
1.3. Who Supplies Whom
1.3.1. List of Raw Material Supplier à Automotive Alloy Wheels Manufacturer à Vehicle Manufacturer (OEM)
2. Market Overview
2.1. TMR Analysis and Recommendations
2.2. Market Coverage / Taxonomy
2.3. Market Definition / Scope / Limitations
2.4. Macro-Economic Factors
2.5. Market Dynamics
2.5.1. Drivers
2.5.2. Restraints
2.5.3. Opportunity
2.6. Market Factor Analysis
2.6.1. Porter’s Five Force Analysis
2.6.2. SWOT Analysis
2.6.3. Value Chain Analysis
2.7. Regulatory Scenario
2.8. Key Trend Analysis
2.9. Cost Structure Analysis
2.10. Profit Margin Analysis
3. COVID-19 Impact Analysis – Automotive Alloy Wheels
4. Global Automotive Alloy Wheels Market, By Vehicle Type
4.1. Market Snapshot
4.1.1. Introduction, Definition, and Key Findings
4.1.2. Market Growth & Y-o-Y Projections
4.1.3. Base Point Share Analysis
4.2. Global Automotive Alloy Wheels Market Size Analysis & Forecast, 2017-2031, By Vehicle Type
4.2.1. Two Wheeler
4.2.2. Passenger Vehicle
4.2.2.1. Hatchback
4.2.2.2. Sedan
4.2.2.3. Utility Vehicle
4.2.3. Light Commercial Vehicle
4.2.4. Truck
4.2.5. Bus & Coach
5. Global Automotive Alloy Wheels Market, By Finishing Type
5.1. Market Snapshot
5.1.1. Introduction, Definition, and Key Findings
5.1.2. Market Growth & Y-o-Y Projections
5.1.3. Base Point Share Analysis
5.2. Global Automotive Alloy Wheels Market Size Analysis & Forecast, 2017-2031, By Finishing Type
5.2.1. Powder Coated/Painted Lacquered
5.2.2. Diamond Cut
5.2.3. Spilt Wheel
5.2.4. Chrome Wheel
5.2.5. Anodized
5.2.6. Others
6. Global Automotive Alloy Wheels Market, By Rim Size
6.1. Market Snapshot
6.1.1. Introduction, Definition, and Key Findings
6.1.2. Market Growth & Y-o-Y Projections
6.1.3. Base Point Share Analysis
6.2. Global Automotive Alloy Wheels Market Size Analysis & Forecast, 2017-2031, By Rim Size
6.2.1. 12’’- 17’’
6.2.2. 18’’-21’’
6.2.3. More Than 22’’
7. Global Automotive Alloy Wheels Market, By Material Type
7.1. Market Snapshot
7.1.1. Introduction, Definition, and Key Findings
7.1.2. Market Growth & Y-o-Y Projections
7.1.3. Base Point Share Analysis
7.2. Global Automotive Alloy Wheels Market Size Analysis & Forecast, 2017-2031, By Material Type
7.2.1. Aluminum Alloy
7.2.2. Titanium Alloy
7.2.3. Magnesium Alloy
8. Global Automotive Alloy Wheels Market, By Sales Channel
8.1. Market Snapshot
8.1.1. Introduction, Definition, and Key Findings
8.1.2. Market Growth & Y-o-Y Projections
8.1.3. Base Point Share Analysis
8.2. Global Automotive Alloy Wheels Market Size Analysis & Forecast, 2017-2031, By Sales Channel
8.2.1. OEM
8.2.2. Aftermarket
9. Global Automotive Alloy Wheels Market, by Region
9.1. Market Snapshot
9.1.1. Introduction, Definition, and Key Findings
9.1.2. Market Growth & Y-o-Y Projections
9.1.3. Base Point Share Analysis
9.2. Global Automotive Alloy Wheels Market Size Analysis & Forecast, 2017-2031, By Region
9.2.1. North America
9.2.2. Europe
9.2.3. Asia Pacific
9.2.4. Middle East & Africa
9.2.5. South America
10. North America Automotive Alloy Wheels Market
10.1. Market Snapshot
10.2. Automotive Alloy Wheels Market Size Analysis & Forecast, 2017-2031, By Vehicle Type
10.2.1. Two Wheeler
10.2.2. Passenger Vehicle
10.2.2.1. Hatchback
10.2.2.2. Sedan
10.2.2.3. Utility Vehicle
10.2.3. Light Commercial Vehicle
10.2.4. Truck
10.2.5. Bus & Coach
10.3. Automotive Alloy Wheels Market Size Analysis & Forecast, 2017-2031, By Finishing Type
10.3.1. Powder Coated/Painted Lacquered
10.3.2. Diamond Cut
10.3.3. Spilt Wheel
10.3.4. Chrome Wheel
10.3.5. Anodized
10.3.6. Others
10.4. Automotive Alloy Wheels Market Size Analysis & Forecast, 2017-2031, By Rim Size
10.4.1. 12’’- 17’’
10.4.2. 18’’-21’’
10.4.3. More Than 22’’
10.5. Automotive Alloy Wheels Market Size Analysis & Forecast, 2017-2031, By Material Type
10.5.1. Aluminum Alloy
10.5.2. Titanium Alloy
10.5.3. Magnesium Alloy
10.6. Automotive Alloy Wheels Market Size Analysis & Forecast, 2017-2031, By Sales Channel
10.6.1. OEM
10.6.2. Aftermarket
10.7. Key Country Analysis – North America Automotive Alloy Wheels Market Size Analysis & Forecast, 2017-2031
10.7.1. U.S.
10.7.2. Canada
10.7.3. Mexico
11. Europe Automotive Alloy Wheels Market
11.1. Market Snapshot
11.2. Automotive Alloy Wheels Market Size Analysis & Forecast, 2017-2031, By Vehicle Type
11.2.1. Two Wheeler
11.2.2. Passenger Vehicle
11.2.2.1. Hatchback
11.2.2.2. Sedan
11.2.2.3. Utility Vehicle
11.2.3. Light Commercial Vehicle
11.2.4. Truck
11.2.5. Bus & Coach
11.3. Automotive Alloy Wheels Market Size Analysis & Forecast, 2017-2031, By Finishing Type
11.3.1. Powder Coated/Painted Lacquered
11.3.2. Diamond Cut
11.3.3. Spilt Wheel
11.3.4. Chrome Wheel
11.3.5. Anodized
11.3.6. Others
11.4. Automotive Alloy Wheels Market Size Analysis & Forecast, 2017-2031, By Rim Size
11.4.1. 12’’- 17’’
11.4.2. 18’’-21’’
11.4.3. More Than 22’’
11.5. Automotive Alloy Wheels Market Size Analysis & Forecast, 2017-2031, By Material Type
11.5.1. Aluminum Alloy
11.5.2. Titanium Alloy
11.5.3. Magnesium Alloy
11.6. Automotive Alloy Wheels Market Size Analysis & Forecast, 2017-2031, By Sales Channel
11.6.1. OEM
11.6.2. Aftermarket
11.7. Key Country Analysis – Europe Automotive Alloy Wheels Market Size Analysis & Forecast, 2017-2031
11.7.1. Germany
11.7.2. U. K.
11.7.3. France
11.7.4. Italy
11.7.5. Spain
11.7.6. Nordic Countries
11.7.7. Russia & CIS
11.7.8. Rest of Europe
12. Asia Pacific Automotive Alloy Wheels Market
12.1. Market Snapshot
12.2. Automotive Alloy Wheels Market Size Analysis & Forecast, 2017-2031, By Vehicle Type
12.2.1. Two Wheeler
12.2.2. Passenger Vehicle
12.2.2.1. Hatchback
12.2.2.2. Sedan
12.2.2.3. Utility Vehicle
12.2.3. Light Commercial Vehicle
12.2.4. Truck
12.2.5. Bus & Coach
12.3. Automotive Alloy Wheels Market Size Analysis & Forecast, 2017-2031, By Finishing Type
12.3.1. Powder Coated/Painted Lacquered
12.3.2. Diamond Cut
12.3.3. Spilt Wheel
12.3.4. Chrome Wheel
12.3.5. Anodized
12.3.6. Others
12.4. Automotive Alloy Wheels Market Size Analysis & Forecast, 2017-2031, By Rim Size
12.4.1. 12’’- 17’’
12.4.2. 18’’-21’’
12.4.3. More Than 22’’
12.5. Automotive Alloy Wheels Market Size Analysis & Forecast, 2017-2031, By Material Type
12.5.1. Aluminum Alloy
12.5.2. Titanium Alloy
12.5.3. Magnesium Alloy
12.6. Automotive Alloy Wheels Market Size Analysis & Forecast, 2017-2031, By Sales Channel
12.6.1. OEM
12.6.2. Aftermarket
12.7. Key Country Analysis – Asia Pacific Automotive Alloy Wheels Market Size Analysis & Forecast, 2017-2031
12.7.1. China
12.7.2. India
12.7.3. Japan
12.7.4. ASEAN Countries
12.7.5. South Korea
12.7.6. ANZ
12.7.7. Rest of Asia Pacific
13. Middle East & Africa Automotive Alloy Wheels Market
13.1. Market Snapshot
13.2. Automotive Alloy Wheels Market Size Analysis & Forecast, 2017-2031, By Vehicle Type
13.2.1. Two Wheeler
13.2.2. Passenger Vehicle
13.2.2.1. Hatchback
13.2.2.2. Sedan
13.2.2.3. Utility Vehicle
13.2.3. Light Commercial Vehicle
13.2.4. Truck
13.2.5. Bus & Coach
13.3. Automotive Alloy Wheels Market Size Analysis & Forecast, 2017-2031, By Finishing Type
13.3.1. Powder Coated/Painted Lacquered
13.3.2. Diamond Cut
13.3.3. Spilt Wheel
13.3.4. Chrome Wheel
13.3.5. Anodized
13.3.6. Others
13.4. Automotive Alloy Wheels Market Size Analysis & Forecast, 2017-2031, By Rim Size
13.4.1. 12’’- 17’’
13.4.2. 18’’-21’’
13.4.3. More Than 22’’
13.5. Automotive Alloy Wheels Market Size Analysis & Forecast, 2017-2031, By Material Type
13.5.1. Aluminum Alloy
13.5.2. Titanium Alloy
13.5.3. Magnesium Alloy
13.6. Automotive Alloy Wheels Market Size Analysis & Forecast, 2017-2031, By Sales Channel
13.6.1. OEM
13.6.2. Aftermarket
13.7. Key Country Analysis – Middle East & Africa Automotive Alloy Wheels Market Size Analysis & Forecast, 2017-2031
13.7.1. GCC
13.7.2. South Africa
13.7.3. Turkey
13.7.4. Rest of Middle East & Africa
14. South America Automotive Alloy Wheels Market
14.1. Market Snapshot
14.2. Automotive Alloy Wheels Market Size Analysis & Forecast, 2017-2031, By Vehicle Type
14.2.1. Two Wheeler
14.2.2. Passenger Vehicle
14.2.2.1. Hatchback
14.2.2.2. Sedan
14.2.2.3. Utility Vehicle
14.2.3. Light Commercial Vehicle
14.2.4. Truck
14.2.5. Bus & Coach
14.3. Automotive Alloy Wheels Market Size Analysis & Forecast, 2017-2031, By Finishing Type
14.3.1. Powder Coated/Painted Lacquered
14.3.2. Diamond Cut
14.3.3. Spilt Wheel
14.3.4. Chrome Wheel
14.3.5. Anodized
14.3.6. Others
14.4. Automotive Alloy Wheels Market Size Analysis & Forecast, 2017-2031, By Rim Size
14.4.1. 12’’- 17’’
14.4.2. 18’’-21’’
14.4.3. More Than 22’’
14.5. Automotive Alloy Wheels Market Size Analysis & Forecast, 2017-2031, By Material Type
14.5.1. Aluminum Alloy
14.5.2. Titanium Alloy
14.5.3. Magnesium Alloy
14.6. Automotive Alloy Wheels Market Size Analysis & Forecast, 2017-2031, By Sales Channel
14.6.1. OEM
14.6.2. Aftermarket
14.7. Key Country Analysis – South America Automotive Alloy Wheels Market Size Analysis & Forecast, 2017-2031
14.7.1. Brazil
14.7.2. Argentina
14.7.3. Rest of South America
15. Competitive Landscape
15.1. Company Share Analysis/ Brand Share Analysis, 2021
15.2. Pricing comparison among key players
15.3. Company Analysis for each player (Company Overview, Company Footprints, Production Locations, Product Portfolio, Competitors & Customers, Subsidiaries & Parent Organization, Recent Developments, Financial Analysis, Profitability, Revenue Share)
16. Company Profile/ Key Players
16.1.1. Alcoa Wheels
16.1.1.1. Company Overview
16.1.1.2. Company Footprints
16.1.1.3. Production Locations
16.1.1.4. Product Portfolio
16.1.1.5. Competitors & Customers
16.1.1.6. Subsidiaries & Parent Organization
16.1.1.7. Recent Developments
16.1.1.8. Financial Analysis
16.1.1.9. Profitability
16.1.1.10. Revenue Share
16.1.2. ARCONIC
16.1.2.1. Company Overview
16.1.2.2. Company Footprints
16.1.2.3. Production Locations
16.1.2.4. Product Portfolio
16.1.2.5. Competitors & Customers
16.1.2.6. Subsidiaries & Parent Organization
16.1.2.7. Recent Developments
16.1.2.8. Financial Analysis
16.1.2.9. Profitability
16.1.2.10. Revenue Share
16.1.3. BBS GmbH
16.1.3.1. Company Overview
16.1.3.2. Company Footprints
16.1.3.3. Production Locations
16.1.3.4. Product Portfolio
16.1.3.5. Competitors & Customers
16.1.3.6. Subsidiaries & Parent Organization
16.1.3.7. Recent Developments
16.1.3.8. Financial Analysis
16.1.3.9. Profitability
16.1.3.10. Revenue Share
16.1.4. BORBET GmbH
16.1.4.1. Company Overview
16.1.4.2. Company Footprints
16.1.4.3. Production Locations
16.1.4.4. Product Portfolio
16.1.4.5. Competitors & Customers
16.1.4.6. Subsidiaries & Parent Organization
16.1.4.7. Recent Developments
16.1.4.8. Financial Analysis
16.1.4.9. Profitability
16.1.4.10. Revenue Share
16.1.5. CITIC Dicastal Wheel Manufacturing Co
16.1.5.1. Company Overview
16.1.5.2. Company Footprints
16.1.5.3. Production Locations
16.1.5.4. Product Portfolio
16.1.5.5. Competitors & Customers
16.1.5.6. Subsidiaries & Parent Organization
16.1.5.7. Recent Developments
16.1.5.8. Financial Analysis
16.1.5.9. Profitability
16.1.5.10. Revenue Share
16.1.6. Enkei Corporation
16.1.6.1. Company Overview
16.1.6.2. Company Footprints
16.1.6.3. Production Locations
16.1.6.4. Product Portfolio
16.1.6.5. Competitors & Customers
16.1.6.6. Subsidiaries & Parent Organization
16.1.6.7. Recent Developments
16.1.6.8. Financial Analysis
16.1.6.9. Profitability
16.1.6.10. Revenue Share
16.1.7. Foshan Nanhai Zhongnan Aluminum Wheel Co., Ltd.
16.1.7.1. Company Overview
16.1.7.2. Company Footprints
16.1.7.3. Production Locations
16.1.7.4. Product Portfolio
16.1.7.5. Competitors & Customers
16.1.7.6. Subsidiaries & Parent Organization
16.1.7.7. Recent Developments
16.1.7.8. Financial Analysis
16.1.7.9. Profitability
16.1.7.10. Revenue Share
16.1.8. Fuel Off-Road Wheels
16.1.8.1. Company Overview
16.1.8.2. Company Footprints
16.1.8.3. Production Locations
16.1.8.4. Product Portfolio
16.1.8.5. Competitors & Customers
16.1.8.6. Subsidiaries & Parent Organization
16.1.8.7. Recent Developments
16.1.8.8. Financial Analysis
16.1.8.9. Profitability
16.1.8.10. Revenue Share
16.1.9. Japan Wheels
16.1.9.1. Company Overview
16.1.9.2. Company Footprints
16.1.9.3. Production Locations
16.1.9.4. Product Portfolio
16.1.9.5. Competitors & Customers
16.1.9.6. Subsidiaries & Parent Organization
16.1.9.7. Recent Developments
16.1.9.8. Financial Analysis
16.1.9.9. Profitability
16.1.9.10. Revenue Share
16.1.10. Kawashima Group Co., Ltd.
16.1.10.1. Company Overview
16.1.10.2. Company Footprints
16.1.10.3. Production Locations
16.1.10.4. Product Portfolio
16.1.10.5. Competitors & Customers
16.1.10.6. Subsidiaries & Parent Organization
16.1.10.7. Recent Developments
16.1.10.8. Financial Analysis
16.1.10.9. Profitability
16.1.10.10. Revenue Share
16.1.11. Kosei Aluminum Co., Ltd.
16.1.11.1. Company Overview
16.1.11.2. Company Footprints
16.1.11.3. Production Locations
16.1.11.4. Product Portfolio
16.1.11.5. Competitors & Customers
16.1.11.6. Subsidiaries & Parent Organization
16.1.11.7. Recent Developments
16.1.11.8. Financial Analysis
16.1.11.9. Profitability
16.1.11.10. Revenue Share
16.1.12. MAXION Wheels
16.1.12.1. Company Overview
16.1.12.2. Company Footprints
16.1.12.3. Production Locations
16.1.12.4. Product Portfolio
16.1.12.5. Competitors & Customers
16.1.12.6. Subsidiaries & Parent Organization
16.1.12.7. Recent Developments
16.1.12.8. Financial Analysis
16.1.12.9. Profitability
16.1.12.10. Revenue Share
16.1.13. MHT Luxury Wheels
16.1.13.1. Company Overview
16.1.13.2. Company Footprints
16.1.13.3. Production Locations
16.1.13.4. Product Portfolio
16.1.13.5. Competitors & Customers
16.1.13.6. Subsidiaries & Parent Organization
16.1.13.7. Recent Developments
16.1.13.8. Financial Analysis
16.1.13.9. Profitability
16.1.13.10. Revenue Share
16.1.14. NAPREJAPAN
16.1.14.1. Company Overview
16.1.14.2. Company Footprints
16.1.14.3. Production Locations
16.1.14.4. Product Portfolio
16.1.14.5. Competitors & Customers
16.1.14.6. Subsidiaries & Parent Organization
16.1.14.7. Recent Developments
16.1.14.8. Financial Analysis
16.1.14.9. Profitability
16.1.14.10. Revenue Share
16.1.15. RAYS Co., Ltd.
16.1.15.1. Company Overview
16.1.15.2. Company Footprints
16.1.15.3. Production Locations
16.1.15.4. Product Portfolio
16.1.15.5. Competitors & Customers
16.1.15.6. Subsidiaries & Parent Organization
16.1.15.7. Recent Developments
16.1.15.8. Financial Analysis
16.1.15.9. Profitability
16.1.15.10. Revenue Share
16.1.16. RONAL GROUP
16.1.16.1. Company Overview
16.1.16.2. Company Footprints
16.1.16.3. Production Locations
16.1.16.4. Product Portfolio
16.1.16.5. Competitors & Customers
16.1.16.6. Subsidiaries & Parent Organization
16.1.16.7. Recent Developments
16.1.16.8. Financial Analysis
16.1.16.9. Profitability
16.1.16.10. Revenue Share
16.1.17. Stamford Sport Wheels
16.1.17.1. Company Overview
16.1.17.2. Company Footprints
16.1.17.3. Production Locations
16.1.17.4. Product Portfolio
16.1.17.5. Competitors & Customers
16.1.17.6. Subsidiaries & Parent Organization
16.1.17.7. Recent Developments
16.1.17.8. Financial Analysis
16.1.17.9. Profitability
16.1.17.10. Revenue Share
16.1.18. Status Wheels
16.1.18.1. Company Overview
16.1.18.2. Company Footprints
16.1.18.3. Production Locations
16.1.18.4. Product Portfolio
16.1.18.5. Competitors & Customers
16.1.18.6. Subsidiaries & Parent Organization
16.1.18.7. Recent Developments
16.1.18.8. Financial Analysis
16.1.18.9. Profitability
16.1.18.10. Revenue Share
16.1.19. Superior Industries International, Inc.
16.1.19.1. Company Overview
16.1.19.2. Company Footprints
16.1.19.3. Production Locations
16.1.19.4. Product Portfolio
16.1.19.5. Competitors & Customers
16.1.19.6. Subsidiaries & Parent Organization
16.1.19.7. Recent Developments
16.1.19.8. Financial Analysis
16.1.19.9. Profitability
16.1.19.10. Revenue Share
16.1.20. Tan-ei-sya
16.1.20.1. Company Overview
16.1.20.2. Company Footprints
16.1.20.3. Production Locations
16.1.20.4. Product Portfolio
16.1.20.5. Competitors & Customers
16.1.20.6. Subsidiaries & Parent Organization
16.1.20.7. Recent Developments
16.1.20.8. Financial Analysis
16.1.20.9. Profitability
16.1.20.10. Revenue Share
16.1.21. TOPY INDUSTRIES LIMITED
16.1.21.1. Company Overview
16.1.21.2. Company Footprints
16.1.21.3. Production Locations
16.1.21.4. Product Portfolio
16.1.21.5. Competitors & Customers
16.1.21.6. Subsidiaries & Parent Organization
16.1.21.7. Recent Developments
16.1.21.8. Financial Analysis
16.1.21.9. Profitability
16.1.21.10. Revenue Share
16.1.22. TSW Alloy Wheels
16.1.22.1. Company Overview
16.1.22.2. Company Footprints
16.1.22.3. Production Locations
16.1.22.4. Product Portfolio
16.1.22.5. Competitors & Customers
16.1.22.6. Subsidiaries & Parent Organization
16.1.22.7. Recent Developments
16.1.22.8. Financial Analysis
16.1.22.9. Profitability
16.1.22.10. Revenue Share
16.1.23. Washi Beam
16.1.23.1. Company Overview
16.1.23.2. Company Footprints
16.1.23.3. Production Locations
16.1.23.4. Product Portfolio
16.1.23.5. Competitors & Customers
16.1.23.6. Subsidiaries & Parent Organization
16.1.23.7. Recent Developments
16.1.23.8. Financial Analysis
16.1.23.9. Profitability
16.1.23.10. Revenue Share
16.1.24. WHEELPROS LLC
16.1.24.1. Company Overview
16.1.24.2. Company Footprints
16.1.24.3. Production Locations
16.1.24.4. Product Portfolio
16.1.24.5. Competitors & Customers
16.1.24.6. Subsidiaries & Parent Organization
16.1.24.7. Recent Developments
16.1.24.8. Financial Analysis
16.1.24.9. Profitability
16.1.24.10. Revenue Share
List of Tables
Table 1: Global Automotive Alloy Wheels Market Volume (Thousand Units) Forecast, by Vehicle Type, 2017-2031
Table 2: Global Automotive Alloy Wheels Market Value (US$ Bn) Forecast, by Vehicle Type, 2017‒2031
Table 3: Global Automotive Alloy Wheels Market Volume (Thousand Units) Forecast, by Finishing Type, 2017-2031
Table 4: Global Automotive Alloy Wheels Market Value (US$ Bn) Forecast, by Finishing Type, 2017‒2031
Table 5: Global Automotive Alloy Wheels Market Volume (Thousand Units) Forecast, by Rim Size, 2017-2031
Table 6: Global Automotive Alloy Wheels Market Value (US$ Bn) Forecast, by Rim Size, 2017‒2031
Table 7: Global Automotive Alloy Wheels Market Volume (Thousand Units) Forecast, by Material Type, 2017-2031
Table 8: Global Automotive Alloy Wheels Market Value (US$ Bn) Forecast, by Material Type, 2017‒2031
Table 9: Global Automotive Alloy Wheels Market Volume (Thousand Units) Forecast, by Sales Channel, 2017-2031
Table 10: Global Automotive Alloy Wheels Market Value (US$ Bn) Forecast, by Sales Channel, 2017‒2031
Table 11: Global Automotive Alloy Wheels Market Volume (Thousand Units) Forecast, by Region, 2017-2031
Table 12: Global Automotive Alloy Wheels Market Value (US$ Bn) Forecast, by Region, 2017‒2031
Table 13: North America Automotive Alloy Wheels Market Volume (Thousand Units) Forecast, by Vehicle Type, 2017-2031
Table 14: North America Automotive Alloy Wheels Market Value (US$ Bn) Forecast, by Vehicle Type, 2017‒2031
Table 15: North America Automotive Alloy Wheels Market Volume (Thousand Units) Forecast, by Finishing Type, 2017-2031
Table 16: North America Automotive Alloy Wheels Market Value (US$ Bn) Forecast, by Finishing Type, 2017‒2031
Table 17: North America Automotive Alloy Wheels Market Volume (Thousand Units) Forecast, by Rim Size, 2017-2031
Table 18: North America Automotive Alloy Wheels Market Value (US$ Bn) Forecast, by Rim Size, 2017‒2031
Table 19: North America Automotive Alloy Wheels Market Volume (Thousand Units) Forecast, by Material Type, 2017-2031
Table 20: North America Automotive Alloy Wheels Market Value (US$ Bn) Forecast, by Material Type, 2017‒2031
Table 21: North America Automotive Alloy Wheels Market Volume (Thousand Units) Forecast, by Sales Channel, 2017-2031
Table 22: North America Automotive Alloy Wheels Market Value (US$ Bn) Forecast, by Sales Channel, 2017‒2031
Table 23: North America Automotive Alloy Wheels Market Volume (Thousand Units) Forecast, by Country, 2017-2031
Table 24: North America Automotive Alloy Wheels Market Value (US$ Bn) Forecast, by Country, 2017‒2031
Table 25: Europe Automotive Alloy Wheels Market Volume (Thousand Units) Forecast, by Vehicle Type, 2017-2031
Table 26: Europe Automotive Alloy Wheels Market Value (US$ Bn) Forecast, by Vehicle Type, 2017‒2031
Table 27: Europe Automotive Alloy Wheels Market Volume (Thousand Units) Forecast, by Finishing Type, 2017-2031
Table 28: Europe Automotive Alloy Wheels Market Value (US$ Bn) Forecast, by Finishing Type, 2017‒2031
Table 29: Europe Automotive Alloy Wheels Market Volume (Thousand Units) Forecast, by Rim Size, 2017-2031
Table 30: Europe Automotive Alloy Wheels Market Value (US$ Bn) Forecast, by Rim Size, 2017‒2031
Table 31: Europe Automotive Alloy Wheels Market Volume (Thousand Units) Forecast, by Material Type, 2017-2031
Table 32: Europe Automotive Alloy Wheels Market Value (US$ Bn) Forecast, by Material Type, 2017‒2031
Table 33: Europe Automotive Alloy Wheels Market Volume (Thousand Units) Forecast, by Sales Channel, 2017-2031
Table 34: Europe Automotive Alloy Wheels Market Value (US$ Bn) Forecast, by Sales Channel, 2017‒2031
Table 35: Europe Automotive Alloy Wheels Market Volume (Thousand Units) Forecast, by Country, 2017-2031
Table 36: Europe Automotive Alloy Wheels Market Value (US$ Bn) Forecast, by Country, 2017‒2031
Table 37: Asia Pacific Automotive Alloy Wheels Market Volume (Thousand Units) Forecast, by Vehicle Type, 2017-2031
Table 38: Asia Pacific Automotive Alloy Wheels Market Value (US$ Bn) Forecast, by Vehicle Type, 2017‒2031
Table 39: Asia Pacific Automotive Alloy Wheels Market Volume (Thousand Units) Forecast, by Finishing Type, 2017-2031
Table 40: Asia Pacific Automotive Alloy Wheels Market Value (US$ Bn) Forecast, by Finishing Type, 2017‒2031
Table 41: Asia Pacific Automotive Alloy Wheels Market Volume (Thousand Units) Forecast, by Rim Size, 2017-2031
Table 42: Asia Pacific Automotive Alloy Wheels Market Value (US$ Bn) Forecast, by Rim Size, 2017‒2031
Table 43: Asia Pacific Automotive Alloy Wheels Market Volume (Thousand Units) Forecast, by Material Type, 2017-2031
Table 44: Asia Pacific Automotive Alloy Wheels Market Value (US$ Bn) Forecast, by Material Type, 2017‒2031
Table 45: Asia Pacific Automotive Alloy Wheels Market Volume (Thousand Units) Forecast, by Sales Channel, 2017-2031
Table 46: Asia Pacific Automotive Alloy Wheels Market Value (US$ Bn) Forecast, by Sales Channel, 2017‒2031
Table 47: Asia Pacific Automotive Alloy Wheels Market Volume (Thousand Units) Forecast, by Country, 2017-2031
Table 48: Asia Pacific Automotive Alloy Wheels Market Value (US$ Bn) Forecast, by Country, 2017‒2031
Table 49: Middle East & Africa Automotive Alloy Wheels Market Volume (Thousand Units) Forecast, by Vehicle Type, 2017-2031
Table 50: Middle East & Africa Automotive Alloy Wheels Market Value (US$ Bn) Forecast, by Vehicle Type, 2017‒2031
Table 51: Middle East & Africa Automotive Alloy Wheels Market Volume (Thousand Units) Forecast, by Finishing Type, 2017-2031
Table 52: Middle East & Africa Automotive Alloy Wheels Market Value (US$ Bn) Forecast, by Finishing Type, 2017‒2031
Table 53: Middle East & Africa Automotive Alloy Wheels Market Volume (Thousand Units) Forecast, by Rim Size, 2017-2031
Table 54: Middle East & Africa Automotive Alloy Wheels Market Value (US$ Bn) Forecast, by Rim Size, 2017‒2031
Table 55: Middle East & Africa Automotive Alloy Wheels Market Volume (Thousand Units) Forecast, by Material Type, 2017-2031
Table 56: Middle East & Africa Automotive Alloy Wheels Market Value (US$ Bn) Forecast, by Material Type, 2017‒2031
Table 57: Middle East & Africa Automotive Alloy Wheels Market Volume (Thousand Units) Forecast, by Sales Channel, 2017-2031
Table 58: Middle East & Africa Automotive Alloy Wheels Market Value (US$ Bn) Forecast, by Sales Channel, 2017‒2031
Table 59: Middle East & Africa Automotive Alloy Wheels Market Volume (Thousand Units) Forecast, by Country, 2017-2031
Table 60: Middle East & Africa Automotive Alloy Wheels Market Value (US$ Bn) Forecast, by Country, 2017‒2031
Table 61: South America Automotive Alloy Wheels Market Volume (Thousand Units) Forecast, by Vehicle Type, 2017-2031
Table 62: South America Automotive Alloy Wheels Market Value (US$ Bn) Forecast, by Vehicle Type, 2017‒2031
Table 63: South America Automotive Alloy Wheels Market Volume (Thousand Units) Forecast, by Finishing Type, 2017-2031
Table 64: South America Automotive Alloy Wheels Market Value (US$ Bn) Forecast, by Finishing Type, 2017‒2031
Table 65: South America Automotive Alloy Wheels Market Volume (Thousand Units) Forecast, by Rim Size, 2017-2031
Table 66: South America Automotive Alloy Wheels Market Value (US$ Bn) Forecast, by Rim Size, 2017‒2031
Table 67: South America Automotive Alloy Wheels Market Volume (Thousand Units) Forecast, by Material Type, 2017-2031
Table 68: South America Automotive Alloy Wheels Market Value (US$ Bn) Forecast, by Material Type, 2017‒2031
Table 69: South America Automotive Alloy Wheels Market Volume (Thousand Units) Forecast, by Sales Channel, 2017-2031
Table 70: South America Automotive Alloy Wheels Market Value (US$ Bn) Forecast, by Sales Channel, 2017‒2031
Table 71: South America Automotive Alloy Wheels Market Volume (Thousand Units) Forecast, by Country, 2017-2031
Table 72: South America Automotive Alloy Wheels Market Value (US$ Bn) Forecast, by Country, 2017‒2031
List of Figures
Figure 1: Global Automotive Alloy Wheels Market Volume (Thousand Units) Forecast, by Vehicle Type, 2017-2031
Figure 2: Global Automotive Alloy Wheels Market Value (US$ Bn) Forecast, by Vehicle Type, 2017-2031
Figure 3: Global Automotive Alloy Wheels Market, Incremental Opportunity, by Vehicle Type, Value (US$ Bn), 2022-2031
Figure 4: Global Automotive Alloy Wheels Market Volume (Thousand Units) Forecast, by Finishing Type, 2017-2031
Figure 5: Global Automotive Alloy Wheels Market Value (US$ Bn) Forecast, by Finishing Type, 2017-2031
Figure 6: Global Automotive Alloy Wheels Market, Incremental Opportunity, by Finishing Type, Value (US$ Bn), 2022-2031
Figure 7: Global Automotive Alloy Wheels Market Volume (Thousand Units) Forecast, by Rim Size, 2017-2031
Figure 8: Global Automotive Alloy Wheels Market Value (US$ Bn) Forecast, by Rim Size, 2017-2031
Figure 9: Global Automotive Alloy Wheels Market, Incremental Opportunity, by Rim Size, Value (US$ Bn), 2022-2031
Figure 10: Global Automotive Alloy Wheels Market Volume (Thousand Units) Forecast, by Material Type, 2017-2031
Figure 11: Global Automotive Alloy Wheels Market Value (US$ Bn) Forecast, by Material Type, 2017-2031
Figure 12: Global Automotive Alloy Wheels Market, Incremental Opportunity, by Material Type, Value (US$ Bn), 2022-2031
Figure 13: Global Automotive Alloy Wheels Market Volume (Thousand Units) Forecast, by Sales Channel, 2017-2031
Figure 14: Global Automotive Alloy Wheels Market Value (US$ Bn) Forecast, by Sales Channel, 2017-2031
Figure 15: Global Automotive Alloy Wheels Market, Incremental Opportunity, by Sales Channel, Value (US$ Bn), 2022-2031
Figure 16: Global Automotive Alloy Wheels Market Volume (Thousand Units) Forecast, by Region, 2017-2031
Figure 17: Global Automotive Alloy Wheels Market Value (US$ Bn) Forecast, by Region, 2017-2031
Figure 18: Global Automotive Alloy Wheels Market, Incremental Opportunity, by Region, Value (US$ Bn), 2022-2031
Figure 19: North America Automotive Alloy Wheels Market Volume (Thousand Units) Forecast, by Vehicle Type, 2017-2031
Figure 20: North America Automotive Alloy Wheels Market Value (US$ Bn) Forecast, by Vehicle Type, 2017-2031
Figure 21: North America Automotive Alloy Wheels Market, Incremental Opportunity, by Vehicle Type, Value (US$ Bn), 2022-2031
Figure 22: North America Automotive Alloy Wheels Market Volume (Thousand Units) Forecast, by Finishing Type, 2017-2031
Figure 23: North America Automotive Alloy Wheels Market Value (US$ Bn) Forecast, by Finishing Type, 2017-2031
Figure 24: North America Automotive Alloy Wheels Market, Incremental Opportunity, by Finishing Type, Value (US$ Bn), 2022-2031
Figure 25: North America Automotive Alloy Wheels Market Volume (Thousand Units) Forecast, by Rim Size, 2017-2031
Figure 26: North America Automotive Alloy Wheels Market Value (US$ Bn) Forecast, by Rim Size, 2017-2031
Figure 27: North America Automotive Alloy Wheels Market, Incremental Opportunity, by Rim Size, Value (US$ Bn), 2022-2031
Figure 28: North America Automotive Alloy Wheels Market Volume (Thousand Units) Forecast, by Material Type, 2017-2031
Figure 29: North America Automotive Alloy Wheels Market Value (US$ Bn) Forecast, by Material Type, 2017-2031
Figure 30: North America Automotive Alloy Wheels Market, Incremental Opportunity, by Material Type, Value (US$ Bn), 2022-2031
Figure 31: North America Automotive Alloy Wheels Market Volume (Thousand Units) Forecast, by Sales Channel, 2017-2031
Figure 32: North America Automotive Alloy Wheels Market Value (US$ Bn) Forecast, by Sales Channel, 2017-2031
Figure 33: North America Automotive Alloy Wheels Market, Incremental Opportunity, by Sales Channel, Value (US$ Bn), 2022-2031
Figure 34: North America Automotive Alloy Wheels Market Volume (Thousand Units) Forecast, by Country, 2017-2031
Figure 35: North America Automotive Alloy Wheels Market Value (US$ Bn) Forecast, by Country, 2017-2031
Figure 36: North America Automotive Alloy Wheels Market, Incremental Opportunity, by Country, Value (US$ Bn), 2022-2031
Figure 37: Europe Automotive Alloy Wheels Market Volume (Thousand Units) Forecast, by Vehicle Type, 2017-2031
Figure 38: Europe Automotive Alloy Wheels Market Value (US$ Bn) Forecast, by Vehicle Type, 2017-2031
Figure 39: Europe Automotive Alloy Wheels Market, Incremental Opportunity, by Vehicle Type, Value (US$ Bn), 2022-2031
Figure 40: Europe Automotive Alloy Wheels Market Volume (Thousand Units) Forecast, by Finishing Type, 2017-2031
Figure 41: Europe Automotive Alloy Wheels Market Value (US$ Bn) Forecast, by Finishing Type, 2017-2031
Figure 42: Europe Automotive Alloy Wheels Market, Incremental Opportunity, by Finishing Type, Value (US$ Bn), 2022-2031
Figure 43: Europe Automotive Alloy Wheels Market Volume (Thousand Units) Forecast, by Rim Size, 2017-2031
Figure 44: Europe Automotive Alloy Wheels Market Value (US$ Bn) Forecast, by Rim Size, 2017-2031
Figure 45: Europe Automotive Alloy Wheels Market, Incremental Opportunity, by Rim Size, Value (US$ Bn), 2022-2031
Figure 46: Europe Automotive Alloy Wheels Market Volume (Thousand Units) Forecast, by Material Type, 2017-2031
Figure 47: Europe Automotive Alloy Wheels Market Value (US$ Bn) Forecast, by Material Type, 2017-2031
Figure 48: Europe Automotive Alloy Wheels Market, Incremental Opportunity, by Material Type, Value (US$ Bn), 2022-2031
Figure 49: Europe Automotive Alloy Wheels Market Volume (Thousand Units) Forecast, by Sales Channel, 2017-2031
Figure 50: Europe Automotive Alloy Wheels Market Value (US$ Bn) Forecast, by Sales Channel, 2017-2031
Figure 51: Europe Automotive Alloy Wheels Market, Incremental Opportunity, by Sales Channel, Value (US$ Bn), 2022-2031
Figure 52: Europe Automotive Alloy Wheels Market Volume (Thousand Units) Forecast, by Country, 2017-2031
Figure 53: Europe Automotive Alloy Wheels Market Value (US$ Bn) Forecast, by Country, 2017-2031
Figure 54: Europe Automotive Alloy Wheels Market, Incremental Opportunity, by Country, Value (US$ Bn), 2022-2031
Figure 55: Asia Pacific Automotive Alloy Wheels Market Volume (Thousand Units) Forecast, by Vehicle Type, 2017-2031
Figure 56: Asia Pacific Automotive Alloy Wheels Market Value (US$ Bn) Forecast, by Vehicle Type, 2017-2031
Figure 57: Asia Pacific Automotive Alloy Wheels Market, Incremental Opportunity, by Vehicle Type, Value (US$ Bn), 2022-2031
Figure 58: Asia Pacific Automotive Alloy Wheels Market Volume (Thousand Units) Forecast, by Finishing Type, 2017-2031
Figure 59: Asia Pacific Automotive Alloy Wheels Market Value (US$ Bn) Forecast, by Finishing Type, 2017-2031
Figure 60: Asia Pacific Automotive Alloy Wheels Market, Incremental Opportunity, by Finishing Type, Value (US$ Bn), 2022-2031
Figure 61: Asia Pacific Automotive Alloy Wheels Market Volume (Thousand Units) Forecast, by Rim Size, 2017-2031
Figure 62: Asia Pacific Automotive Alloy Wheels Market Value (US$ Bn) Forecast, by Rim Size, 2017-2031
Figure 63: Asia Pacific Automotive Alloy Wheels Market, Incremental Opportunity, by Rim Size, Value (US$ Bn), 2022-2031
Figure 64: Asia Pacific Automotive Alloy Wheels Market Volume (Thousand Units) Forecast, by Material Type, 2017-2031
Figure 65: Asia Pacific Automotive Alloy Wheels Market Value (US$ Bn) Forecast, by Material Type, 2017-2031
Figure 66: Asia Pacific Automotive Alloy Wheels Market, Incremental Opportunity, by Material Type, Value (US$ Bn), 2022-2031
Figure 67: Asia Pacific Automotive Alloy Wheels Market Volume (Thousand Units) Forecast, by Sales Channel, 2017-2031
Figure 68: Asia Pacific Automotive Alloy Wheels Market Value (US$ Bn) Forecast, by Sales Channel, 2017-2031
Figure 69: Asia Pacific Automotive Alloy Wheels Market, Incremental Opportunity, by Sales Channel, Value (US$ Bn), 2022-2031
Figure 70: Asia Pacific Automotive Alloy Wheels Market Volume (Thousand Units) Forecast, by Country, 2017-2031
Figure 71: Asia Pacific Automotive Alloy Wheels Market Value (US$ Bn) Forecast, by Country, 2017-2031
Figure 72: Asia Pacific Automotive Alloy Wheels Market, Incremental Opportunity, by Country, Value (US$ Bn), 2022-2031
Figure 73: Middle East & Africa Automotive Alloy Wheels Market Volume (Thousand Units) Forecast, by Vehicle Type, 2017-2031
Figure 74: Middle East & Africa Automotive Alloy Wheels Market Value (US$ Bn) Forecast, by Vehicle Type, 2017-2031
Figure 75: Middle East & Africa Automotive Alloy Wheels Market, Incremental Opportunity, by Vehicle Type, Value (US$ Bn), 2022-2031
Figure 76: Middle East & Africa Automotive Alloy Wheels Market Volume (Thousand Units) Forecast, by Finishing Type, 2017-2031
Figure 77: Middle East & Africa Automotive Alloy Wheels Market Value (US$ Bn) Forecast, by Finishing Type, 2017-2031
Figure 78: Middle East & Africa Automotive Alloy Wheels Market, Incremental Opportunity, by Finishing Type, Value (US$ Bn), 2022-2031
Figure 79: Middle East & Africa Automotive Alloy Wheels Market Volume (Thousand Units) Forecast, by Rim Size, 2017-2031
Figure 80: Middle East & Africa Automotive Alloy Wheels Market Value (US$ Bn) Forecast, by Rim Size, 2017-2031
Figure 81: Middle East & Africa Automotive Alloy Wheels Market, Incremental Opportunity, by Rim Size, Value (US$ Bn), 2022-2031
Figure 82: Middle East & Africa Automotive Alloy Wheels Market Volume (Thousand Units) Forecast, by Material Type, 2017-2031
Figure 83: Middle East & Africa Automotive Alloy Wheels Market Value (US$ Bn) Forecast, by Material Type, 2017-2031
Figure 84: Middle East & Africa Automotive Alloy Wheels Market, Incremental Opportunity, by Material Type, Value (US$ Bn), 2022-2031
Figure 85: Middle East & Africa Automotive Alloy Wheels Market Volume (Thousand Units) Forecast, by Sales Channel, 2017-2031
Figure 86: Middle East & Africa Automotive Alloy Wheels Market Value (US$ Bn) Forecast, by Sales Channel, 2017-2031
Figure 87: Middle East & Africa Automotive Alloy Wheels Market, Incremental Opportunity, by Sales Channel, Value (US$ Bn), 2022-2031
Figure 88: Middle East & Africa Automotive Alloy Wheels Market Volume (Thousand Units) Forecast, by Country, 2017-2031
Figure 89: Middle East & Africa Automotive Alloy Wheels Market Value (US$ Bn) Forecast, by Country, 2017-2031
Figure 90: Middle East & Africa Automotive Alloy Wheels Market, Incremental Opportunity, by Country, Value (US$ Bn), 2022-2031
Figure 91: South America Automotive Alloy Wheels Market Volume (Thousand Units) Forecast, by Vehicle Type, 2017-2031
Figure 92: South America Automotive Alloy Wheels Market Value (US$ Bn) Forecast, by Vehicle Type, 2017-2031
Figure 93: South America Automotive Alloy Wheels Market, Incremental Opportunity, by Vehicle Type, Value (US$ Bn), 2022-2031
Figure 94: South America Automotive Alloy Wheels Market Volume (Thousand Units) Forecast, by Finishing Type, 2017-2031
Figure 95: South America Automotive Alloy Wheels Market Value (US$ Bn) Forecast, by Finishing Type, 2017-2031
Figure 96: South America Automotive Alloy Wheels Market, Incremental Opportunity, by Finishing Type, Value (US$ Bn), 2022-2031
Figure 97: South America Automotive Alloy Wheels Market Volume (Thousand Units) Forecast, by Rim Size, 2017-2031
Figure 98: South America Automotive Alloy Wheels Market Value (US$ Bn) Forecast, by Rim Size, 2017-2031
Figure 99: South America Automotive Alloy Wheels Market, Incremental Opportunity, by Rim Size, Value (US$ Bn), 2022-2031
Figure 100: South America Automotive Alloy Wheels Market Volume (Thousand Units) Forecast, by Material Type, 2017-2031
Figure 101: South America Automotive Alloy Wheels Market Value (US$ Bn) Forecast, by Material Type, 2017-2031
Figure 102: South America Automotive Alloy Wheels Market, Incremental Opportunity, by Material Type, Value (US$ Bn), 2022-2031
Figure 103: South America Automotive Alloy Wheels Market Volume (Thousand Units) Forecast, by Sales Channel, 2017-2031
Figure 104: South America Automotive Alloy Wheels Market Value (US$ Bn) Forecast, by Sales Channel, 2017-2031
Figure 105: South America Automotive Alloy Wheels Market, Incremental Opportunity, by Sales Channel, Value (US$ Bn), 2022-2031
Figure 106: South America Automotive Alloy Wheels Market Volume (Thousand Units) Forecast, by Country, 2017-2031
Figure 107: South America Automotive Alloy Wheels Market Value (US$ Bn) Forecast, by Country, 2017-2031
Figure 108: South America Automotive Alloy Wheels Market, Incremental Opportunity, by Country, Value (US$ Bn), 2022-2031
Copyright © Transparency Market Research, Inc. All Rights reserved
Trust Online

Automotive Alloy Wheels Market