
Reports
Reports
Global Atherectomy Devices Market: Snapshot
The global atherectomy devices market is growing at a high rate with the development of the medical infrastructure. The participation of new players and the advent of new and effective products are projected to ensure the growth of the market in the coming years. In addition to this, the commercialization of atherectomy devices is projected to generate growth prospects for the players worldwide. The leading players are making efforts to create an awareness among people concerning the availability of devices and therapeutics. This is expected to support the overall development of the atherectomy devices market in the coming few years.
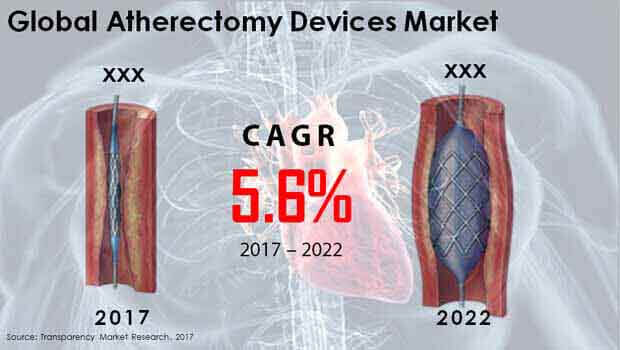
As per the study by TMR, the global atherectomy devices market stood at US$558.9 mn in the year 2017. The market is projected to reach US$735 mn by 2022. Furthermore, the market is likely to register a 5.60% CAGR from 2017 to 2022.
Technological Advancements to Propel Atherectomy Devices Market
The growing demand from people for minimally invasive procedures and the rising pool of patients are the key factors that are anticipated to encourage the development of the global atherectomy devices market in the coming years. The growing focus on technological developments and the introduction of new products are estimated to encourage the development of the market in the near future. In addition to this, the increasing research activities and the rapid development of the medical infrastructure are further estimated to ensure the market growth in the coming years.
On the other hand, in developing nations, there is low awareness among people concerning the easy availability of disease diagnosis and therapeutics, which is predicted to hamper the market growth in the coming years. Also, the lack of well-trained surgeons are estimated to further restrict the market growth in the near future. Nonetheless, the increasing government initiatives and expenditure is estimated to support the development of the overall market in the next few years. Also, the key players are targeting on emerging economies, which offers potential growth opportunities in the near future.
North America Market to Lead with Favorable Government Initiatives
From a geographical stance, the North America market is predicted to claim for a massive share of the atherectomy devices market in the coming few years. The favorable reimbursement environment and the growing demand for minimally invasive procedures are the main factors that are estimated to accelerate the market growth in the next few years. Europe is projected to retain its second-leading position and register a promising growth rate in the coming years. Furthermore, the rising geriatric population and the increasing contribution from India, China, and Japan are projected to ensure a healthy growth of the market in the next few years.
The global market for atherectomy devices is considered to have a high level of competition among the players in the coming few years. The key players in the market are making ardent efforts to maintain their position by focusing on the development of new products and technological developments. In addition, the rising number of collaborations and partnerships is projected to create potential growth opportunities for the players in the coming few years. The leading players in the atherectomy devices market are Boston Scientific Corp., Avinger Inc., Royal Philips NV, Spectranetics Corp., Terumo Corp., Medtronic Plc, and Cardiovascular Systems Inc.
Atherectomy Devices Market to Witness Lucrative Growth Opportunities from Increasing Adoption of Latest Medical Equipment
The increasing development of the healthcare and medical sector is expected to promote the growth of the global Atherectomy devices market in the years to come. The developing interest from individuals for insignificantly intrusive techniques and the rising pool of patients are the key factors that are foreseen to empower the improvement of the worldwide atherectomy gadgets market in the coming years. The developing spotlight on innovative turns of events and the presentation of new items are assessed to support the improvement of the market soon. Moreover, the expanding research exercises and the fast advancement of the clinical framework are additionally assessed to guarantee the market development in the coming years.
The rising interest from patients for less intrusive strategies and the rising number of cases are the principle factors that are anticipated to drive the development of the worldwide atherectomy gadgets market soon. Rising new advancements are prompting the presentation of new items in the market, for example, laser based atherectomy. These developments are giving new alternatives to patients and opening new chances for clinical experts. These advancements are probably going to keep during the estimate time frame as spending on examination keeps on expanding.
The growing demand from people worldwide for minimally invasive procedures and the rising pool of patients are the key factors that are anticipated to bolster the growth of the global atherectomy devices market in the near future. The increasing emphasis on the introduction of new products and growing investments on technological advancements are estimated to encourage the development of the market in the near future. Moreover, the rise in research activities and the rapid development of the healthcare infrastructure and facilities are further projected to add impetus to the market in the future.
Significant expenses of innovative work and forte hardware for laser systems can control development of the worldwide atherectomy gadgets market. In any case, innovation drive patterns prompting do-it-without anyone else's help analytic apparatuses are required to help development of the market by bringing down a part of the expenses.
1. Global Atherectomy Devices Market - Executive Summary
2. Global Atherectomy Devices Market Overview
2.1. Introduction
2.1.1. Global Market Taxonomy
2.1.2. Global Market Definition
2.2. Global Atherectomy Devices Market Size (US$ Mn) and Forecast, 2012-2022
2.2.1. Global Market Y-o-Y Growth
2.3. Global Market Dynamics
2.4. Supply Chain
2.5. Cost Structure
2.6. List of Distributors
2.7. Average Pricing Analysis
2.8. Technological Assessment
2.9. Key Participants Market Presence (Intensity Map) By Region
3. Global Atherectomy Devices Market Analysis and Forecast By Device Type
3.1. Global Market Size and Forecast By Device Type, 2012-2022
3.1.1. Directional Atherectomy Devices Market Size and Forecast, 2012-2022
3.1.1.1. Revenue (US$ Mn) Comparison, By Region
3.1.1.2. Market Share Comparison, By Region
3.1.1.3. Y-o-Y growth Comparison, By Region
3.1.2. Rotational Atherectomy Devices Market Size and Forecast, 2012-2022
3.1.2.1. Revenue (US$ Mn) Comparison, By Region
3.1.2.2. Market Share Comparison, By Region
3.1.2.3. Y-o-Y growth Comparison, By Region
3.1.3. Orbital Atherectomy Devices Market Size and Forecast, 2012-2022
3.1.3.1. Revenue (US$ Mn) Comparison, By Region
3.1.3.2. Market Share Comparison, By Region
3.1.3.3. Y-o-Y growth Comparison, By Region
3.1.4. Laser Atherectomy Devices Market Size and Forecast, 2012-2022
3.1.4.1. Revenue (US$ Mn) Comparison, By Region
3.1.4.2. Market Share Comparison, By Region
3.1.4.3. Y-o-Y growth Comparison, By Region
4. Global Atherectomy Devices Market Analysis and Forecast By End User
4.1. Global Atherectomy Devices Market Size and Forecast By End User, 2012-2022
4.1.1. Hospitals Atherectomy Devices Market Size and Forecast, 2012-2022
4.1.1.1. Revenue (US$ Mn) Comparison, By Region
4.1.1.2. Market Share Comparison, By Region
4.1.1.3. Y-o-Y growth Comparison, By Region
4.1.2. Clinics Atherectomy Devices Market Size and Forecast, 2012-2022
4.1.2.1. Revenue (US$ Mn) Comparison, By Region
4.1.2.2. Market Share Comparison, By Region
4.1.2.3. Y-o-Y growth Comparison, By Region
4.1.3. ASCs Atherectomy Devices Market Size and Forecast, 2012-2022
4.1.3.1. Revenue (US$ Mn) Comparison, By Region
4.1.3.2. Market Share Comparison, By Region
4.1.3.3. Y-o-Y growth Comparison, By Region
4.1.4. Others Atherectomy Devices Market Size and Forecast, 2012-2022
4.1.4.1. Revenue (US$ Mn) Comparison, By Region
4.1.4.2. Market Share Comparison, By Region
4.1.4.3. Y-o-Y growth Comparison, By Region
5. Global Atherectomy Devices Market Analysis and Forecast By Application
5.1. Global Atherectomy Devices Market Size and Forecast By Application, 2012-2022
5.1.1. Cardiovascular Atherectomy Devices Market Size and Forecast, 2012-2022
5.1.1.1. Revenue (US$ Mn) Comparison, By Region
5.1.1.2. Market Share Comparison, By Region
5.1.1.3. Y-o-Y growth Comparison, By Region
5.1.2. Neurovascular Atherectomy Devices Market Size and Forecast, 2012-2022
5.1.2.1. Revenue (US$ Mn) Comparison, By Region
5.1.2.2. Market Share Comparison, By Region
5.1.2.3. Y-o-Y growth Comparison, By Region
5.1.3. Peripheral Vascular Atherectomy Devices Market Size and Forecast, 2012-2022
5.1.3.1. Revenue (US$ Mn) Comparison, By Region
5.1.3.2. Market Share Comparison, By Region
5.1.3.3. Y-o-Y growth Comparison, By Region
6. Global Atherectomy Devices Market Analysis and Forecast By Region
6.1. Global Atherectomy Devices Market Size and Forecast, 2012-2022
6.1.1. North America Atherectomy Devices Market Size and Forecast, 2012-2022
6.1.1.1. Revenue (US$ Mn) Comparison, By Device Type
6.1.1.2. Revenue (US$ Mn) Comparison, By End User
6.1.1.3. Revenue (US$ Mn) Comparison, By Application
6.1.2. Latin America Atherectomy Devices Market Size and Forecast, 2012-2022
6.1.2.1. Revenue (US$ Mn) Comparison, By Device Type
6.1.2.2. Revenue (US$ Mn) Comparison, By End User
6.1.2.3. Revenue (US$ Mn) Comparison, By Application
6.1.3. Europe Atherectomy Devices Market Size and Forecast, 2012-2022
6.1.3.1. Revenue (US$ Mn) Comparison, By Device Type
6.1.3.2. Revenue (US$ Mn) Comparison, By End User
6.1.3.3. Revenue (US$ Mn) Comparison, By Application
6.1.4. Japan Atherectomy Devices Market Size and Forecast, 2012-2022
6.1.4.1. Revenue (US$ Mn) Comparison, By Device Type
6.1.4.2. Revenue (US$ Mn) Comparison, By End User
6.1.4.3. Revenue (US$ Mn) Comparison, By Application
6.1.5. APEJ Atherectomy Devices Market Size and Forecast, 2012-2022
6.1.5.1. Revenue (US$ Mn) Comparison, By Device Type
6.1.5.2. Revenue (US$ Mn) Comparison, By End User
6.1.5.3. Revenue (US$ Mn) Comparison, By Application
6.1.6. MEA Atherectomy Devices Market Size and Forecast, 2012-2022
6.1.6.1. Revenue (US$ Mn) Comparison, By Device Type
6.1.6.2. Revenue (US$ Mn) Comparison, By End User
6.1.6.3. Revenue (US$ Mn) Comparison, By Application
7. North America Atherectomy Devices Market Analysis and Forecast, By Country, 2012-2022
7.1. US Atherectomy Devices Market Size and Forecast, 2012-2022
7.1.1. Revenue (US$ Mn) Comparison, By Device Type
7.1.2. Revenue (US$ Mn) Comparison, By End User
7.1.3. Revenue (US$ Mn) Comparison, By Application
7.2. Canada Atherectomy Devices Market Size and Forecast, 2012-2022
7.2.1. Revenue (US$ Mn) Comparison, By Device Type
7.2.2. Revenue (US$ Mn) Comparison, By End User
7.2.3. Revenue (US$ Mn) Comparison, By Application
8. Latin America Atherectomy Devices Market Analysis and Forecast, By Country, 2012-2022
8.1. Brazil Atherectomy Devices Market Size and Forecast, 2012-2022
8.1.1. Revenue (US$ Mn) Comparison, By Device Type
8.1.2. Revenue (US$ Mn) Comparison, By End User
8.1.3. Revenue (US$ Mn) Comparison, By Application
8.2. Mexico Atherectomy Devices Market Size and Forecast, 2012-2022
8.2.1. Revenue (US$ Mn) Comparison, By Device Type
8.2.2. Revenue (US$ Mn) Comparison, By End User
8.2.3. Revenue (US$ Mn) Comparison, By Application
8.3. Argentina Atherectomy Devices Market Size and Forecast, 2012-2022
8.3.1. Revenue (US$ Mn) Comparison, By Device Type
8.3.2. Revenue (US$ Mn) Comparison, By End User
8.3.3. Revenue (US$ Mn) Comparison, By Application
9. Europe Atherectomy Devices Market Analysis and Forecast, By Country, 2012-2022
9.1. Germany Atherectomy Devices Market Size and Forecast, 2012-2022
9.1.1. Revenue (US$ Mn) Comparison, By Device Type
9.1.2. Revenue (US$ Mn) Comparison, By End User
9.1.3. Revenue (US$ Mn) Comparison, By Application
9.2. UK Atherectomy Devices Market Size and Forecast, 2012-2022
9.2.1. Revenue (US$ Mn) Comparison, By Device Type
9.2.2. Revenue (US$ Mn) Comparison, By End User
9.2.3. Revenue (US$ Mn) Comparison, By Application
9.3. France Atherectomy Devices Market Size and Forecast, 2012-2022
9.3.1. Revenue (US$ Mn) Comparison, By Device Type
9.3.2. Revenue (US$ Mn) Comparison, By End User
9.3.3. Revenue (US$ Mn) Comparison, By Application
9.4. Spain Atherectomy Devices Market Size and Forecast, 2012-2022
9.4.1. Revenue (US$ Mn) Comparison, By Device Type
9.4.2. Revenue (US$ Mn) Comparison, By End User
9.4.3. Revenue (US$ Mn) Comparison, By Application
9.5. Italy Atherectomy Devices Market Size and Forecast, 2012-2022
9.5.1. Revenue (US$ Mn) Comparison, By Device Type
9.5.2. Revenue (US$ Mn) Comparison, By End User
9.5.3. Revenue (US$ Mn) Comparison, By Application
9.6. Nordic Atherectomy Devices Market Size and Forecast, 2012-2022
9.6.1. Revenue (US$ Mn) Comparison, By Device Type
9.6.2. Revenue (US$ Mn) Comparison, By End User
9.6.3. Revenue (US$ Mn) Comparison, By Application
10. Japan Atherectomy Devices Market Analysis and Forecast, By Country, 2012-2022
10.1. Japan Atherectomy Devices Market Size and Forecast, 2012-2022
10.1.1. Revenue (US$ Mn) Comparison, By Device Type
10.1.2. Revenue (US$ Mn) Comparison, By End User
10.1.3. Revenue (US$ Mn) Comparison, By Application
11. APEJ Atherectomy Devices Market Analysis and Forecast, By Country, 2012-2022
11.1. China Atherectomy Devices Market Size and Forecast, 2012-2022
11.1.1. Revenue (US$ Mn) Comparison, By Device Type
11.1.2. Revenue (US$ Mn) Comparison, By End User
11.1.3. Revenue (US$ Mn) Comparison, By Application
11.2. India Atherectomy Devices Market Size and Forecast, 2012-2022
11.2.1. Revenue (US$ Mn) Comparison, By Device Type
11.2.2. Revenue (US$ Mn) Comparison, By End User
11.2.3. Revenue (US$ Mn) Comparison, By Application
11.3. Malaysia Atherectomy Devices Market Size and Forecast, 2012-2022
11.3.1. Revenue (US$ Mn) Comparison, By Device Type
11.3.2. Revenue (US$ Mn) Comparison, By End User
11.3.3. Revenue (US$ Mn) Comparison, By Application
11.4. Thailand Atherectomy Devices Market Size and Forecast, 2012-2022
11.4.1. Revenue (US$ Mn) Comparison, By Device Type
11.4.2. Revenue (US$ Mn) Comparison, By End User
11.4.3. Revenue (US$ Mn) Comparison, By Application
11.5. Singapore Atherectomy Devices Market Size and Forecast, 2012-2022
11.5.1. Revenue (US$ Mn) Comparison, By Device Type
11.5.2. Revenue (US$ Mn) Comparison, By End User
11.5.3. Revenue (US$ Mn) Comparison, By Application
11.6. Australia Atherectomy Devices Market Size and Forecast, 2012-2022
11.6.1. Revenue (US$ Mn) Comparison, By Device Type
11.6.2. Revenue (US$ Mn) Comparison, By End User
11.6.3. Revenue (US$ Mn) Comparison, By Application
12. MEA Atherectomy Devices Market Analysis and Forecast, By Country, 2012-2022
12.1. GCC Countries Atherectomy Devices Market Size and Forecast, 2012-2022
12.1.1. Revenue (US$ Mn) Comparison, By Device Type
12.1.2. Revenue (US$ Mn) Comparison, By End User
12.1.3. Revenue (US$ Mn) Comparison, By Application
12.2. South Africa Atherectomy Devices Market Size and Forecast, 2012-2022
12.2.1. Revenue (US$ Mn) Comparison, By Device Type
12.2.2. Revenue (US$ Mn) Comparison, By End User
12.2.3. Revenue (US$ Mn) Comparison, By Application
12.3. Nigeria Atherectomy Devices Market Size and Forecast, 2012-2022
12.3.1. Revenue (US$ Mn) Comparison, By Device Type
12.3.2. Revenue (US$ Mn) Comparison, By End User
12.3.3. Revenue (US$ Mn) Comparison, By Application
12.4. Israel Atherectomy Devices Market Size and Forecast, 2012-2022
12.4.1. Revenue (US$ Mn) Comparison, By Device Type
12.4.2. Revenue (US$ Mn) Comparison, By End User
12.4.3. Revenue (US$ Mn) Comparison, By Application
13. Global Atherectomy Devices Market Company Share, Competition Landscape and Company Profiles
13.1. Company Share Analysis
13.2. Competition Landscape
13.3. Company Profiles
13.3.1. Boston Scientific Corporation
13.3.2. Cardiovascular Systems Inc.
13.3.3. Medtronic Plc
13.3.4. Spectranetics Corporation
13.3.5. Terumo Corporation
13.3.6. Avinger Inc.
13.3.7. Royal Philips NV
14. Research Methodology
15. Secondary and Primary Sources
16. Assumptions and Acronyms
17. Disclaimer
List of Table
TABLE 1 Global Atherectomy Devices Market Value (US$ Mn), 2012-2016
TABLE 2 Global Market Value (US$ Mn), 2017-2022
TABLE 3 Global Market Value (US$ Mn) and Y-o-Y, 2015-2022
TABLE 4 Global Directional Atherectomy Segment Value (US$ Mn), By Region 2012-2016
TABLE 5 Global Directional Atherectomy Segment Value (US$ Mn), By Region 2017-2022
TABLE 6 Global Directional Atherectomy Segment Market Share, By Region 2012-2016
TABLE 7 Global Directional Atherectomy Segment Market Share, By Region 2017-2022
TABLE 8 Global Directional Atherectomy Segment Y-o-Y, By Region 2015-2022
TABLE 9 Global Rotational Atherectomy Segment Value (US$ Mn), By Region 2012-2016
TABLE 10 Global Rotational Atherectomy Segment Value (US$ Mn), By Region 2017-2022
TABLE 11 Global Rotational Atherectomy Segment Market Share, By Region 2012-2016
TABLE 12 Global Rotational Atherectomy Segment Market Share, By Region 2017-2022
TABLE 13 Global Rotational Atherectomy Segment Y-o-Y, By Region 2015-2022
TABLE 14 Global Orbital Atherectomy Segment Value (US$ Mn), By Region 2012-2016
TABLE 15 Global Orbital Atherectomy Segment Value (US$ Mn), By Region 2017-2022
TABLE 16 Global Orbital Atherectomy Segment Market Share, By Region 2012-2016
TABLE 17 Global Orbital Atherectomy Segment Market Share, By Region 2017-2022
TABLE 18 Global Orbital Atherectomy Segment Y-o-Y, By Region 2015-2022
TABLE 19 Global Laser Atherectomy Segment Value (US$ Mn), By Region 2012-2016
TABLE 20 Global Laser Atherectomy Segment Value (US$ Mn), By Region 2017-2022
TABLE 21 Global Laser Atherectomy Segment Market Share, By Region 2012-2016
TABLE 22 Global Laser Atherectomy Segment Market Share, By Region 2017-2022
TABLE 23 Global Laser Atherectomy Segment Y-o-Y, By Region 2015-2022
TABLE 24 Global Hospitals Segment Value (US$ Mn), By Region 2012-2016
TABLE 25 Global Hospitals Segment Value (US$ Mn), By Region 2017-2022
TABLE 26 Global Hospitals Segment Market Share, By Region 2012-2016
TABLE 27 Global Hospitals Segment Market Share, By Region 2017-2022
TABLE 28 Global Hospitals Segment Y-o-Y, By Region 2015-2022
TABLE 29 Global Clinics Segment Value (US$ Mn), By Region 2012-2016
TABLE 30 Global Clinics Segment Value (US$ Mn), By Region 2017-2022
TABLE 31 Global Clinics Segment Market Share, By Region 2012-2016
TABLE 32 Global Clinics Segment Market Share, By Region 2017-2022
TABLE 33 Global Clinics Segment Y-o-Y, By Region 2015-2022
TABLE 34 Global ASCs Segment Value (US$ Mn), By Region 2012-2016
TABLE 35 Global ASCs Segment Value (US$ Mn), By Region 2017-2022
TABLE 36 Global ASCs Segment Market Share, By Region 2012-2016
TABLE 37 Global ASCs Segment Market Share, By Region 2017-2022
TABLE 38 Global ASCs Segment Y-o-Y, By Region 2015-2022
TABLE 39 Global Others Segment Value (US$ Mn), By Region 2012-2016
TABLE 40 Global Others Segment Value (US$ Mn), By Region 2017-2022
TABLE 41 Global Others Segment Market Share, By Region 2012-2016
TABLE 42 Global Others Segment Market Share, By Region 2017-2022
TABLE 43 Global Others Segment Y-o-Y, By Region 2015-2022
TABLE 44 Global Cardiovascular Segment Value (US$ Mn), By Region 2012-2016
TABLE 45 Global Cardiovascular Segment Value (US$ Mn), By Region 2017-2022
TABLE 46 Global Cardiovascular Segment Market Share, By Region 2012-2016
TABLE 47 Global Cardiovascular Segment Market Share, By Region 2017-2022
TABLE 48 Global Cardiovascular Segment Y-o-Y, By Region 2015-2022
TABLE 49 Global Neurovascular Segment Value (US$ Mn), By Region 2012-2016
TABLE 50 Global Neurovascular Segment Value (US$ Mn), By Region 2017-2022
TABLE 51 Global Neurovascular Segment Market Share, By Region 2012-2016
TABLE 52 Global Neurovascular Segment Market Share, By Region 2017-2022
TABLE 53 Global Neurovascular Segment Y-o-Y, By Region 2015-2022
TABLE 54 Global Peripheral Vascular Segment Value (US$ Mn), By Region 2012-2016
TABLE 55 Global Peripheral Vascular Segment Value (US$ Mn), By Region 2017-2022
TABLE 56 Global Peripheral Vascular Segment Market Share, By Region 2012-2016
TABLE 57 Global Peripheral Vascular Segment Market Share, By Region 2017-2022
TABLE 58 Global Peripheral Vascular Segment Y-o-Y, By Region 2015-2022
TABLE 59 North America Atherectomy Devices Market Value (US$ Mn), By Device Type 2012-2016
TABLE 60 North America Market Value (US$ Mn), By Device Type 2017-2022
TABLE 61 North America Market Value (US$ Mn), By End User 2012-2016
TABLE 62 North America Market Value (US$ Mn), By End User 2017-2022
TABLE 63 North America Market Value (US$ Mn), By Application 2012-2016
TABLE 64 North America Market Value (US$ Mn), By Application 2017-2022
TABLE 65 Latin America Atherectomy Devices Market Value (US$ Mn), By Device Type 2012-2016
TABLE 66 Latin America Market Value (US$ Mn), By Device Type 2017-2022
TABLE 67 Latin America Market Value (US$ Mn), By End User 2012-2016
TABLE 68 Latin America Market Value (US$ Mn), By End User 2017-2022
TABLE 69 Latin America Market Value (US$ Mn), By Application 2012-2016
TABLE 70 Latin America Market Value (US$ Mn), By Application 2017-2022
TABLE 71 Europe Atherectomy Devices Market Value (US$ Mn), By Device Type 2012-2016
TABLE 72 Europe Market Value (US$ Mn), By Device Type 2017-2022
TABLE 73 Europe Market Value (US$ Mn), By End User 2012-2016
TABLE 74 Europe Market Value (US$ Mn), By End User 2017-2022
TABLE 75 Europe Market Value (US$ Mn), By Application 2012-2016
TABLE 76 Europe Market Value (US$ Mn), By Application 2017-2022
TABLE 77 Japan Atherectomy Devices Market Value (US$ Mn), By Device Type 2012-2016
TABLE 78 Japan Market Value (US$ Mn), By Device Type 2017-2022
TABLE 79 Japan Market Value (US$ Mn), By End User 2012-2016
TABLE 80 Japan Market Value (US$ Mn), By End User 2017-2022
TABLE 81 Japan Market Value (US$ Mn), By Application 2012-2016
TABLE 82 Japan Market Value (US$ Mn), By Application 2017-2022
TABLE 83 APEJ Atherectomy Devices Market Value (US$ Mn), By Device Type 2012-2016
TABLE 84 APEJ Market Value (US$ Mn), By Device Type 2017-2022
TABLE 85 APEJ Market Value (US$ Mn), By End User 2012-2016
TABLE 86 APEJ Market Value (US$ Mn), By End User 2017-2022
TABLE 87 APEJ Market Value (US$ Mn), By Application 2012-2016
TABLE 88 APEJ Market Value (US$ Mn), By Application 2017-2022
TABLE 89 MEA Atherectomy Devices Market Value (US$ Mn), By Device Type 2012-2016
TABLE 90 MEA Market Value (US$ Mn), By Device Type 2017-2022
TABLE 91 MEA Market Value (US$ Mn), By End User 2012-2016
TABLE 92 MEA Market Value (US$ Mn), By End User 2017-2022
TABLE 93 MEA Market Value (US$ Mn), By Application 2012-2016
TABLE 94 MEA Market Value (US$ Mn), By Application 2017-2022
TABLE 95 US Atherectomy Devices Market Value (US$ Mn), By Device Type 2012-2016
TABLE 96 US Market Value (US$ Mn), By Device Type 2017-2022
TABLE 97 US Market Value (US$ Mn), By End User 2012-2016
TABLE 98 US Market Value (US$ Mn), By End User 2017-2022
TABLE 99 US Market Value (US$ Mn), By Application 2012-2016
TABLE 100 US Atherectomy Devices Market Value (US$ Mn), By Application 2017-2022
TABLE 101 Canada Atherectomy Devices Market Value (US$ Mn), By Device Type 2012-2016
TABLE 102 Canada Market Value (US$ Mn), By Device Type 2017-2022
TABLE 103 Canada Market Value (US$ Mn), By End User 2012-2016
TABLE 104 Canada Market Value (US$ Mn), By End User 2017-2022
TABLE 105 Canada Market Value (US$ Mn), By Application 2012-2016
TABLE 106 Canada Market Value (US$ Mn), By Application 2017-2022
TABLE 107 Brazil Atherectomy Devices Market Value (US$ Mn), By Device Type 2012-2016
TABLE 108 Brazil Market Value (US$ Mn), By Device Type 2017-2022
TABLE 109 Brazil Market Value (US$ Mn), By End User 2012-2016
TABLE 110 Brazil Market Value (US$ Mn), By End User 2017-2022
TABLE 111 Brazil Market Value (US$ Mn), By Application 2012-2016
TABLE 112 Brazil Market Value (US$ Mn), By Application 2017-2022
TABLE 113 Mexico Atherectomy Devices Market Value (US$ Mn), By Device Type 2012-2016
TABLE 114 Mexico Market Value (US$ Mn), By Device Type 2017-2022
TABLE 115 Mexico Market Value (US$ Mn), By End User 2012-2016
TABLE 116 Mexico Market Value (US$ Mn), By End User 2017-2022
TABLE 117 Mexico Market Value (US$ Mn), By Application 2012-2016
TABLE 118 Mexico Market Value (US$ Mn), By Application 2017-2022
TABLE 119 Argentina Atherectomy Devices Market Value (US$ Mn), By Device Type 2012-2016
TABLE 120 Argentina Market Value (US$ Mn), By Device Type 2017-2022
TABLE 121 Argentina Market Value (US$ Mn), By End User 2012-2016
TABLE 122 Argentina Atherectomy Devices Market Value (US$ Mn), By End User 2017-2022
TABLE 123 Argentina Market Value (US$ Mn), By Application 2012-2016
TABLE 124 Argentina Market Value (US$ Mn), By Application 2017-2022
TABLE 125 Germany Atherectomy Devices Market Value (US$ Mn), By Device Type 2012-2016
TABLE 126 Germany Market Value (US$ Mn), By Device Type 2017-2022
TABLE 127 Germany Market Value (US$ Mn), By End User 2012-2016
TABLE 128 Germany Market Value (US$ Mn), By End User 2017-2022
TABLE 129 Germany Market Value (US$ Mn), By Application 2012-2016
TABLE 130 Germany Market Value (US$ Mn), By Application 2017-2022
TABLE 131 UK Atherectomy Devices Market Value (US$ Mn), By Device Type 2012-2016
TABLE 132 UK Market Value (US$ Mn), By Device Type 2017-2022
TABLE 133 UK Market Value (US$ Mn), By End User 2012-2016
TABLE 134 UK Market Value (US$ Mn), By End User 2017-2022
TABLE 135 UK Market Value (US$ Mn), By Application 2012-2016
TABLE 136 UK Market Value (US$ Mn), By Application 2017-2022
TABLE 137 France Atherectomy Devices Market Value (US$ Mn), By Device Type 2012-2016
TABLE 138 France Market Value (US$ Mn), By Device Type 2017-2022
TABLE 139 France Market Value (US$ Mn), By End User 2012-2016
TABLE 140 France Market Value (US$ Mn), By End User 2017-2022
TABLE 141 France Market Value (US$ Mn), By Application 2012-2016
TABLE 142 FranceMarket Value (US$ Mn), By Application 2017-2022
TABLE 143 Spain Atherectomy Devices Market Value (US$ Mn), By Device Type 2012-2016
TABLE 144 Spain Market Value (US$ Mn), By Device Type 2017-2022
TABLE 145 Spain Market Value (US$ Mn), By End User 2012-2016
TABLE 146 Spain Market Value (US$ Mn), By End User 2017-2022
TABLE 147 Spain Market Value (US$ Mn), By Application 2012-2016
TABLE 148 Spain Market Value (US$ Mn), By Application 2017-2022
TABLE 149 Italy Atherectomy Devices Market Value (US$ Mn), By Device Type 2012-2016
TABLE 150 Italy Market Value (US$ Mn), By Device Type 2017-2022
TABLE 151 Italy Market Value (US$ Mn), By End User 2012-2016
TABLE 152 Italy Market Value (US$ Mn), By End User 2017-2022
TABLE 153 Italy Market Value (US$ Mn), By Application 2012-2016
TABLE 154 Italy Market Value (US$ Mn), By Application 2017-2022
TABLE 155 Nordic Atherectomy Devices Market Value (US$ Mn), By Device Type 2012-2016
TABLE 156 Nordic Market Value (US$ Mn), By Device Type 2017-2022
TABLE 157 Nordic Market Value (US$ Mn), By End User 2012-2016
TABLE 158 Nordic Market Value (US$ Mn), By End User 2017-2022
TABLE 159 Nordic Market Value (US$ Mn), By Application 2012-2016
TABLE 160 Nordic Market Value (US$ Mn), By Application 2017-2022
TABLE 161 Japan Atherectomy Devices Market Value (US$ Mn), By Device Type 2012-2016
TABLE 162 Japan Market Value (US$ Mn), By Device Type 2017-2022
TABLE 163 Japan Market Value (US$ Mn), By End User 2012-2016
TABLE 164 Japan Market Value (US$ Mn), By End User 2017-2022
TABLE 165 Japan Market Value (US$ Mn), By Application 2012-2016
TABLE 166 Japan Market Value (US$ Mn), By Application 2017-2022
TABLE 167 China Atherectomy Devices Market Value (US$ Mn), By Device Type 2012-2016
TABLE 168 China Market Value (US$ Mn), By Device Type 2017-2022
TABLE 169 China Market Value (US$ Mn), By End User 2012-2016
TABLE 170 China Market Value (US$ Mn), By End User 2017-2022
TABLE 171 China Market Value (US$ Mn), By Application 2012-2016
TABLE 172 China Market Value (US$ Mn), By Application 2017-2022
TABLE 173 India Atherectomy Devices Market Value (US$ Mn), By Device Type 2012-2016
TABLE 174 India Market Value (US$ Mn), By Device Type 2017-2022
TABLE 175 India Market Value (US$ Mn), By End User 2012-2016
TABLE 176 India Market Value (US$ Mn), By End User 2017-2022
TABLE 177 India Market Value (US$ Mn), By Application 2012-2016
TABLE 178 India Market Value (US$ Mn), By Application 2017-2022
TABLE 179 Malaysia Atherectomy Devices Market Value (US$ Mn), By Device Type 2012-2016
TABLE 180 Malaysia Market Value (US$ Mn), By Device Type 2017-2022
TABLE 181 Malaysia Market Value (US$ Mn), By End User 2012-2016
TABLE 182 Malaysia Market Value (US$ Mn), By End User 2017-2022
TABLE 183 Malaysia Market Value (US$ Mn), By Application 2012-2016
TABLE 184 Malaysia Market Value (US$ Mn), By Application 2017-2022
TABLE 185 Thailand Atherectomy Devices Market Value (US$ Mn), By Device Type 2012-2016
TABLE 186 Thailand Market Value (US$ Mn), By Device Type 2017-2022
TABLE 187 Thailand Market Value (US$ Mn), By End User 2012-2016
TABLE 188 Thailand Market Value (US$ Mn), By End User 2017-2022
TABLE 189 Thailand Market Value (US$ Mn), By Application 2012-2016
TABLE 190 Thailand Market Value (US$ Mn), By Application 2017-2022
TABLE 191 Singapore Atherectomy Devices Market Value (US$ Mn), By Device Type 2012-2016
TABLE 192 Singapore Market Value (US$ Mn), By Device Type 2017-2022
TABLE 193 Singapore Market Value (US$ Mn), By End User 2012-2016
TABLE 194 Singapore Market Value (US$ Mn), By End User 2017-2022
TABLE 195 Singapore Market Value (US$ Mn), By Application 2012-2016
TABLE 196 Singapore Market Value (US$ Mn), By Application 2017-2022
TABLE 197 Australia Atherectomy Devices Market Value (US$ Mn), By Device Type 2012-2016
TABLE 198 Australia Market Value (US$ Mn), By Device Type 2017-2022
TABLE 199 Australia Market Value (US$ Mn), By End User 2012-2016
TABLE 200 Australia Market Value (US$ Mn), By End User 2017-2022
TABLE 201 Australia Market Value (US$ Mn), By Application 2012-2016
TABLE 202 Australia Market Value (US$ Mn), By Application 2017-2022
TABLE 203 GCC Countries Atherectomy Devices Market Value (US$ Mn), By Device Type 2012-2016
TABLE 204 GCC Countries Market Value (US$ Mn), By Device Type 2017-2022
TABLE 205 GCC Countries Market Value (US$ Mn), By End User 2012-2016
TABLE 206 GCC Countries Market Value (US$ Mn), By End User 2017-2022
TABLE 207 GCC Countries Market Value (US$ Mn), By Application 2012-2016
TABLE 208 GCC Countries Market Value (US$ Mn), By Application 2017-2022
TABLE 209 South Africa Atherectomy Devices Market Value (US$ Mn), By Device Type 2012-2016
TABLE 210 South Africa Market Value (US$ Mn), By Device Type 2017-2022
TABLE 211 South Africa Market Value (US$ Mn), By End User 2012-2016
TABLE 212 South Africa Market Value (US$ Mn), By End User 2017-2022
TABLE 213 South Africa Market Value (US$ Mn), By Application 2012-2016
TABLE 214 South Africa Market Value (US$ Mn), By Application 2017-2022
TABLE 215 Nigeria Atherectomy Devices Market Value (US$ Mn), By Device Type 2012-2016
TABLE 216 Nigeria Market Value (US$ Mn), By Device Type 2017-2022
TABLE 217 Nigeria Market Value (US$ Mn), By End User 2012-2016
TABLE 218 Nigeria Market Value (US$ Mn), By End User 2017-2022
TABLE 219 Nigeria Market Value (US$ Mn), By Application 2012-2016
TABLE 220 Nigeria Market Value (US$ Mn), By Application 2017-2022
TABLE 221 Israel Atherectomy Devices Market Value (US$ Mn), By Device Type 2012-2016
TABLE 222 Israel Market Value (US$ Mn), By Device Type 2017-2022
TABLE 223 Israel Market Value (US$ Mn), By End User 2012-2016
TABLE 224 Israel Market Value (US$ Mn), By End User 2017-2022
TABLE 225 Israel Market Value (US$ Mn), By Application 2012-2016
TABLE 226 Israel Market Value (US$ Mn), By Application 2017-2022
List of Figure
FIG. 1 Global Atherectomy Devices Market Value (US$ Mn), 2012-2016
FIG. 2 Global Market Value (US$ Mn) Forecast, 2017-2022
FIG. 3 Global Market Value (US$ Mn) and Y-o-Y, 2015-2022
FIG. 4 Global Directional Atherectomy Segment Market Value (US$ Mn) By Region, 2012-2016
FIG. 5 Global Directional Atherectomy Segment Market Value (US$ Mn) By Region, 2017-2022
FIG. 6 Global Directional Atherectomy Segment Y-o-Y Growth Rate, By Region, 2015-2022
FIG. 7 Global Rotational Atherectomy Segment Market Value (US$ Mn) By Region, 2012-2016
FIG. 8 Global Rotational Atherectomy Segment Market Value (US$ Mn) By Region, 2017-2022
FIG. 9 Global Rotational Atherectomy Segment Y-o-Y Growth Rate, By Region, 2015-2022
FIG. 10 Global Orbital Atherectomy Segment Market Value (US$ Mn) By Region, 2012-2016
FIG. 11 Global Orbital Atherectomy Segment Market Value (US$ Mn) By Region, 2017-2022
FIG. 12 Global Orbital Atherectomy Segment Y-o-Y Growth Rate, By Region, 2015-2022
FIG. 13 Global Laser Atherectomy Segment Market Value (US$ Mn) By Region, 2012-2016
FIG. 14 Global Laser Atherectomy Segment Market Value (US$ Mn) By Region, 2017-2022
FIG. 15 Global Laser Atherectomy Segment Y-o-Y Growth Rate, By Region, 2015-2022
FIG. 16 Global Hospitals Segment Market Value (US$ Mn) By Region, 2012-2016
FIG. 17 Global Hospitals Segment Market Value (US$ Mn) By Region, 2017-2022
FIG. 18 Global Hospitals Segment Y-o-Y Growth Rate, By Region, 2015-2022
FIG. 19 Global Clinics Segment Market Value (US$ Mn) By Region, 2012-2016
FIG. 20 Global Clinics Segment Market Value (US$ Mn) By Region, 2017-2022
FIG. 21 Global Clinics Segment Y-o-Y Growth Rate, By Region, 2015-2022
FIG. 22 Global ASCs Segment Market Value (US$ Mn) By Region, 2012-2016
FIG. 23 Global ASCs Segment Market Value (US$ Mn) By Region, 2017-2022
FIG. 24 Global ASCs Segment Y-o-Y Growth Rate, By Region, 2015-2022
FIG. 25 Global Others Segment Market Value (US$ Mn) By Region, 2012-2016
FIG. 26 Global Others Segment Market Value (US$ Mn) By Region, 2017-2022
FIG. 27 Global Others Segment Y-o-Y Growth Rate, By Region, 2015-2022
FIG. 28 Global Cardiovascular Segment Market Value (US$ Mn) By Region, 2012-2016
FIG. 29 Global Cardiovascular Segment Market Value (US$ Mn) By Region, 2017-2022
FIG. 30 Global Cardiovascular Segment Y-o-Y Growth Rate, By Region, 2015-2022
FIG. 31 Global Neurovascular Segment Market Value (US$ Mn) By Region, 2012-2016
FIG. 32 Global Neurovascular Segment Market Value (US$ Mn) By Region, 2017-2022
FIG. 33 Global Neurovascular Segment Y-o-Y Growth Rate, By Region, 2015-2022
FIG. 34 Global Peripheral Vascular Segment Market Value (US$ Mn) By Region, 2012-2016
FIG. 35 Global Peripheral Vascular Segment Market Value (US$ Mn) By Region, 2017-2022
FIG. 36 Global Peripheral Vascular Segment Y-o-Y Growth Rate, By Region, 2015-2022
FIG. 37 North America Atherectomy Devices Market Value (US$ Mn), By Device Type 2012-2016
FIG. 38 North America Market Value (US$ Mn), By Device Type 2017-2022
FIG. 39 North America Market Value (US$ Mn), By End User 2012-2016
FIG. 40 North America Market Value (US$ Mn), By End User 2017-2022
FIG. 41 North America Market Value (US$ Mn), By Application 2012-2016
FIG. 42 North America Market Value (US$ Mn), By Application 2017-2022
FIG. 43 Latin America Atherectomy Devices Market Value (US$ Mn), By Device Type 2012-2016
FIG. 44 Latin America Market Value (US$ Mn), By Device Type 2017-2022
FIG. 45 Latin America Market Value (US$ Mn), By End User 2012-2016
FIG. 46 Latin America Market Value (US$ Mn), By End User 2017-2022
FIG. 47 Latin America Market Value (US$ Mn), By Application 2012-2016
FIG. 48 Latin America Market Value (US$ Mn), By Application 2017-2022
FIG. 49 Europe Atherectomy Devices Market Value (US$ Mn), By Device Type 2012-2016
FIG. 50 Europe Market Value (US$ Mn), By Device Type 2017-2022
FIG. 51 Europe Market Value (US$ Mn), By End User 2012-2016
FIG. 52 Europe Market Value (US$ Mn), By End User 2017-2022
FIG. 53 Europe Market Value (US$ Mn), By Application 2012-2016
FIG. 54 Europe Market Value (US$ Mn), By Application 2017-2022
FIG. 55 Japan Atherectomy Devices Market Value (US$ Mn), By Device Type 2012-2016
FIG. 56 Japan Market Value (US$ Mn), By Device Type 2017-2022
FIG. 57 Japan Market Value (US$ Mn), By End User 2012-2016
FIG. 58 Japan Market Value (US$ Mn), By End User 2017-2022
FIG. 59 Japan Market Value (US$ Mn), By Application 2012-2016
FIG. 60 Japan Market Value (US$ Mn), By Application 2017-2022
FIG. 61 APEJ Atherectomy Devices Market Value (US$ Mn), By Device Type 2012-2016
FIG. 62 APEJ Market Value (US$ Mn), By Device Type 2017-2022
FIG. 63 APEJ Market Value (US$ Mn), By End User 2012-2016
FIG. 64 APEJ Market Value (US$ Mn), By End User 2017-2022
FIG. 65 APEJ Market Value (US$ Mn), By Application 2012-2016
FIG. 66 APEJ Market Value (US$ Mn), By Application 2017-2022
FIG. 67 MEA Atherectomy Devices Market Value (US$ Mn), By Device Type 2012-2016
FIG. 68 MEA Market Value (US$ Mn), By Device Type 2017-2022
FIG. 69 MEA Market Value (US$ Mn), By End User 2012-2016
FIG. 70 MEA Market Value (US$ Mn), By End User 2017-2022
FIG. 71 MEA Market Value (US$ Mn), By Application 2012-2016
FIG. 72 MEA Market Value (US$ Mn), By Application 2017-2022
Copyright © Transparency Market Research, Inc. All Rights reserved
Trust Online

Atherectomy Devices Market