
Reports
Reports
Analysts’ Viewpoint on Anticoagulants Market Scenario
Increase in cases of coagulation disorders across the globe is driving the global anticoagulants market. Surge in thrombotic complications in patients affected by COVID-19 is also augmenting the global anticoagulants market. Strategic alliances among leading companies is expected to increase product penetration, which in turn is likely to drive the global anticoagulants market growth in the next few years. Surge in geriatric population, rise in prevalence of obesity, and increase in hip & knee surgeries are also projected to fuel the global anticoagulants market during the forecast period. Governments and private players are focusing on commercializing anticoagulant products. Furthermore, manufacturers of anticoagulants are focusing on expanding their presence in developing countries such as India, China, South Africa, Brazil, and Mexico in order to increase business operations and explore new markets.
Medicines called anticoagulants stop the blood from clotting. Blood thinners are also referred to as anticoagulants. These medicines are used in order to treat and prevent blood clots that could form in blood vessels. An artery or a vein could be obstructed by blood clots. A blocked artery prevents oxygen and blood from reaching a specific area of the body such as heart, brain, or lungs. Oral anticoagulants and injectable anticoagulants are the two major forms of anticoagulants. The coagulation pathway in the blood is different for each type. Anticoagulants can be used to treat blood clots or lower the risk in situations where they are more likely to occur. People with atrial fibrillation, deep vein thrombosis, hip or knee replacement, ischemic stroke, myocardial infraction (heart attack), and pulmonary embolism can benefit from the usage of anticoagulants.
Different types of anticoagulants available in the market are Coumadin & indandiones (also called vitamin K antagonist), factor XA inhibitors, direct thrombin inhibitors, and heparin. Warfarin, sold under brand name Coumadin, is available in the U.S. only for human use. Indandiones are primarily used for pest control, especially mice and rabbit. Heparins, such as Lipo-Hepin, are injectable anticoagulants that activate antithrombin III. In the normal coagulation system, liquemin acts at multiple locations. Antithrombin III, a heparin cofactor, and heparin can prevent thrombosis by inactivating activated factor X and preventing the conversion of prothrombin to thrombin. By inhibiting the activation of the fibrin stabilizing factor, liquemin also prevents the formation of a stable fibrin clot.
Coagulation disorders cause the body to form too many or too few blood clots. These are usually formed due to a genetic mutation and are often treatable with medications. Coagulation disorders can cause excessive bleeding if the body is unable to form blood clots properly. In other cases, these disorders could cause the body to produce blood clots too readily and increase the risk of blocked blood vessels. Bleeding disorders such as hemophilia and von Willebrand disease are genetic disorders.
According to the Centers of Disease Control and Prevention, the rate of occurrence of von Willebrand disease (VWD) is equal in men and women, affecting up to 1% of the general population. Between 2012 and 2016, more than 14,600 men, women, and children were seen at hemophilia treatment centers for the treatment of von Willebrand disease (VWD); of these, about 2/3 were women and girls. Thus, rise in cases of coagulation disorders is expected to drive the global market during the forecast period.
Increase in number of knee and hip replacement surgeries raises the risk of developing deep vein thrombosis (DVT). Surgeries often result in prolonged immobility, which increases the risk of deep vein thrombosis (DVT) due to decreased blood flow in the body. According to the WHO 2016 report, the number of surgical procedures performed among the elderly population has increased. Rise in number of surgeries is expected to increase the likelihood of developing thromboembolic events after surgery, thereby boosting patient demand for anticoagulant treatment.
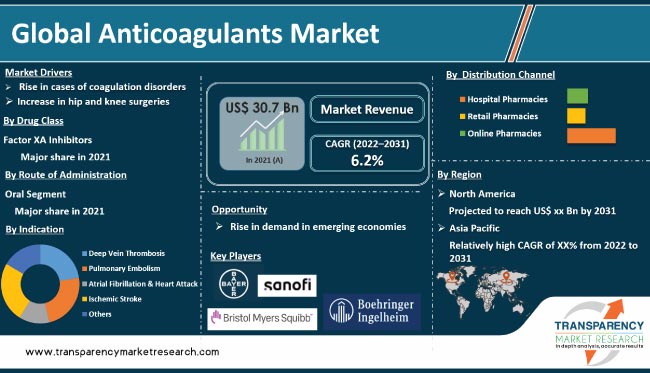
In terms of drug class, the global anticoagulants market has been classified into factor XA inhibitors (NOAC/DOAC), heparins, direct thrombin inhibitors, and vitamin K antagonists. The factor XA inhibitors segment accounted for major share of the global market in 2021. Factor XA inhibitor drugs include 90% of direct factor XA. Factor XA inhibitors prevent the formation of thrombin, thereby inhibiting the formation of clots. Factor XA inhibitors have predictable anticoagulant effects and do not require routine monitoring, unlike some other blood thinners.
Based on indication, the global anticoagulants market has been segregated into deep vein thrombosis (DVT), pulmonary embolism (PE), atrial fibrillation & heart attack, ischemic stroke, and others. The atrial fibrillation & heart attack segment dominated the global market in terms of share in 2021. Atrial fibrillation can cause conditions such as blood clots, stroke, heart failure, overactive thyroid gland or other metabolic imbalance, and other issues, which lead to thromboembolism. Anticoagulants are used to treat these conditions.
In terms of route of administration, the global anticoagulants market has been bifurcated into oral and injectable. The oral segment accounted for the largest share of the global anticoagulants market in 2021. A number of direct oral anticoagulants (DOACs) have been approved by the U.S. Food & Drug Administration (FDA) since 2010. Oral anticoagulants directly inhibit the blood’s ability to form clots. Implementation of different technologies for oral drug delivery is changing the market scenario.
Based on distribution channel, the global anticoagulants market has been divided into hospital pharmacies, online pharmacies, and retail pharmacies. The hospital pharmacies segment dominated the global market in 2021. Surge in adoption of minimally invasive procedures for spine surgeries in hospitals & clinics is expected to drive the segment during the forecast period.
As per the global anticoagulants market analysis, North America accounted for major share of the market in 2021. The market in the region is likely to grow at a high CAGR from 2022 to 2031, due to high incidence of orthotic conditions among people over the age of 60 in the region. This is driving the demand for anticoagulant drugs among the geriatric population. Cardiovascular and kidney diseases are the most common conditions that affect the elderly. Cardiovascular complications account for 50% to 55% of hospital admissions for AFIB and heart attack. Thus, the anticoagulants market demand in the U.S. and Canada is likely to rise in the near future.
The market in Asia Pacific is projected to advance at a high CAGR from 2022 to 2031. China and Japan are expected to dominate the anticoagulants market in the region in the next few years. The patient pool in Asia Pacific is expected to rise in the near future due to the increase in awareness about and improvement in healthcare infrastructure. Health care organizations in Asia Pacific are implementing guidelines to support the usage of specific drugs for the prevention and treatment of anticoagulant disorders.
The global anticoagulants market is fragmented, with the presence of large number of local as well as international players. Expansion of product portfolio and mergers & acquisitions are the key strategies adopted by the leading players in the market. Prominent players in the global anticoagulants market are Bayer AG, Boehringer Ingelheim International GmbH, Bristol Myers Squibb, Daiichi Sankyo Company, Sanofi, Johnson & Johnson, and Pfizer, Inc.
Key players have been profiled in the anticoagulants market report based on parameters such as company overview, financial overview, business strategies, product portfolio, business segments, and recent developments.
|
Attribute |
Detail |
|
Market Size Value in 2021 |
US$ 30.7 Bn |
|
Market Forecast Value in 2031 |
More than US$ 56.6 Bn |
|
Growth Rate (CAGR) |
6.2% |
|
Forecast Period |
2022–2031 |
|
Historical Data Available for |
2017–2020 |
|
Quantitative Units |
US$ Bn for Value |
|
Market Analysis |
It includes segment analysis as well as regional level analysis. Moreover, qualitative analysis includes drivers, restraints, opportunities, key trends, Porter’s Five Forces analysis, value chain analysis, and key trend analysis. |
|
Competition Landscape |
|
|
Format |
Electronic (PDF) + Excel |
|
Market Segmentation |
|
|
Regions Covered |
|
|
Countries Covered |
|
|
Companies Profiled |
|
|
Customization Scope |
Available upon request |
|
Pricing |
Available upon request |
The global anticoagulants market was valued at US$ 30.7 Bn in 2021.
The global anticoagulants market is projected to reach more than US$ 56.6 Bn by 2031.
The global anticoagulants market advanced at a CAGR of 10.9% from 2017 to 2021.
The global anticoagulants market is anticipated to grow at a CAGR of 6.2% from 2022 to 2031.
Rise in cases of coagulation disorders and increase in hip & knee surgeries.
North America is expected to account for the largest share of the global market during the forecast period.
Bayer AG, Boehringer Ingelheim International GmbH, Bristol Myers Squibb, Daiichi Sankyo Company, Sanofi, Johnson & Johnson, and Pfizer, Inc.
1. Preface
1.1. Market Definition and Scope
1.2. Market Segmentation
1.3. Key Research Objectives
1.4. Research Highlights
2. Assumptions and Research Methodology
3. Executive Summary: Global Anticoagulants Market
4. Market Overview
4.1. Introduction
4.1.1. Segment Definition
4.1.2. Industry Evolution / Developments
4.2. Overview
4.3. Market Dynamics
4.3.1. Drivers
4.3.2. Restraints
4.3.3. Opportunities
4.4. Global Anticoagulants Market Analysis and Forecast, 2017–2031
4.4.1. Market Revenue Projections (US$ Bn)
5. Key Insights
5.1. Key industry events (mergers & acquisitions, product launches, partnerships, etc.)
5.2. Overview on the Novel Oral Anticoagulants (NOACs)
5.3. Epidemiology of the Key Diseases
5.4. Covid-19 Pandemic Impact on the Industry
6. Global Anticoagulants Market Analysis and Forecast, by Drug Class
6.1. Introduction & Definition
6.2. Key Findings / Developments
6.3. Market Value Forecast, by Drug Class, 2017–2031
6.3.1. Factor XA Inhibitors (NOAC/DOAC)
6.3.2. Heparins
6.3.3. Direct Thrombin Inhibitors
6.3.4. Vitamin K Antagonists
6.4. Market Attractiveness Analysis, by Drug Class
7. Global Anticoagulants Market Analysis and Forecast, by Route of Administration
7.1. Introduction & Definition
7.2. Key Findings / Developments
7.3. Market Value Forecast, by Route of Administration, 2017–2031
7.3.1. Oral
7.3.2. Injectable
7.4. Market Attractiveness Analysis, by Route of Administration
8. Global Anticoagulants Market Analysis and Forecast, by Indication
8.1. Introduction & Definition
8.2. Key Findings / Developments
8.3. Market Value Forecast, by Indication, 2017–2031
8.3.1. Deep Vein Thrombosis
8.3.2. Pulmonary Embolism
8.3.3. Atrial Fibrillation & Heart Attack
8.3.4. Ischemic Stroke
8.3.5. Others
8.4. Market Attractiveness Analysis, by Indication
9. Global Anticoagulants Market Analysis and Forecast, by Distribution Channel
9.1. Introduction & Definition
9.2. Key Findings / Developments
9.3. Market Value Forecast, by Distribution Channel, 2017–2031
9.3.1. Hospital Pharmacies
9.3.2. Retail Pharmacies
9.3.3. Online Pharmacies
9.4. Market Attractiveness Analysis, by Distribution Channel
10. Global Anticoagulants Market Analysis and Forecast, by Region
10.1. Key Findings
10.2. Market Value Forecast, by Region
10.2.1. North America
10.2.2. Europe
10.2.3. Asia Pacific
10.2.4. Latin America
10.2.5. Middle East & Africa
10.3. Market Attractiveness Analysis, by Region
11. North America Anticoagulants Market Analysis and Forecast
11.1. Introduction
11.1.1. Key Findings
11.2. Market Value Forecast, by Drug Class, 2017–2031
11.2.1. Factor XA Inhibitors (NOAC/DOAC)
11.2.2. Heparins
11.2.3. Direct Thrombin Inhibitors
11.2.4. Vitamin K Antagonists
11.3. Market Value Forecast, by Route of Administration, 2017–2031
11.3.1. Oral
11.3.2. Injectable
11.4. Market Value Forecast, by Indication, 2017–2031
11.4.1. Deep Vein Thrombosis
11.4.2. Pulmonary Embolism
11.4.3. Atrial Fibrillation & Heart Attack
11.4.4. Ischemic Stroke
11.4.5. Others
11.5. Market Value Forecast, by Distribution Channel, 2017–2031
11.5.1. Hospital Pharmacies
11.5.2. Retail Pharmacies
11.5.3. Online Pharmacies
11.6. Market Value Forecast, by Country, 2017–2031
11.6.1. U.S.
11.6.2. Canada
11.7. Market Attractiveness Analysis
11.7.1. By Drug Class
11.7.2. By Route of Administration
11.7.3. By Indication
11.7.4. By Distribution Channel
11.7.5. By Country
12. Europe Anticoagulants Market Analysis and Forecast
12.1. Introduction
12.1.1. Key Findings
12.2. Market Value Forecast, by Drug Class, 2017–2031
12.2.1. Factor XA Inhibitors (NOAC/DOAC)
12.2.2. Heparins
12.2.3. Direct Thrombin Inhibitors
12.2.4. Vitamin K Antagonists
12.3. Market Value Forecast, by Route of Administration, 2017–2031
12.3.1. Oral
12.3.2. Injectable
12.4. Market Value Forecast, by Indication, 2017–2031
12.4.1. Deep Vein Thrombosis
12.4.2. Pulmonary Embolism
12.4.3. Atrial Fibrillation & Heart Attack
12.4.4. Ischemic Stroke
12.4.5. Others
12.5. Market Value Forecast, by Distribution Channel, 2017–2031
12.5.1. Hospital Pharmacies
12.5.2. Retail Pharmacies
12.5.3. Online Pharmacies
12.6. Market Value Forecast, by Country/Sub-region, 2017–2031
12.6.1. Germany
12.6.2. U.K.
12.6.3. France
12.6.4. Italy
12.6.5. Spain
12.6.6. Rest of Europe
12.7. Market Attractiveness Analysis
12.7.1. By Drug Class
12.7.2. By Route of Administration
12.7.3. By Indication
12.7.4. By Distribution Channel
12.7.5. By Country/Sub-region
13. Asia Pacific Anticoagulants Market Analysis and Forecast
13.1. Introduction
13.1.1. Key Findings
13.2. Market Value Forecast, by Drug Class, 2017–2031
13.2.1. Factor XA Inhibitors (NOAC/DOAC)
13.2.2. Heparins
13.2.3. Direct Thrombin Inhibitors
13.2.4. Vitamin K Antagonists
13.3. Market Value Forecast, by Route of Administration, 2017–2031
13.3.1. Oral
13.3.2. Injectable
13.4. Market Value Forecast, by Indication, 2017–2031
13.4.1. Deep Vein Thrombosis
13.4.2. Pulmonary Embolism
13.4.3. Atrial Fibrillation & Heart Attack
13.4.4. Ischemic Stroke
13.4.5. Others
13.5. Market Value Forecast, by Distribution Channel, 2017–2031
13.5.1. Hospital Pharmacies
13.5.2. Retail Pharmacies
13.5.3. Online Pharmacies
13.6. Market Value Forecast, by Country/Sub-region, 2017–2031
13.6.1. China
13.6.2. Japan
13.6.3. India
13.6.4. Australia & New Zealand
13.6.5. Rest of Asia Pacific
13.7. Market Attractiveness Analysis
13.7.1. By Drug Class
13.7.2. By Route of Administration
13.7.3. By Indication
13.7.4. By Distribution Channel
13.7.5. By Country/Sub-region
14. Latin America Anticoagulants Market Analysis and Forecast
14.1. Introduction
14.1.1. Key Findings
14.2. Market Value Forecast, by Drug Class, 2017–2031
14.2.1. Factor XA Inhibitors (NOAC/DOAC)
14.2.2. Heparins
14.2.3. Direct Thrombin Inhibitors
14.2.4. Vitamin K Antagonists
14.3. Market Value Forecast, by Route of Administration, 2017–2031
14.3.1. Oral
14.3.2. Injectable
14.4. Market Value Forecast, by Indication, 2017–2031
14.4.1. Deep Vein Thrombosis
14.4.2. Pulmonary Embolism
14.4.3. Atrial Fibrillation & Heart Attack
14.4.4. Ischemic Stroke
14.4.5. Others
14.5. Market Value Forecast, by Distribution Channel, 2017–2031
14.5.1. Hospital Pharmacies
14.5.2. Retail Pharmacies
14.5.3. Online Pharmacies
14.6. Market Value Forecast, by Country/Sub-region, 2017–2031
14.6.1. Brazil
14.6.2. Mexico
14.6.3. Rest of Latin America
14.7. Market Attractiveness Analysis
14.7.1. By Drug Class
14.7.2. By Route of Administration
14.7.3. By Indication
14.7.4. By Distribution Channel
14.7.5. By Country/Sub-region
15. Middle East & Africa Anticoagulants Market Analysis and Forecast
15.1. Introduction
15.1.1. Key Findings
15.2. Market Value Forecast, by Drug Class, 2017–2031
15.2.1. Factor XA Inhibitors (NOAC/DOAC)
15.2.2. Heparins
15.2.3. Direct Thrombin Inhibitors
15.2.4. Vitamin K Antagonists
15.3. Market Value Forecast, by Route of Administration, 2017–2031
15.3.1. Oral
15.3.2. Injectable
15.4. Market Value Forecast, by Indication, 2017–2031
15.4.1. Deep Vein Thrombosis
15.4.2. Pulmonary Embolism
15.4.3. Atrial Fibrillation & Heart Attack
15.4.4. Ischemic Stroke
15.4.5. Others
15.5. Market Value Forecast, by Distribution Channel, 2017–2031
15.5.1. Hospital Pharmacies
15.5.2. Retail Pharmacies
15.5.3. Online Pharmacies
15.6. Market Value Forecast, by Country/Sub-region, 2017–2031
15.6.1. GCC Countries
15.6.2. South Africa
15.6.3. Rest of Middle East & Africa
15.7. Market Attractiveness Analysis
15.7.1. By Drug Class
15.7.2. By Route of Administration
15.7.3. By Indication
15.7.4. By Distribution Channel
15.7.5. By Country/Sub-region
16. Competition Landscape
16.1. Market Player - Competition Matrix (by tier and size of companies)
16.2. Market Share/Ranking Analysis, by Company, 2021
16.3. Company Profiles
16.3.1. Bayer AG
16.3.1.1. Company Overview
16.3.1.2. Product Portfolio
16.3.1.3. SWOT Analysis
16.3.1.4. Strategic Overview
16.3.2. Boehringer Ingelheim International GmbH
16.3.2.1. Company Overview
16.3.2.2. Product Portfolio
16.3.2.3. SWOT Analysis
16.3.2.4. Strategic Overview
16.3.3. Bristol Myers Squibb
16.3.3.1. Company Overview
16.3.3.2. Product Portfolio
16.3.3.3. SWOT Analysis
16.3.3.4. Strategic Overview
16.3.4. Daiichi Sankyo Company
16.3.4.1. Company Overview
16.3.4.2. Product Portfolio
16.3.4.3. SWOT Analysis
16.3.4.4. Strategic Overview
16.3.5. Sanofi
16.3.5.1. Company Overview
16.3.5.2. Product Portfolio
16.3.5.3. SWOT Analysis
16.3.5.4. Strategic Overview
16.3.6. Johnson & Johnson
16.3.6.1. Company Overview
16.3.6.2. Product Portfolio
16.3.6.3. SWOT Analysis
16.3.6.4. Strategic Overview
16.3.7. Pfizer, Inc.
16.3.7.1. Company Overview
16.3.7.2. Product Portfolio
16.3.7.3. SWOT Analysis
16.3.7.4. Strategic Overview
List of Tables
Table 01: Global Anticoagulants Market Value (US$ Bn) Forecast, by Route of Administration, 2017-2031
Table 02: Global Anticoagulants Market Value (US$ Bn) Forecast, by Drug Class, 2017-2031
Table 03: Global Anticoagulants Market Value (US$ Bn) Forecast, by Indication, 2017-2031
Table 04: Global Anticoagulants Market Value (US$ Bn) Forecast, by Distribution Channel, 2017-2031
Table 05: Global Anticoagulants Market Size (US$ Bn) and Volume (Units) Forecast, by Region, 2017-2031
Table 06: North America Anticoagulants Market Value (US$ Bn) Forecast, by Country, 2017-2031
Table 07: North America Anticoagulants Market Value (US$ Bn) Forecast, by Route of Administration, 2017-2031
Table 08: North America Anticoagulants Market Value (US$ Bn) Forecast, by Drug Class, 2017-2031
Table 09: North America Anticoagulants Market Value (US$ Bn) Forecast, by Indication, 2017-2031
Table 10: North America Anticoagulants Market Value (US$ Bn) Forecast, by Distribution Channel, 2017-2031
Table 11: Europe Anticoagulants Size Value (US$ Bn) Forecast, by Country/Sub-region, 2017-2031
Table 12: Europe Anticoagulants Market Value (US$ Bn) Forecast, by Route of Administration, 2017-2031
Table 13: Europe Anticoagulants Market Value (US$ Bn) Forecast, by Drug Class, 2017-2031
Table 14: Europe Anticoagulants Market Value (US$ Bn) Forecast, by Indication, 2017-2031
Table 15: Europe Anticoagulants Market Value (US$ Bn) Forecast, by Distribution Channel, 2017-2031
Table 16: Asia Pacific Anticoagulants Size Value (US$ Bn) Forecast, by Country/Sub-region, 2017-2031
Table 17: Asia Pacific Anticoagulants Market Value (US$ Bn) Forecast, by Route of Administration, 2017-2031
Table 18: Asia Pacific Anticoagulants Market Value (US$ Bn) Forecast, by Drug Class, 2017-2031
Table 19: Asia Pacific Anticoagulants Market Value (US$ Bn) Forecast, by Indication, 2017-2031
Table 20: Asia Pacific Anticoagulants Market Value (US$ Bn) Forecast, by Distribution Channel, 2017-2031
Table 21: Latin America Anticoagulants Size Value (US$ Bn) Forecast, by Country/Sub-region, 2017-2031
Table 22: Latin America Anticoagulants Market Value (US$ Bn) Forecast, by Route of Administration, 2017-2031
Table 23: Latin America Anticoagulants Market Value (US$ Bn) Forecast, by Drug Class, 2017-2031
Table 24: Latin America Anticoagulants Market Value (US$ Bn) Forecast, by Indication, 2017-2031
Table 25: Latin America Anticoagulants Market Value (US$ Bn) Forecast, by Distribution Channel, 2017-2031
Table 26: Middle East & Africa Anticoagulants Size Value (US$ Bn) Forecast, by Country/Sub-region, 2017-2031
Table 27: Middle East & Africa Anticoagulants Market Value (US$ Bn) Forecast, by Route of Administration, 2017-2031
Table 28: Middle East & Africa Anticoagulants Market Value (US$ Bn) Forecast, by Drug Class, 2017-2031
Table 29: Middle East & Africa Anticoagulants Market Value (US$ Bn) Forecast, by Indication, 2017-2031
Table 30: Middle East & Africa Anticoagulants Market Value (US$ Bn) Forecast, by Distribution Channel, 2017-2031
List of Figures
Figure 01: Global Anticoagulants Market Snapshot
Figure 02: Global Anticoagulants Market Segments With Leading Market Share (%), 2021
Figure 03: Key Industry Developments (Anticoagulants Market)
Figure 04: Global Anticoagulants Market Value (US$ Bn) Forecast, 2017‒2027
Figure 05: Global Anticoagulants Market Value Share Analysis (%), by Drug Class, 2021
Figure 06: Global Anticoagulants Market Value Share Analysis (%), by Route of Administration, 2021
Figure 07: Global Anticoagulants Market Value Share Analysis (%), by Indication, 2021
Figure 08: Global Anticoagulants Market Value Share Analysis (%), by Distribution Channel, 2021
Figure 09: Global Anticoagulants Market Value Share Analysis (%), by Region, 2021
Figure 10: Global Anticoagulants Market Value Share Analysis, by Drug Class, 2021 and 2031
Figure 11: Global Anticoagulants Market Attractiveness Analysis, by Drug Class, 2022–2031
Figure 12: Global Anticoagulants Market Value Share Analysis, by Route of Administration, 2021 and 2031
Figure 13: Global Anticoagulants Market Attractiveness Analysis, by Route of Administration, 2022–2031
Figure 14: Global Anticoagulants Market Value Share Analysis, by Indication, 2021 and 2031
Figure 15: Global Anticoagulants Market Attractiveness Analysis, by Indication, 2022–2031
Figure 16: Global Anticoagulants Market Value Share Analysis, by Distribution Channel, 2021 and 2031
Figure 17: Global Anticoagulants Market Attractiveness Analysis, by Distribution Channel, 2022–2031
Figure 18: Global Anticoagulants Market Value Share Analysis, by Region, 2021 and 2031
Figure 19: Global Anticoagulants Market Attractiveness Analysis, by Region, 2017-2031
Figure 20: North America Anticoagulants Market Value (US$ Bn) and Y-o-Y Growth (%) Forecast, 2017–2031
Figure 21: North America Anticoagulants Market Value Share Analysis (%), by Drug Class, 2021 and 2031
Figure 22: North America Anticoagulants Market Attractiveness Analysis, by Drug Class, 2022–2031
Figure 23: North America Anticoagulants Market Value Share Analysis (%), by Route of Administration, 2021 and 2031
Figure 24: North America Anticoagulants Market Attractiveness Analysis, by Route of Administration, 2022–2031
Figure 25: North America Anticoagulants Market Value Share Analysis (%), by Indication, 2021 and 2031
Figure 26: North America Anticoagulants Market Attractiveness Analysis, by Indication, 2022–2031
Figure 27: North America Anticoagulants Market Value Share Analysis (%), by Distribution Channel, 2021 and 2031
Figure 28: North America Anticoagulants Market Attractiveness Analysis, by Distribution Channel, 2022–2031
Figure 29: North America Anticoagulants Market Value Share Analysis (%), by Country, 2021 and 2031
Figure 30: North America Anticoagulants Market Attractiveness Analysis, by Country, 2021 and 2031
Figure 31: Europe Anticoagulants Market Value (US$ Bn) and Y-o-Y Growth (%) Forecast, 2017–2031
Figure 32: Europe Anticoagulants Market Value Share Analysis (%), by Drug Class, 2021 and 2031
Figure 33: Europe Anticoagulants Market Attractiveness Analysis, by Drug Class, 2022–2031
Figure 34: Europe Anticoagulants Market Value Share Analysis (%), by Route of Administration, 2021 and 2031
Figure 35: Europe Anticoagulants Market Attractiveness Analysis, by Route of Administration, 2022–2031
Figure 36: Europe Anticoagulants Market Value Share Analysis (%), by Indication, 2021 and 2031
Figure 37: Europe Anticoagulants Market Attractiveness Analysis, by Indication, 2022–2031
Figure 38: Europe Anticoagulants Market Value Share Analysis (%), by Distribution Channel, 2021 and 2031
Figure 39: Europe Anticoagulants Market Attractiveness Analysis, by Distribution Channel, 2022–2031
Figure 40: Europe Anticoagulants Market Value Share Analysis (%), by Country/Sub-region, 2021 and 2031
Figure 41: Europe Anticoagulants Market Attractiveness Analysis, by Country/Sub-region, 2022–2031
Figure 42: Asia Pacific Anticoagulants Market Value (US$ Bn) and Y-o-Y Growth (%) Forecast, 2017–2031
Figure 43: Asia Pacific Anticoagulants Market Value Share Analysis (%), by Drug Class, 2021 and 2031
Figure 44: Asia Pacific Anticoagulants Market Attractiveness Analysis, by Drug Class, 2022–2031
Figure 45: Asia Pacific Anticoagulants Market Value Share Analysis (%), by Route of Administration, 2021 and 2031
Figure 46: Asia Pacific Anticoagulants Market Attractiveness Analysis, by Route of Administration, 2022–2031
Figure 47: Asia Pacific Anticoagulants Market Value Share Analysis (%), by Indication, 2021 and 2031
Figure 48: Asia Pacific Anticoagulants Market Attractiveness Analysis, by Indication, 2022–2031
Figure 49: Asia Pacific Anticoagulants Value Share Analysis (%), by Distribution Channel, 2021 and 2031
Figure 50: Asia Pacific Anticoagulants Market Attractiveness Analysis, by Distribution Channel, 2022–2031
Figure 51: Asia Pacific Anticoagulants Market Value Share Analysis (%), by Country/Sub-region, 2021 and 2031
Figure 52: Asia Pacific Anticoagulants Market Attractiveness Analysis, by Country/Sub-region, 2022–2031
Figure 53: Latin America Anticoagulants Market Value (US$ Bn) and Y-o-Y Growth (%) Forecast, 2017–2031
Figure 54: Latin America Anticoagulants Market Value Share Analysis (%), by Drug Class, 2021 and 2031
Figure 55: Latin America Anticoagulants Market Attractiveness Analysis, by Drug Class, 2022–2031
Figure 56: Latin America Anticoagulants Market Value Share Analysis (%), by Route of Administration, 2021 and 2031
Figure 57: Latin America Anticoagulants Market Attractiveness Analysis, by Route of Administration, 2022–2031
Figure 58: Latin America Anticoagulants Market Value Share Analysis (%), by Indication, 2021 and 2031
Figure 59: Latin America Anticoagulants Market Attractiveness Analysis, by Indication, 2022–2031
Figure 60: Latin America Anticoagulants Value Share Analysis (%), by Distribution Channel, 2021 and 2031
Figure 61: Latin America Anticoagulants Market Attractiveness Analysis, by Distribution Channel, 2022–2031
Figure 62: Latin America Anticoagulants Market Value Share Analysis (%), by Country/Sub-region, 2021 and 2031
Figure 63: Latin America Anticoagulants Market Attractiveness Analysis, by Country/Sub-region, 2022–2031
Figure 64: Middle East & Africa Anticoagulants Market Value (US$ Bn) and Y-o-Y Growth (%) Forecast, 2017–2031
Figure 65: Middle East & Africa Anticoagulants Market Value Share Analysis (%), by Drug Class, 2021 and 2031
Figure 66: Middle East & Africa Anticoagulants Market Attractiveness Analysis, by Drug Class, 2022–2031
Figure 67: Middle East & Africa Anticoagulants Market Value Share Analysis (%), by Route of Administration, 2021 and 2031
Figure 68: Middle East & Africa Anticoagulants Market Attractiveness Analysis, by Route of Administration, 2022–2031
Figure 69: Middle East & Africa Anticoagulants Market Value Share Analysis (%), by Indication, 2021 and 2031
Figure 70: Middle East & Africa Anticoagulants Value Share Analysis (%), by Distribution Channel, 2021 and 2031
Figure 71: Middle East & Africa Anticoagulants Market Attractiveness Analysis, by Distribution Channel, 2022–2031
Figure 72: Middle East & Africa Anticoagulants Market Value Share Analysis (%), by Country/Sub-region, 2021 and 2031
Figure 73: Middle East & Africa Anticoagulants Market Attractiveness Analysis, by Country/Sub-region, 2022–2031
Copyright © Transparency Market Research, Inc. All Rights reserved
Trust Online

Anticoagulants Market