
Reports
Reports
Global Anti-reflective Glass Coatings Market: Snapshot
In order to steal a march over their competitors, savvy manufacturers in the global anti-reflective glass coatings market are seen banking on product development. To that end they are investing in research and development and also expanding their plants. They are also partnering with suppliers to boost their positions.
Some of the main drivers of growth in the global anti-reflective glass coatings market are projector lenses, consumer electronics, construction, telecommunications, and eyewear industry. The high level of durability of anti-reflective glass is serving to boost their uptake in automobile and solar power industries as well. Dampening their demand, on the other hand, is the stringent norms pertaining to the raw materials used in formulating anti-reflective coatings.
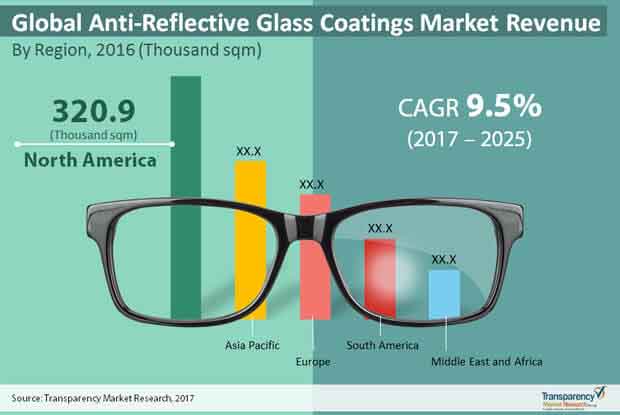
A report by Transparency Market Research predicts the volume in the global anti-reflective coatings market to expand at a CAGR of 9.5% during the period between 2017 and 2025. Rising at this pace, the market is expected to become 1,790.5 square meter by 2025.
Physical Vapor Deposition Technology Seeing Widespread Use in Anti-reflective Coatings
Depending upon technology, the global anti-reflective coatings market can be broadly categorized into physical vapor deposition and chemical vapor deposition. Of them, the physical vapor deposition segment accounts for maximum share in the market. In the years ahead too, the segment is predicted to retain its leading share on account of its widespread use in anti-reflective coatings. It includes electron beam evaporation method, ion beam sputtering, ion plating, ion implantation, etc. Sputtering technology is expected to witness significant growth over the forecast period on account of its superior mechanical and environmental durability along with improved precision and absorption.
The two main application areas of anti-reflective coatings market are large area glass coatings and small batch coated lenses. The large area glass coatings can be further segmented into picture frames, electronic displays, refrigerated displays, solar, automotive, and others such as architecture and museum show cases. The solar sector primarily powering growth in the large areas glass coatings market and will likely continue its dominance in the future as well. The small batch coated can also be further divided into eye glasses, optics, etc.
Demand for Innovative Products Boosts North America Market
From a geographical standpoint, North America accounts for maximum market share in the global anti-reflective coatings market, which it is expected to hold on to in the next couple of years. Growing demand for innovative products in anti-reflective coatings and subsequent investments by manufacturers in research and development are serving to catalyze growth in the market in the region. In April 2017, for example, DSM unveiled an anti-soiling coating for the solar glass which helps to lower damages from dirt and dust. By clocking a healthy 9.7% CAGR from 2017 to 2025, the volume in the market is predicted to reach 670.8 square meter.
Asia Pacific trails North America market in terms of volume. By registering maximum CAGR of 9.8% in the forecast period, the volume in the market is expected to become 440.3 square meter by 2025. Increasing demand for anti-reflective coatings from the electronic industry, mainly in the fast-expanding large economies of China and India, is proving to be a boon for the market in the region.
Europe is another key market for anti-reflective glass coatings on account of thrust on energy efficiency in the region. The Middle East and Africa and South America collectively accounted for about 20% in 2016.
Some of the key players in the market are Anthony International, Guardian Glass, Falkberg, Schott AG, Saint Gobain, Honeywell, PPG, Truvue, and DSM.
Rising Innovations in Optical Sector to Bolster Growth of Anti-Reflective Glass Coatings Market
The worldwide enemy of intelligent coatings market is projected to highlight generous development in the approaching years. This is because of rising interest for hostile to intelligent and antiglare focal points and eyewear. The antiglare focal points and eyewear are created by layering the glass surface with an enemy of intelligent covering. This covering helps to eliminate back glare, flood in dispersion and brings down the glare. Rising application in sun oriented, electrical, optical, and electronic utilizations is projected to drive the counter intelligent coatings market development in the impending years.
The counter intelligent coatings publicize is driven by the creating utilization of the item in optical and electronic uses. These focal points increase the profitability and improve nature of photos of a few devices, for instance, screens and TV screens. The creating semiconductor and electronic area just as the rising interest for cell phones and level board presentations will support interest in the moving toward years.
Some of the primary drivers of development in the worldwide anti-reflective glass coatings market are projector focal points, shopper gadgets, development, media communications, and eyewear industry. The significant degree of solidness of anti-reflective glass is serving to support their take-up in auto and sunlight based force businesses too. Hosing their interest, then again, is the rigid standards relating to the crude materials utilized in detailing anti-reflective coatings.
The rising demand for anti-reflective and antiglare lenses and eyewear will further propel growth of this market. The antiglare lenses and eyewear are developed by layering the glass surface with an anti-reflective coating. Rising application in solar, electrical, optical, and electronic usages is projected to drive the anti-reflective coatings market growth in the forthcoming years.
The anti-reflective coatings publicize is driven by the creating utilization of the item in optical and electronic uses. These focal points increase the efficiency and improve nature of photos of a few contraptions, for instance, screens and TV screens. The creating semiconductor and electronic area just as the rising interest for cell phones and level board presentations will help interest in the moving toward years.
1. Preface
1.1. Market Definition and Scope
1.2. Market Segmentation
1.3. Key Research Objectives
1.4. Research Highlights
2. Assumptions and Research Methodology
3. Executive Summary : Global Anti-Reflective Glass Coatings Market
4. Market Overview
4.1. Key Developments
4.2. Key Market Indicators
4.3. Key Findings
4.4. Key Trends
4.5. Market Dynamics
4.5.1. Drivers
4.5.2. Restraints
4.5.3. Opportunity
4.6. Global Anti-Reflective Glass Coatings Market Analysis and Forecasts, 2015 – 2025
4.6.1. Anti-Reflective Glass Coatings Market Size (sq. m), 2015 – 2025
4.6.1.1. Large Area Glass Coatings
4.7. Porter’s Five Forces Analysis
4.8. Value Chain Analysis
4.9. Market Outlook
5. Global Anti-Reflective Glass Coatings Market Analysis and Forecasts, By Large Area Coatings
5.1. Market Size (sq. m) Forecast By Large Area Coatings, 2015 - 2025
5.1.1. Picture Frame
5.1.2. Electronic Displays
5.1.3. Refrigerated Displays
5.1.4. Solar
5.1.5. Automotive
5.1.6. Others
6. Global Anti-Reflective Glass Coatings Market Analysis and Forecasts, By Technology
6.1. Market Size (sq. m) Forecast By Technology, 2015 - 2025
6.1.1. Physical Vapor Deposition (PVD)
6.1.2. Chemical Vapor Deposition (CVD)
7. Global Anti-Reflective Glass Coatings Market Analysis and Forecasts, By Region
7.1. Market Size (sq. m) Forecast By Region, 2015 - 2025
7.1.1. North America
7.1.2. Europe
7.1.3. Asia Pacific
7.1.4. Middle East & Africa
7.1.5. South America
8. Global Anti-Reflective Glass Coatings Market Attractiveness Analysis
8.1. By Large Area Coatings
8.2. By Technology
8.3. By Region
9. Global Anti-Reflective Glass Coatings Market Comparison Matrix
9.1. By Large Area Coatings
9.2. By Technology
9.3. By Region
10. North America Anti-Reflective Glass Coatings Market Analysis and Forecasts
10.1. Market Analysis (sq. m) Forecast, By Large Area Coatings, 2015 - 2025
10.1.1. Picture Frame
10.1.2. Electronic Displays
10.1.3. Refrigerated Displays
10.1.4. Solar
10.1.5. Automotive
10.1.6. Others
10.2. Market Size (sq. m) Forecast By Technology, 2015 - 2025
10.2.1. Physical Vapor Deposition (PVD)
10.2.2. Chemical Vapor Deposition (CVD)
10.3. Market Analysis (sq. m) Forecast, By Country, 2015 – 2025
10.3.1. The U.S.
10.3.2. Canada
10.3.3. Mexico
10.4. Market Attractiveness Analysis
10.4.1. By Large Area Coatings
10.4.2. By Technology
10.4.3. By Country
11. The U.S. Anti-Reflective Glass Coatings Market Analysis and Forecasts
11.1. Market Analysis (sq. m) Forecast, By Large Area Coatings, 2015 - 2025
11.1.1. Picture Frame
11.1.2. Electronic Displays
11.1.3. Refrigerated Displays
11.1.4. Solar
11.1.5. Automotive
11.1.6. Others
11.2. Market Size (sq. m) Forecast By Technology, 2015 - 2025
11.2.1. Physical Vapor Deposition (PVD)
11.2.2. Chemical Vapor Deposition (CVD)
11.3. Market Attractiveness Analysis
11.3.1. By Large Area Coatings
11.3.2. By Technology
12. Europe Anti-Reflective Glass Coatings Market Analysis and Forecasts
12.1. Market Analysis (sq. m) Forecast, By Large Area Coatings, 2015 - 2025
12.1.1. Picture Frame
12.1.2. Electronic Displays
12.1.3. Refrigerated Displays
12.1.4. Solar
12.1.5. Automotive
12.1.6. Others
12.2. Market Size (sq. m) Forecast By Technology, 2015 - 2025
12.2.1. Physical Vapor Deposition (PVD)
12.2.2. Chemical Vapor Deposition (CVD)
12.3. Market Analysis (sq. m) Forecast, By Country, 2015 – 2025
12.3.1. Germany
12.3.2. U.K.
12.3.3. Rest of Europe (Italy, France, Russia etc.)
12.4. Market Attractiveness Analysis
12.4.1. By Large Area Coatings
12.4.2. By Technology
12.4.3. By Country
13. Germany Anti-Reflective Glass Coatings Market Analysis and Forecasts
13.1. Market Analysis (sq. m) Forecast, By Large Area Coatings, 2015 - 2025
13.1.1. Picture Frame
13.1.2. Electronic Displays
13.1.3. Refrigerated Displays
13.1.4. Solar
13.1.5. Automotive
13.1.6. Others
13.2. Market Size (sq. m) Forecast By Technology, 2015 - 2025
13.2.1. Physical Vapor Deposition (PVD)
13.2.2. Chemical Vapor Deposition (CVD)
13.3. Market Attractiveness Analysis
13.3.1. By Large Area Coatings
13.3.2. By Technology
14. UK Anti-Reflective Glass Coatings Market Analysis and Forecasts
14.1. Market Analysis (sq. m) Forecast, By Large Area Coatings, 2015 - 2025
14.1.1. Picture Frame
14.1.2. Electronic Displays
14.1.3. Refrigerated Displays
14.1.4. Solar
14.1.5. Automotive
14.1.6. Others
14.2. Market Size (sq. m) Forecast By Technology, 2015 - 2025
14.2.1. Physical Vapor Deposition (PVD)
14.2.2. Chemical Vapor Deposition (CVD)
14.3. Market Attractiveness Analysis
14.3.1. By Large Area Coatings
14.3.2. By Technology
15. Asia Pacific Anti-Reflective Glass Coatings Market Analysis and Forecasts
15.1. Market Analysis (sq. m) Forecast, By Large Area Coatings, 2015 - 2025
15.1.1. Picture Frame
15.1.2. Electronic Displays
15.1.3. Refrigerated Displays
15.1.4. Solar
15.1.5. Automotive
15.1.6. Others
15.2. Market Size (sq. m) Forecast By Technology, 2015 - 2025
15.2.1. Physical Vapor Deposition (PVD)
15.2.2. Chemical Vapor Deposition (CVD)
15.3. Market Analysis (sq. m) Forecast, By Country, 2015 – 2025
15.3.1. China
15.3.2. India
15.3.3. Rest of Asia Pacific (Japan, Australia, South Korea, etc.)
15.4. Market Attractiveness Analysis
15.4.1. By Large Area Coatings
15.4.2. By Technology
15.4.3. By Country
16. China Anti-Reflective Glass Coatings Market Analysis and Forecasts
16.1. Market Analysis (sq. m) Forecast, By Large Area Coatings, 2015 - 2025
16.1.1. Picture Frame
16.1.2. Electronic Displays
16.1.3. Refrigerated Displays
16.1.4. Solar
16.1.5. Automotive
16.1.6. Others
16.2. Market Size (sq. m) Forecast By Technology, 2015 - 2025
16.2.1. Physical Vapor Deposition (PVD)
16.2.2. Chemical Vapor Deposition (CVD)
16.3. Market Attractiveness Analysis
16.3.1. By Large Area Coatings
16.3.2. By Technology
17. India Anti-Reflective Glass Coatings Market Analysis and Forecasts
17.1. Market Analysis (sq. m) Forecast, By Large Area Coatings, 2015 - 2025
17.1.1. Picture Frame
17.1.2. Electronic Displays
17.1.3. Refrigerated Displays
17.1.4. Solar
17.1.5. Automotive
17.1.6. Others
17.2. Market Size (sq. m) Forecast By Technology, 2015 - 2025
17.2.1. Physical Vapor Deposition (PVD)
17.2.2. Chemical Vapor Deposition (CVD)
17.3. Market Attractiveness Analysis
17.3.1. By Large Area Coatings
17.3.2. By Technology
18. Middle East & Africa Anti-Reflective Glass Coatings Market Analysis and Forecasts
18.1. Market Analysis (sq. m) Forecast, By Large Area Coatings, 2015 - 2025
18.1.1. Picture Frame
18.1.2. Electronic Displays
18.1.3. Refrigerated Displays
18.1.4. Solar
18.1.5. Automotive
18.1.6. Others
18.2. Market Size (sq. m) Forecast By Technology, 2015 - 2025
18.2.1. Physical Vapor Deposition (PVD)
18.2.2. Chemical Vapor Deposition (CVD)
18.3. Market Analysis (sq. m) Forecast, By Country, 2015 – 2025
18.3.1. Saudi Arabia
18.3.2. UAE
18.3.3. Rest of MEA
18.4. Market Attractiveness Analysis
18.4.1. By Large Area Coatings
18.4.2. By Technology
18.4.3. By Country
19. Saudi Arabia Anti-Reflective Glass Coatings Market Analysis and Forecasts
19.1. Market Analysis (sq. m) Forecast, By Large Area Coatings, 2015 - 2025
19.1.1. Picture Frame
19.1.2. Electronic Displays
19.1.3. Refrigerated Displays
19.1.4. Solar
19.1.5. Automotive
19.1.6. Others
19.2. Market Size (sq. m) Forecast By Technology, 2015 - 2025
19.2.1. Physical Vapor Deposition (PVD)
19.2.2. Chemical Vapor Deposition (CVD)
19.3. Market Attractiveness Analysis
19.3.1. By Large Area Coatings
19.3.2. By Technology
20. UAE Anti-Reflective Glass Coatings Market Analysis and Forecasts
20.1. Market Analysis (sq. m) Forecast, By Large Area Coatings, 2015 - 2025
20.1.1. Picture Frame
20.1.2. Electronic Displays
20.1.3. Refrigerated Displays
20.1.4. Solar
20.1.5. Automotive
20.1.6. Others
20.2. Market Size (sq. m) Forecast By Technology, 2015 - 2025
20.2.1. Physical Vapor Deposition (PVD)
20.2.2. Chemical Vapor Deposition (CVD)
20.3. Market Attractiveness Analysis
20.3.1. By Large Area Coatings
20.3.2. By Technology
21. South America Anti-Reflective Glass Coatings Market Analysis and Forecasts
21.1. Market Analysis (sq. m) Forecast, By Large Area Coatings, 2015 - 2025
21.1.1. Picture Frame
21.1.2. Electronic Displays
21.1.3. Refrigerated Displays
21.1.4. Solar
21.1.5. Automotive
21.1.6. Others
21.2. Market Size (sq. m) Forecast By Technology, 2015 - 2025
21.2.1. Physical Vapor Deposition (PVD)
21.2.2. Chemical Vapor Deposition (CVD)
21.3. Market Analysis (sq. m) Forecast, By Country, 2015 – 2025
21.3.1. Brazil
21.3.2. Rest of South America
21.4. Market Attractiveness Analysis
21.4.1. By Large Area Coatings
21.4.2. By Technology
21.4.3. By Country
22. Brazil Anti-Reflective Glass Coatings Market Analysis and Forecasts
22.1. Market Analysis (sq. m) Forecast, By Large Area Coatings, 2015 - 2025
22.1.1. Picture Frame
22.1.2. Electronic Displays
22.1.3. Refrigerated Displays
22.1.4. Solar
22.1.5. Automotive
22.1.6. Others
22.2. Market Size (sq. m) Forecast By Technology, 2015 - 2025
22.2.1. Physical Vapor Deposition (PVD)
22.2.2. Chemical Vapor Deposition (CVD)
22.3. Market Attractiveness Analysis
22.3.1. By Large Area Coatings
22.3.2. By Technology
23. Competition Landscape
23.1. Competition Matrix
23.2. Market Share Analysis By Company (2016)
23.2.1. Market Share
23.2.2. sq. m estimates
23.3. Strategic Outlook
23.4. Glass Coatings Market SWOT Analysis
23.5. Company Profiles (Overview, Financials)
23.5.1. Glass Coatings Companies
23.5.1.1. Advenira Enterprises
23.5.1.2. DuPont
23.5.1.3. Evaporated Coatings Inc.
23.5.1.4. Groglass
23.5.1.5. Honeywell International
23.5.1.6. iCoat Company
23.5.1.7. Majestic Optical Coatings
23.5.1.8. Optics Balzers AG
23.5.1.9. Optitune
23.5.1.10. PPG Industries
23.5.1.11. Präzisions Glas & Optik GmbH
23.5.1.12. Quantum Coating inc.
23.5.1.13. DSM
23.5.1.14. Torr Scientific Ltd
23.5.2. Glass Processors
23.5.2.1. Asahi India Glass Limited
23.5.2.2. Zeiss International
23.5.2.3. Essilor
23.5.2.4. Viridian (JV with Euroglass)
23.5.2.5. Guardian Glass
23.5.2.6. Hoya Corporation
23.5.2.7. Janos Technology LLC
23.5.2.8. Tru Vue Inc.
23.5.2.9. Rodenstock
23.5.2.10. Schott AG
23.5.3. Distributors
23.5.3.1. Wessex Pictures
24. Key Takeaway
List of Tables
Table 1: Global Anti-Reflective Glass Coatings Market Revenue (Thousand Sq m) Forecast and CAGR, By Application, 2015–2025
Table 2: Global Anti-Reflective Glass Coatings Market Revenue (Thousand Sq m) Forecast and CAGR, By Large Area Glass Coatings, 2015–2025
Table 3: Global Anti-Reflective Glass Coatings Market Revenue (Thousand Sq m) Forecast and CAGR, By Technology, 2015–2025
Table 4: Global Anti-Reflective Glass Coatings Market Revenue (Thousand Sq m) Forecast and CAGR, By Region, 2015–2025
Table 5: North America Anti-Reflective Glass Coatings Market Revenue (Thousand Sq m) Forecast and CAGR, By Application, 2015–2025
Table 6: North America Anti-Reflective Glass Coatings Market Revenue (Thousand Sq m) Forecast and CAGR, By Large Area Glass Coatings, 2015–2025
Table 7: North America Anti-Reflective Glass Coatings Market Revenue (Thousand Sq m) Forecast and CAGR, By Technology, 2015–2025
Table 8: North America Anti-Reflective Glass Coatings Market Revenue (Thousand Sq m) Forecast and CAGR, By Country, 2015–2025
Table 9: US Anti-Reflective Glass Coatings Market Revenue (Thousand Sq m) Forecast and CAGR, By Large Area Glass Coatings, 2015–2025
Table 10: US Anti-Reflective Glass Coatings Market Revenue (Thousand Sq m) Forecast and CAGR, By Technology, 2015–2025
Table 11: Europe Anti-Reflective Glass Coatings Market Revenue (Thousand Sq m) Forecast and CAGR, By Application, 2015–2025
Table 12: Europe Anti-Reflective Glass Coatings Market Revenue (Thousand Sq m) Forecast and CAGR, By Large Area Glass Coatings, 2015–2025
Table 13: Europe Anti-Reflective Glass Coatings Market Revenue (Thousand Sq m) Forecast and CAGR, By Technology, 2015–2025
Table 14: Europe Anti-Reflective Glass Coatings Market Revenue (Thousand Sq m) Forecast and CAGR, By Country, 2015–2025
Table 15: Germany Anti-Reflective Glass Coatings Market Revenue (Thousand Sq m) Forecast and CAGR, By Large Area Glass Coatings, 2015–2025
Table 16: Germany Anti-Reflective Glass Coatings Market Revenue (Thousand Sq m) Forecast and CAGR, By Technology, 2015–2025
Table 15: UK Anti-Reflective Glass Coatings Market Revenue (Thousand Sq m) Forecast and CAGR, By Large Area Glass Coatings, 2015–2025
Table 16: UK Anti-Reflective Glass Coatings Market Revenue (Thousand Sq m) Forecast and CAGR, By Technology, 2015–2025
Table 17: APAC Anti-Reflective Glass Coatings Market Revenue (Thousand Sq m) Forecast and CAGR, By Application, 2015–2025
Table 18: APAC Anti-Reflective Glass Coatings Market Revenue (Thousand Sq m) Forecast and CAGR, By Large Area Glass Coatings, 2015–2025
Table 19: APAC Anti-Reflective Glass Coatings Market Revenue (Thousand Sq m) Forecast and CAGR, By Technology, 2015–2025
Table 30: APAC Anti-Reflective Glass Coatings Market Revenue (Thousand Sq m) Forecast and CAGR, By Country, 2015–2025
Table 20: China Anti-Reflective Glass Coatings Market Revenue (Thousand Sq m) Forecast and CAGR, By Large Area Glass Coatings, 2015–2025
Table 21: China Anti-Reflective Glass Coatings Market Revenue (Thousand Sq m) Forecast and CAGR, By Technology, 2015–2025
Table 22: India Anti-Reflective Glass Coatings Market Revenue (Thousand Sq m) Forecast and CAGR, By Large Area Glass Coatings, 2015–2025
Table 23: India Anti-Reflective Glass Coatings Market Revenue (Thousand Sq m) Forecast and CAGR, By Technology, 2015–2025
Table 24: MEA Anti-Reflective Glass Coatings Market Revenue (Thousand Sq m) Forecast and CAGR, By Application, 2015–2025
Table 25: MEA Anti-Reflective Glass Coatings Market Revenue (Thousand Sq m) Forecast and CAGR, By Large Area Glass Coatings, 2015–2025
Table 26: MEA Anti-Reflective Glass Coatings Market Revenue (Thousand Sq m) Forecast and CAGR, By Technology, 2015–2025
Table 27: MEA Anti-Reflective Glass Coatings Market Revenue (Thousand Sq m) Forecast and CAGR, By Country, 2015–2025
Table 28: Saudi Arabia Anti-Reflective Glass Coatings Market Revenue (Thousand Sq m) Forecast and CAGR, By Large Area Glass Coatings, 2015–2025
Table 29: Saudi Arabia Anti-Reflective Glass Coatings Market Revenue (Thousand Sq m) Forecast and CAGR, By Technology, 2015–2025
Table 30: UAE Anti-Reflective Glass Coatings Market Revenue (Thousand Sq m) Forecast and CAGR, By Large Area Glass Coatings, 2015–2025
Table 31: UAE Anti-Reflective Glass Coatings Market Revenue (Thousand Sq m) Forecast and CAGR, By Technology, 2015–2025
Table 32: South America Anti-Reflective Glass Coatings Market Revenue (Thousand Sq m) Forecast and CAGR, By Application, 2015–2025
Table 33: South America Anti-Reflective Glass Coatings Market Revenue (Thousand Sq m) Forecast and CAGR, By Large Area Glass Coatings, 2015–2025
Table 34: South America Anti-Reflective Glass Coatings Market Revenue (Thousand Sq m) Forecast and CAGR, By Technology, 2015–2025
Table 35: South America Anti-Reflective Glass Coatings Market Revenue (Thousand Sq m) Forecast and CAGR, By Country, 2015–2025
Table 36: Brazil Anti-Reflective Glass Coatings Market Revenue (Thousand Sq m) Forecast and CAGR, By Large Area Glass Coatings, 2015–2025
Table 37: Brazil Anti-Reflective Glass Coatings Market Revenue (Thousand Sq m) Forecast and CAGR, By Technology, 2015–2025
List of Figures
Figure 1: Calculation of the Global Anti-reflective Coatings Market
Figure 2: Forecast Methodology – Anti-reflective Coatings Market
Figure 3: Anti-reflective Glass Coatings Market Size
Figure 4: Anti-reflective Glass Coatings Market, By Technology (thousand sqm)
Figure 5: Anti-reflective Glass Coatings Market Volume Share by Large Area Glass Coatings, 2017
Figure 6: Anti-reflective glass coatings market developments
Figure 7: Global Glass Production by Type
Figure 8: Market Volume Projections, 2015 – 2025 (Thousand Sq m)
Figure 9: Market Volume Y-o-Y Growth Rate, 2016 – 2025 (%)
Figure 10: Global anti-reflective coatings market value chain analysis
Figure 10: Anti-reflective Coatings Market CAGR (2017-25), By Large Area Glass Coatings
Figure 11: Anti-reflective Coatings Market CAGR (2017-25), By Technology
Figure 12: Anti-reflective Coatings Market CAGR (2017-25), By Geography
Figure 13: Global Anti-Reflective Glass Coatings Market Attractiveness Analysis, By LAGC
Figure 14: Global Anti-Reflective Glass Coatings Market Attractiveness Analysis, By Technology
Figure 15: Global Anti-Reflective Glass Coatings Market Attractiveness Analysis, By Region
Figure 16: Segment Growth Matrix, 2017-25 (%)
Figure 17: Segment Revenue Contribution, 2017-25 (%)
Figure 18: Segment Compounded Growth Matrix (CAGR %)
Figure 19: Segment Growth Matrix, 2017 - 25 (%)
Figure 20: Segment Revenue Contribution, 2017 - 25 (%)
Figure 21: Segment Compounded Growth Matrix (CAGR %)
Figure 22: Segment Growth Matrix, 2017 - 25 (%)
Figure 23: Segment Revenue Contribution, 2017 - 25 (%)
Figure 24: Segment Compounded Growth Matrix (CAGR %)
Figure 25: North America Anti-Reflective Glass Coatings Market Attractiveness Analysis, By LAGC
Figure 26: North America Anti-Reflective Glass Coatings Market Attractiveness Analysis, By Technology
Figure 27: North America Anti-Reflective Glass Coatings Market Attractiveness Analysis, By Country
Figure 28: US Anti-Reflective Glass Coatings Market Attractiveness Analysis, By LAGC
Figure 29: US Anti-Reflective Glass Coatings Market Attractiveness Analysis, By Technology
Figure 30: Europe Anti-Reflective Glass Coatings Market Attractiveness Analysis, By LAGC
Figure 31: Europe Anti-Reflective Glass Coatings Market Attractiveness Analysis, By Technology
Figure 32: Europe Anti-Reflective Glass Coatings Market Attractiveness Analysis, By Country
Figure 33: Germany Anti-Reflective Glass Coatings Market Attractiveness Analysis, By LAGC
Figure 34: Germany Anti-Reflective Glass Coatings Market Attractiveness Analysis, By Technology
Figure 35: UK Anti-Reflective Glass Coatings Market Attractiveness Analysis, By LAGC
Figure 36: UK Anti-Reflective Glass Coatings Market Attractiveness Analysis, By Technology
Figure 35: APAC Anti-Reflective Glass Coatings Market Attractiveness Analysis, By LAGC
Figure 36: APAC Anti-Reflective Glass Coatings Market Attractiveness Analysis, By Technology
Figure 37: APAC Anti-Reflective Glass Coatings Market Attractiveness Analysis, By Country
Figure 38: China Anti-Reflective Glass Coatings Market Attractiveness Analysis, By LAGC
Figure 39: China Anti-Reflective Glass Coatings Market Attractiveness Analysis, By Technology
Figure 40: India Anti-Reflective Glass Coatings Market Attractiveness Analysis, By LAGC
Figure 41: India Anti-Reflective Glass Coatings Market Attractiveness Analysis, By Technology
Figure 42: MEA Anti-Reflective Glass Coatings Market Attractiveness Analysis, By LAGC
Figure 43: MEA Anti-Reflective Glass Coatings Market Attractiveness Analysis, By Technology
Figure 44: MEA Anti-Reflective Glass Coatings Market Attractiveness Analysis, By Country
Figure 45: Saudi Arabia Anti-Reflective Glass Coatings Market Attractiveness Analysis, By LAGC
Figure 46: Saudi Arabia Anti-Reflective Glass Coatings Market Attractiveness Analysis, By Technology
Figure 47: UAE Anti-Reflective Glass Coatings Market Attractiveness Analysis, By LAGC
Figure 48: UAE Anti-Reflective Glass Coatings Market Attractiveness Analysis, By Technology
Figure 49: South America Anti-Reflective Glass Coatings Market Attractiveness Analysis, By LAGC
Figure 50: South America Anti-Reflective Glass Coatings Market Attractiveness Analysis, By Technology
Figure 51: South America Anti-Reflective Glass Coatings Market Attractiveness Analysis, By Country
Figure 52: Brazil Anti-Reflective Glass Coatings Market Attractiveness Analysis, By LAGC
Figure 53: Brazil Anti-Reflective Glass Coatings Market Attractiveness Analysis, By Technology
Figure 54: Anti-Reflective Glass Coatings Market Revenue Share Analysis (2016)
Figure 55: Anti-Reflective Glass Coatings Market Revenue Share Analysis (2016)Figure 56: Revenue (US$ Mn) & Y-o-Y Growth (%), 2014–2016
Figure 57: Breakdown of Net Sales, by Geography, 2016
Figure 58: Key Financial Indicators, 2015- 2016
Figure 59: Revenue (US$ Mn) & Y-o-Y Growth (%), 2014–2016
Figure 60: Breakdown of Net Sales, by Geography, 2016
Figure 62: Revenue (US$ Mn) & Y-o-Y Growth (%), 2014–2016
Figure 63: Breakdown of Net Sales, by Geography, 2016
Figure 64: Key Financial Indicators, 2015- 2016
Figure 65: Revenue (US$ Mn) & Y-o-Y Growth (%), 2014–2016
Figure 66: Breakdown of Net Sales, by Geography, 2016
Figure 67: Key Financial Indicators, 2015- 2016
Figure 68: Revenue (US$ Mn) & Y-o-Y Growth (%), 2015–2017
Figure 69: Breakdown of Net Sales, by Geography, 2016
Figure 70: Key Financial Indicators, 2015- 2016
Figure 71: Revenue (US$ Mn) & Y-o-Y Growth (%), 2014–2016
Figure 72: Breakdown of Net Sales, by Geography, 2016
Figure 73: Key Financial Indicators, 2015- 2016
Figure 74: Revenue (US$ Mn) & Y-o-Y Growth (%), 2014–2016
Figure 75: Breakdown of Net Sales, By Geography, 2016
Figure 76: Key Financial Indicators, 2015- 2016
Copyright © Transparency Market Research, Inc. All Rights reserved
Trust Online

Anti-Reflective Glass Coatings Market