
Reports
Reports
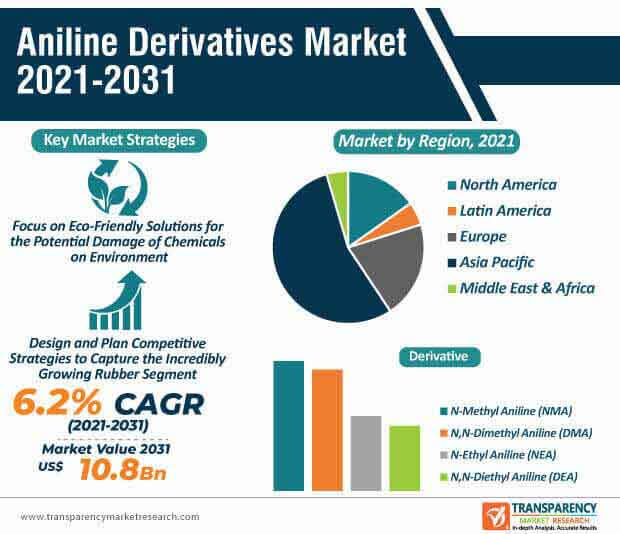
Aniline is the simplest of the principal aromatic amines. It appears to be yellowish to brownish oily liquid with a musty fishy odor. The derivatives of aniline are majorly used in the manufacture of polymers, rubber, agricultural chemicals, dyes & pigments, pharmaceuticals, and photographic chemicals. Many aniline derivatives are produced by hydrogenation of their nitro aromatic precursors. The primary and most useful derivatives of aniline include N-Methyl Aniline (NMA), N-Dimethyl Aniline (DMA), N-Ethyl Aniline (NEA), and N-Diethyl Aniline (DEA). Aniline derivatives are growing popular for their use in the production of polyurethane, which is essential to manufacture plastics. With the rising demand for plastics in the medical industry for manufacturing medical devices such as catheters, tubes, masks, and bags, the global aniline derivatives market is expected to grow in the near future. Medical plastics are cost-effective, low weight, high sterilization resistant, quick manufacturing ability, safe, and resistant to harsh chemicals. Thus, there is an increased demand for aniline derivatives in the medical industry.
Aniline derivatives are widely being used around the world for several purposes depending on the derivative. N-Methyl Aniline (NMA) is an aniline derivative that is used as a latent and coupling solvent. It is used as an intermediate for dyes, agrochemicals, and several organic products. Moreover, derivatives such as DMA can be used as a substitute for aniline. The colorless and yellow compound is popularly used for making dyes, pigments, photographic, pharmaceutical, and defense industries. Furthermore, other derivatives include NEA are significantly utilized for the extraction of nicotine from nicotine gum. Moreover, this derivative is in growing demand from the plastic and explosive manufacturing industries. The growing market of end users is likely to drive the aniline derivatives market during the forecast period.
Due to COVID-19, the public health crisis continues to control global industries and businesses are still trying to adjust to the new normal. The pandemic resulted in various challenges that include a halt in production, supply chain disruption, cost escalation, and workforce dislocation. The regulations implemented by governments worldwide to socially distance people to limit the spread has resulted in less work staff in industries. Thus, limiting the production to flatten the curve. The limit in such activities has caused a global slowdown in the economy as well as production, which has affected the demand for the aniline derivatives market. However, the demand for aniline derivatives was steady and increasing before the coronavirus started its destruction of lives. All the aspects, including supply chain and mass production were working efficiently and the market was on the verge the heavily produce for the increasing demand.
The post-COVID-19 years are expected to witness a shortage in the availability of raw materials, as the supply chain will slowly gain momentum with different regulations in different affected areas. In addition, the logistics industry had a deep impact from inconsistent regulations, which will require it’s time to restore once all the markets are open. The aniline derivatives market heavily depends on their end-use demand, which suffered from the slowing down of several industries, including paints & inks, rubber textile, and plastic, among others. As the market is restoring in several developed countries, the recovery of economic activities in various industries is most likely to create new opportunities for the global aniline derivatives market. Major end-use industries such as rubber and dye are expected to increase their production once the market restores, which is likely to generate significant demand for aniline derivatives.
One of the important applications of aniline is the methylenedianiline, which is produced by condensation with formaldehyde and is primarily used in several industries. The uses of such aniline derivatives vary from rubber processing chemicals to dyes and pigments. Derivatives such as phenylenediamines and diphenylamine are antioxidants and trends as additives to rubber. Moreover, aniline has its vital use in the production of medical drugs such as paracetamol, acetaminophen, and tylenol. The growing use of medicines across the world demands increased production for these aniline derivatives. Furthermore, the primary use of aniline as a precursor to indigo, the blue of blue jeans, is trending in various developing regions with new production houses entering the aniline derivatives market. Some of the early manufacturers such as the Aerobee and WAC Corporal experimented with the mixture of aniline and furfuryl alcohol as a fuel, with nitric acid as an oxidizer. It resulted in a dense and long-lasting effect extending the use of products.
The derivatives of aniline have been in manufacturing use for centuries. In the late 1800, acetanilide and phenacetin, the aniline derivatives emerged as analgesic drugs, with their cardiac-suppressive side effects often countered with caffeine. Moreover, in the mid-1900, aniline was utilized with nitric acid or dinitrogen tetroxide as a rocket fuel for small missiles and the Aerobee rocket. Since then, various manufacturers have used aniline derivatives to produce different products. Presently, aniline derivatives play a major role in the agriculture and farming industries. With the expansion of these industries on a global level, the demand for the aniline derivatives market is expected to rise during the forecast period.
The aniline derivatives market is expected to witness a heavy surge in demand with the restoration of the market in the post-COVID-19. The use of polyurethane in manufacturing plastics will be trending with the increased production of plastics in global industries. The paints & inks industry is also expected to grow its manufacturing capacity, which can result in the growing demand for aniline derivatives. Moreover, N-Methyl Aniline (NMA) was a major derivative segment of the aniline derivative in 2020, and is further expected to hold major share of the aniline derivatives market in the near future. Moreover, the dyes and pigments segments are anticipated to earn the high revenue at the end of the forecast period. Thus, the global aniline derivatives market is expected to reach US$ 11 Bn by 2031, expanding at a CAGR of ~6% during the forecast period.
Analysts’ Viewpoint
With farming being widely adopted as a business for high economical gains, it is likely to hold a major position in the worldwide economy. The industry significantly depends on the aniline derivatives, and with growing industrial value, the demand for aniline is expected to rise to fulfill production requirements. This is anticipated to drive the aniline derivatives market during the forecast period.
Furthermore, Asia Pacific countries such as India, China, Japan, and Singapore are among the most rapid consumers of aniline derivatives with their increasing production capacity, growing work capital, and rising consumer spending. This, too, is projected to propel the growth of the aniline derivatives market.
Aniline Derivatives Market: Overview
Rise in Demand for Aniline Derivatives in Paints & Inks Industry: Key Driver of Aniline Derivatives Market
Increase in Demand for Aniline Derivatives in Agriculture Industry to Boost Aniline Derivatives Market
N-Ethyl Aniline (NEA) Derivative Dominates Aniline Derivatives Market
Aniline Derivatives Market: Competition Landscape
Aniline Derivatives Market: Major Developments
Aniline Derivatives Market is expected to reach US$ 11 Bn By 2031
Aniline Derivatives Market is estimated to rise at a CAGR of 6% during forecast period
Rise in housing construction and infrastructure development is expected to drive the Aniline Derivatives Market
Asia Pacific is more attractive for vendors in the Aniline Derivatives Market
Key players of Aniline Derivatives Market are Azelis, Iwaki Seiyaku Co.,Ltd., Aarti Industries Ltd, Industrial Solvents & Chemicals Pvt. Ltd, Kutch Chemicals, Panoli Intermediates India Private Limited, Mitsuboshi Chemical Co.,Ltd, Karoon Petrochemical Company, Premier Group of Industries, Honshu Chemical Industry Co., Ltd, Deepak Novochem Technologies Limited, Indus Chemicals, Valiant Organics Limited, JIGCHEM UNIVERSAL, and Black Rose Industries Ltd
1. Executive Summary
1.1. Aniline Derivatives Market Snapshot
1.2. Current Market and Future Potential
2. Market Overview
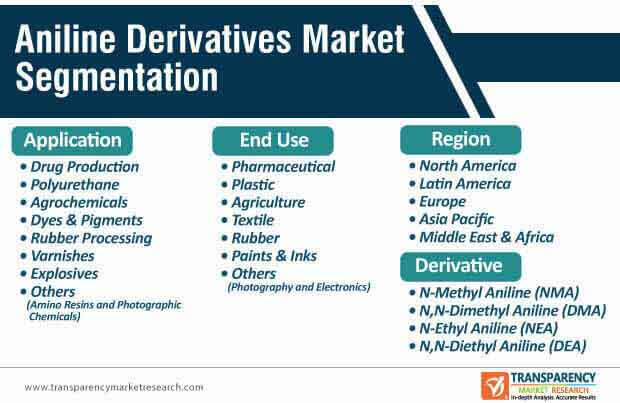
2.1. Market Segmentation
2.2. Market Definition
2.3. Market Dynamics
2.3.1. Drivers
2.3.2. Restraints
2.3.3. Opportunities
2.4. Porter’s Five Forces Analysis
2.5. Regulatory Landscape
2.6. Value Chain Analysis
2.6.1. List of Suppliers/Manufacturers
2.6.2. List of Potential Customers
2.6.3. List of Project Management Companies
2.6.4. List of Potential Customers
2.7. Project Cost Analysis
3. COVID-19 Impact Analysis
4. Production Output Analysis
5. Import Export Analysis, by Major Countries (HS Code: 292142)
6. Price Trend Analysis
7. Global Aniline Derivatives Market Analysis and Forecast, by Derivative, 2020–2031
7.1. Introduction and Definitions
7.2. Global Aniline Derivatives Market Volume (Kilo Tons) and Value (US$ Mn) Forecast, by Derivative, 2020–2031
7.2.1. N-Methyl Aniline (NMA)
7.2.2. N,N-Dimethyl Aniline (DMA)
7.2.3. N-Ethyl Aniline (NEA)
7.2.4. N,N-Diethyl Aniline (DEA)
7.3. Global Aniline Derivatives Market Attractiveness, by Derivative
8. Global Aniline Derivatives Market Analysis and Forecast, by Application, 2020–2031
8.1. Introduction and Definitions
8.2. Global Aniline Derivatives Market Volume (Kilo Tons) and Value (US$ Mn) Forecast, by Application, 2020–2031
8.2.1. Drug Production
8.2.2. Polyurethane
8.2.3. Agrochemicals
8.2.4. Dyes & Pigments
8.2.5. Rubber Processing
8.2.6. Varnishes
8.2.7. Explosives
8.2.8. Others
8.3. Global Aniline Derivatives Market Attractiveness, by Application
9. Global Aniline Derivatives Market Analysis and Forecast, by End-use, 2020–2031
9.1. Introduction and Definitions
9.2. Global Aniline Derivatives Market Volume (Kilo Tons ) and Value (US$ Mn) Forecast, by End-use, 2020–2031
9.2.1. Pharmaceutical
9.2.2. Plastic
9.2.3. Agriculture
9.2.4. Textile
9.2.5. Rubber
9.2.6. Paints & Inks
9.2.7. Others
9.3. Global Aniline Derivatives Market Attractiveness, by End-use
10. Global Aniline Derivatives Market Analysis and Forecast, by Region, 2020–2031
10.1. Key Findings
10.2. Global Aniline Derivatives Market Volume (Kilo Tons) and Value (US$ Mn) Forecast, by Region, 2020–2031
10.2.1. North America
10.2.2. Europe
10.2.3. Asia Pacific
10.2.4. Latin America
10.2.5. Middle East & Africa
10.3. Global Aniline Derivatives Market Attractiveness, by Region
11. North America Aniline Derivatives Market Analysis and Forecast, 2020–2031
11.1. Key Findings
11.2. North America Aniline Derivatives Market Volume (Kilo Tons) and Value (US$ Mn) Forecast, by Derivative, 2020–2031
11.3. North America Aniline Derivatives Market Volume (Kilo Tons) and Value (US$ Mn) Forecast, by Application, 2020–2031
11.4. North America Aniline Derivatives Market Volume (Kilo Tons) and Value (US$ Mn) Forecast, by End-use, 2020–2031
11.5. North America Aniline Derivatives Market Volume (Kilo Tons) and Value (US$ Mn) Forecast, by Country, 2021–2031
11.5.1. U.S. Aniline Derivatives Market Volume (Kilo Tons) and Value (US$ Mn) Forecast, by Derivative, 2020–2031
11.5.2. U.S. Aniline Derivatives Market Volume (Kilo Tons) and Value (US$ Mn) Forecast, by Application, 2020–2031
11.5.3. U.S. Aniline Derivatives Market Volume (Kilo Tons) and Value (US$ Mn) Forecast, by End-use, 2020–2031
11.5.4. Canada Aniline Derivatives Market Volume (Kilo Tons) and Value (US$ Mn) Forecast, by Derivative, 2020–2031
11.5.5. Canada Aniline Derivatives Market Volume (Kilo Tons) and Value (US$ Mn) Forecast, by Application, 2020–2031
11.5.6. Canada Aniline Derivatives Market Volume (Kilo Tons) and Value (US$ Mn) Forecast, by End-use, 2020–2031
11.6. North America Aniline Derivatives Market Attractiveness Analysis
12. Europe Aniline Derivatives Market Analysis and Forecast, 2020–2031
12.1. Key Findings
12.2. Europe Aniline Derivatives Market Volume (Kilo Tons) and Value (US$ Mn) Forecast, by Derivative, 2020–2031
12.3. Europe Aniline Derivatives Market Volume (Kilo Tons) and Value (US$ Mn) Forecast, by Application, 2020–2031
12.4. Europe Aniline Derivatives Market Volume (Kilo Tons) and Value (US$ Mn) Forecast, by End-use, 2020–2031
12.5. Europe Aniline Derivatives Market Volume (Kilo Tons) and Value (US$ Mn) Forecast, by Country and Sub-region, 2021–2031
12.5.1. Germany Aniline Derivatives Market Volume (Kilo Tons) and Value (US$ Mn) Forecast, by Derivative, 2020–2031
12.5.2. Germany Aniline Derivatives Market Volume (Kilo Tons) and Value (US$ Mn) Forecast, by Application, 2020–2031
12.5.3. Germany Aniline Derivatives Market Volume (Kilo Tons) and Value (US$ Mn) Forecast, by End-use, 2020–2031
12.5.4. U.K. Aniline Derivatives Market Volume (Kilo Tons) and Value (US$ Mn) Forecast, by Derivative, 2020–2031
12.5.5. U.K. Aniline Derivatives Market Volume (Kilo Tons) and Value (US$ Mn) Forecast, by Application, 2020–2031
12.5.6. U.K. Aniline Derivatives Market Volume (Kilo Tons) and Value (US$ Mn) Forecast, by End-use, 2020–2031
12.5.7. France Aniline Derivatives Market Volume (Kilo Tons) and Value (US$ Mn) Forecast, by Derivative, 2020–2031
12.5.8. France Aniline Derivatives Market Volume (Kilo Tons) and Value (US$ Mn) Forecast, by Application, 2020–2031
12.5.9. France Aniline Derivatives Market Volume (Kilo Tons) and Value (US$ Mn) Forecast, by End-use, 2020–2031
12.5.10. Italy Aniline Derivatives Market Volume (Kilo Tons) and Value (US$ Mn) Forecast, by Derivative, 2020–2031
12.5.11. Italy Aniline Derivatives Market Volume (Kilo Tons) and Value (US$ Mn) Forecast, by Application, 2020–2031
12.5.12. Italy Aniline Derivatives Market Volume (Kilo Tons) and Value (US$ Mn) Forecast, by End-use, 2020–2031
12.5.13. Spain Aniline Derivatives Market Volume (Kilo Tons) and Value (US$ Mn) Forecast, by Derivative, 2020–2031
12.5.14. Spain Aniline Derivatives Market Volume (Kilo Tons) and Value (US$ Mn) Forecast, by Application, 2020–2031
12.5.15. Spain Aniline Derivatives Market Volume (Kilo Tons) and Value (US$ Mn) Forecast, by End-use, 2020–2031
12.5.16. Russia & CIS Aniline Derivatives Market Volume (Kilo Tons) and Value (US$ Mn) Forecast, by Derivative, 2020–2031
12.5.17. Russia & CIS Aniline Derivatives Market Volume (Kilo Tons) and Value (US$ Mn) Forecast, by Application, 2020–2031
12.5.18. Russia & CIS Aniline Derivatives Market Volume (Kilo Tons) and Value (US$ Mn)
12.5.19. Rest of Europe Aniline Derivatives Market Volume (Kilo Tons) and Value (US$ Mn) Forecast, by Derivative, 2020–2031
12.5.20. Rest of Europe Aniline Derivatives Market Volume (Kilo Tons) and Value (US$ Mn) Forecast, by Application, 2020–2031
12.5.21. Rest of Europe Aniline Derivatives Market Volume (Kilo Tons) and Value (US$ Mn) Forecast, by End-use, 2020–2031
12.6. Europe Aniline Derivatives Market Attractiveness Analysis
13. Asia Pacific Aniline Derivatives Market Analysis and Forecast, 2020–2031
13.1. Key Findings
13.2. Asia Pacific Aniline Derivatives Market Volume (Kilo Tons) and Value (US$ Mn) Forecast, by Derivative, 2020–2031
13.3. Asia Pacific Aniline Derivatives Market Volume (Kilo Tons) and Value (US$ Mn) Forecast, by Application, 2020–2031
13.4. Asia Pacific Aniline Derivatives Market Volume (Kilo Tons) and Value (US$ Mn) Forecast, by End-use, 2020–2031
13.5. Asia Pacific Aniline Derivatives Market Volume (Kilo Tons) and Value (US$ Mn) Forecast, by Country and Sub-region, 2021–2031
13.5.1. China Aniline Derivatives Market Volume (Kilo Tons) and Value (US$ Mn) Forecast, by Derivative, 2020–2031
13.5.2. China Aniline Derivatives Market Volume (Kilo Tons) and Value (US$ Mn) Forecast, by Application, 2020–2031
13.5.3. China Aniline Derivatives Market Volume (Kilo Tons) and Value (US$ Mn) Forecast, by End-use, 2020–2031
13.5.4. Japan Aniline Derivatives Market Volume (Kilo Tons) and Value (US$ Mn) Forecast, by Derivative, 2020–2031
13.5.5. Japan Aniline Derivatives Market Volume (Kilo Tons) and Value (US$ Mn) Forecast, by Application, 2020–2031
13.5.6. Japan Aniline Derivatives Market Volume (Kilo Tons) and Value (US$ Mn) Forecast, by End-use, 2020–2031
13.5.7. India Aniline Derivatives Market Volume (Kilo Tons) and Value (US$ Mn) Forecast, by Derivative, 2020–2031
13.5.8. India Aniline Derivatives Market Volume (Kilo Tons) and Value (US$ Mn) Forecast, by Application, 2020–2031
13.5.9. India Aniline Derivatives Market Volume (Kilo Tons) and Value (US$ Mn) Forecast, by End-use, 2020–2031
13.5.10. ASEAN Aniline Derivatives Market Volume (Kilo Tons) and Value (US$ Mn) Forecast, by Derivative, 2020–2031
13.5.11. ASEAN Aniline Derivatives Market Volume (Kilo Tons) and Value (US$ Mn) Forecast, by Application, 2020–2031
13.5.12. ASEAN Aniline Derivatives Market Volume (Kilo Tons) and Value (US$ Mn) Forecast, by End-use, 2020–2031
13.5.13. Rest of Asia Pacific Aniline Derivatives Market Volume (Kilo Tons) and Value (US$ Mn) Forecast, by Derivative, 2020–2031
13.5.14. Rest of Asia Pacific Aniline Derivatives Market Volume (Kilo Tons) and Value (US$ Mn) Forecast, by Application, 2020–2031
13.5.15. Rest of Asia Pacific Aniline Derivatives Market Volume (Kilo Tons) and Value (US$ Mn) Forecast, by End-use, 2020–2031
13.6. Asia Pacific Aniline Derivatives Market Attractiveness Analysis
14. Latin America Aniline Derivatives Market Analysis and Forecast, 2020–2031
14.1. Key Findings
14.2. Latin America Aniline Derivatives Market Volume (Kilo Tons) and Value (US$ Mn) Forecast, by Derivative, 2020–2031
14.3. Latin America Aniline Derivatives Market Volume (Kilo Tons) and Value (US$ Mn) Forecast, by Application, 2020–2031
14.4. Latin America Aniline Derivatives Market Volume (Kilo Tons) and Value (US$ Mn) Forecast, by End-use, 2020–2031
14.5. Latin America Aniline Derivatives Market Volume (Kilo Tons) and Value (US$ Mn) Forecast, by Country and Sub-region, 2021–2031
14.5.1. Brazil Aniline Derivatives Market Volume (Kilo Tons) and Value (US$ Mn) Forecast, by Derivative, 2020–2031
14.5.2. Brazil Aniline Derivatives Market Volume (Kilo Tons) and Value (US$ Mn) Forecast, by Application, 2020–2031
14.5.3. Brazil Aniline Derivatives Market Volume (Kilo Tons) and Value (US$ Mn) Forecast, by End-use, 2020–2031
14.5.4. Mexico Aniline Derivatives Market Volume (Kilo Tons) and Value (US$ Mn) Forecast, by Derivative, 2020–2031
14.5.5. Mexico Aniline Derivatives Market Volume (Kilo Tons) and Value (US$ Mn) Forecast, by Application, 2020–2031
14.5.6. Mexico Aniline Derivatives Market Volume (Kilo Tons) and Value (US$ Mn) Forecast, by End-use, 2020–2031
14.5.7. Rest of Latin America Aniline Derivatives Market Volume (Kilo Tons) and Value (US$ Mn) Forecast, by Derivative, 2020–2031
14.5.8. Rest of Latin America Aniline Derivatives Market Volume (Kilo Tons) and Value (US$ Mn) Forecast, by Application, 2020–2031
14.5.9. Rest of Latin America Aniline Derivatives Market Volume (Kilo Tons) and Value (US$ Mn) Forecast, by End-use, 2020–2031
14.6. Latin America Aniline Derivatives Market Attractiveness Analysis
15. Middle East & Africa Aniline Derivatives Market Analysis and Forecast, 2020–2031
15.1. Key Findings
15.2. Middle East & Africa Aniline Derivatives Market Volume (Kilo Tons) and Value (US$ Mn) Forecast, by Derivative, 2020–2031
15.3. Middle East & Africa Aniline Derivatives Market Volume (Kilo Tons) and Value (US$ Mn) Forecast, by Application, 2020–2031
15.4. Middle East & Africa Aniline Derivatives Market Volume (Kilo Tons) and Value (US$ Mn) Forecast, by End-use, 2020–2031
15.5. Middle East & Africa Aniline Derivatives Market Volume (Kilo Tons) and Value (US$ Mn) Forecast, by Country and Sub-region, 2021–2031
15.5.1. GCC Aniline Derivatives Market Volume (Kilo Tons) and Value (US$ Mn) Forecast, by Derivative, 2020–2031
15.5.2. GCC Aniline Derivatives Market Volume (Kilo Tons) and Value (US$ Mn) Forecast, by Application, 2020–2031
15.5.3. GCC Aniline Derivatives Market Volume (Kilo Tons) and Value (US$ Mn) Forecast, by End-use, 2020–2031
15.5.4. South Africa Aniline Derivatives Market Volume (Kilo Tons) and Value (US$ Mn) Forecast, by Derivative, 2020–2031
15.5.5. South Africa Aniline Derivatives Market Volume (Kilo Tons) and Value (US$ Mn) Forecast, by Application, 2020–2031
15.5.6. South Africa Aniline Derivatives Market Volume (Kilo Tons) and Value (US$ Mn) Forecast, by End-use, 2020–2031
15.5.7. Rest of Middle East & Africa Aniline Derivatives Market Volume (Kilo Tons) and Value (US$ Mn) Forecast, by Derivative, 2020–2031
15.5.8. Rest of Middle East & Africa Aniline Derivatives Market Volume (Kilo Tons) and Value (US$ Mn) Forecast, by Application, 2020–2031
15.5.9. Rest of Middle East & Africa Aniline Derivatives Market Volume (Kilo Tons) and Value (US$ Mn) Forecast, by End-use, 2020–2031
15.6. Middle East & Africa Aniline Derivatives Market Attractiveness Analysis
16. Competition Landscape
16.1. Global Aniline Derivatives Company Market Share Analysis, 2020
16.2. Company Profiles (Details – Overview, Financials, Recent Developments, and Strategy)
16.2.1. Azelis
16.2.1.1. Company Description
16.2.1.2. Business Overview
16.2.2. Iwaki Seiyaku Co.,Ltd
16.2.2.1. Company Description
16.2.2.2. Business Overview
16.2.3. Aarti Industries Ltd
16.2.3.1. Company Description
16.2.3.2. Business Overview
16.2.4. Industrial Solvents
16.2.4.1. Company Description
16.2.4.2. Business Overview
16.2.5. Kutch Chemicals
16.2.5.1. Company Description
16.2.5.2. Business Overview
16.2.6. Panoli Intermediates India Private Limited
16.2.6.1. Company Description
16.2.6.2. Business Overview
16.2.7. Mitsuboshi Chemical Co.,Ltd.
16.2.7.1. Company Description
16.2.7.2. Business Overview
16.2.8. Karoon Petrochemical Company
16.2.8.1. Company Description
16.2.8.2. Business Overview
16.2.9. Premier Group of Industries
16.2.9.1. Company Description
16.2.9.2. Business Overview
16.2.10. Honshu Chemical Industry Co., Ltd.
16.2.10.1. Company Description
16.2.10.2. Business Overview
16.2.11. Deepak Novochem Technologies Limited.
16.2.11.1. Company Description
16.2.11.2. Business Overview
16.2.12. Indus Chemical
16.2.12.1. Company Description
16.2.12.2. Business Overview
16.2.13. Valiant Organics Limited
16.2.13.1. Company Description
16.2.13.2. Business Overview
16.2.14. Black Rose Industries Ltd.
16.2.14.1. Company Description
16.2.14.2. Business Overview
17. Primary Research: Key Insights
18. Appendix
List of Tables
Table 1: Global Aniline Derivatives Market Volume (Kilo Tons) Forecast, by Derivative, 2020–2031
Table 2: Global Aniline Derivatives Market Value (US$ Mn) Forecast, by Derivative, 2020–2031
Table 3: Global Aniline Derivatives Market Volume (Kilo Tons) Forecast, by Application, 2020–2031
Table 4: Global Aniline Derivatives Market Value (US$ Mn) Forecast, by Application, 2020–2031
Table 5: Global Aniline Derivatives Market Volume (Kilo Tons) Forecast, by End-use, 2020–2031
Table 6: Global Aniline Derivatives Market Value (US$ Mn) Forecast, by End-use, 2020–2031
Table 7: Global Aniline Derivatives Market Volume (Kilo Tons) Forecast, by Region, 2020–2031
Table 8: Global Aniline Derivatives Market Value (US$ Mn) Forecast, by Region, 2020–2031
Table 9: North America Aniline Derivatives Market Volume (Kilo Tons) Forecast, by Derivative, 2020–2031
Table 10: North America Aniline Derivatives Market Value (US$ Mn) Forecast, by Derivative, 2020–2031
Table 11: North America Aniline Derivatives Market Volume (Kilo Tons) Forecast, by Application, 2020–2031
Table 12: North America Aniline Derivatives Market Value (US$ Mn) Forecast, by Application, 2020–2031
Table 13: North America Aniline Derivatives Market Volume (Kilo Tons) Forecast, by End-use, 2020–2031
Table 14: North America Aniline Derivatives Market Value (US$ Mn) Forecast, by End-use, 2020–2031
Table 15: North America Aniline Derivatives Market Volume (Kilo Tons) Forecast, by Country, 2020–2031
Table 16: North America Aniline Derivatives Market Value (US$ Mn) Forecast, by Country, 2020–2031
Table 17: U.S. Aniline Derivatives Market Volume (Kilo Tons) Forecast, by Derivative, 2020–2031
Table 18: U.S. Aniline Derivatives Market Value (US$ Mn) Forecast, by Derivative, 2020–2031
Table 19: U.S. Aniline Derivatives Market Volume (Kilo Tons) Forecast, by Application, 2020–2031
Table 20: U.S. Aniline Derivatives Market Value (US$ Mn) Forecast, by Application, 2020–2031
Table 21: U.S. Aniline Derivatives Market Volume (Kilo Tons) Forecast, by End-use, 2020–2031
Table 22: U.S. Aniline Derivatives Market Value (US$ Mn) Forecast, by End-use, 2020–2031
Table 23: Canada Aniline Derivatives Market Volume (Kilo Tons) Forecast, by Derivative, 2020–2031
Table 24: Canada Aniline Derivatives Market Value (US$ Mn) Forecast, by Derivative, 2020–2031
Table 25: Canada Aniline Derivatives Market Volume (Kilo Tons) Forecast, by Application, 2020–2031
Table 26: Canada Aniline Derivatives Market Value (US$ Mn) Forecast, by Application, 2020–2031
Table 27: Canada Aniline Derivatives Market Volume (Kilo Tons) Forecast, by End-use, 2020–2031
Table 28: Canada Aniline Derivatives Market Value (US$ Mn) Forecast, by End-use, 2020–2031
Table 29: Europe Aniline Derivatives Market Volume (Kilo Tons) Forecast, by Derivative, 2020–2031
Table 30: Europe Aniline Derivatives Market Value (US$ Mn) Forecast, by Derivative, 2020–2031
Table 31: Europe Aniline Derivatives Market Volume (Kilo Tons) Forecast, by Application, 2020–2031
Table 32: Europe Aniline Derivatives Market Value (US$ Mn) Forecast, by Application, 2020–2031
Table 33: Europe Aniline Derivatives Market Volume (Kilo Tons) Forecast, by End-use, 2020–2031
Table 34: Europe Aniline Derivatives Market Value (US$ Mn) Forecast, by End-use, 2020–2031
Table 35: Europe Aniline Derivatives Market Volume (Kilo Tons) Forecast, by Country and Sub-region, 2020–2031
Table 36: Europe Aniline Derivatives Market Value (US$ Mn) Forecast, by Country and Sub-region, 2020–2031
Table 37: Germany Aniline Derivatives Market Volume (Kilo Tons) Forecast, by Derivative, 2020–2031
Table 38: Germany Aniline Derivatives Market Value (US$ Mn) Forecast, by Derivative, 2020–2031
Table 39: Germany Aniline Derivatives Market Volume (Kilo Tons) Forecast, by Application, 2020–2031
Table 40: Germany Aniline Derivatives Market Value (US$ Mn) Forecast, by Application, 2020–2031
Table 41: Germany Aniline Derivatives Market Volume (Kilo Tons) Forecast, by End-use, 2020–2031
Table 42: Germany Aniline Derivatives Market Value (US$ Mn) Forecast, by End-use, 2020–2031
Table 43: U.K. Aniline Derivatives Market Volume (Kilo Tons) Forecast, by Derivative, 2020–2031
Table 44: U.K. Aniline Derivatives Market Value (US$ Mn) Forecast, by Derivative, 2020–2031
Table 45: U.K. Aniline Derivatives Market Volume (Kilo Tons) Forecast, by Application, 2020–2031
Table 46: U.K. Aniline Derivatives Market Value (US$ Mn) Forecast, by Application, 2020–2031
Table 47: U.K. Aniline Derivatives Market Volume (Kilo Tons) Forecast, by End-use, 2020–2031
Table 48: U.K. Aniline Derivatives Market Value (US$ Mn) Forecast, by End-use, 2020–2031
Table 49: France Aniline Derivatives Market Volume (Kilo Tons) Forecast, by Derivative, 2020–2031
Table 50: France Aniline Derivatives Market Value (US$ Mn) Forecast, by Derivative, 2020–2031
Table 51: France Aniline Derivatives Market Volume (Kilo Tons) Forecast, by Application, 2020–2031
Table 52: France Aniline Derivatives Market Value (US$ Mn) Forecast, by Application, 2020–2031
Table 53: France Aniline Derivatives Market Volume (Kilo Tons) Forecast, by End-use, 2020–2031
Table 54: France Aniline Derivatives Market Value (US$ Mn) Forecast, by End-use, 2020–2031
Table 55: Italy Aniline Derivatives Market Volume (Kilo Tons) Forecast, by Derivative, 2020–2031
Table 56: Italy Aniline Derivatives Market Value (US$ Mn) Forecast, by Derivative, 2020–2031
Table 57: Italy Aniline Derivatives Market Volume (Kilo Tons) Forecast, by Application, 2020–2031
Table 58: Italy Aniline Derivatives Market Value (US$ Mn) Forecast, by Application, 2020–2031
Table 59: Italy Aniline Derivatives Market Volume (Kilo Tons) Forecast, by End-use, 2020–2031
Table 60: Italy Aniline Derivatives Market Value (US$ Mn) Forecast, by End-use, 2020–2031
Table 61: Spain Aniline Derivatives Market Volume (Kilo Tons) Forecast, by Derivative, 2020–2031
Table 62: Spain Aniline Derivatives Market Value (US$ Mn) Forecast, by Derivative, 2020–2031
Table 63: Spain Aniline Derivatives Market Volume (Kilo Tons) Forecast, by Application, 2020–2031
Table 64: Spain Aniline Derivatives Market Value (US$ Mn) Forecast, by Application, 2020–2031
Table 65: Spain Aniline Derivatives Market Volume (Kilo Tons) Forecast, by End-use, 2020–2031
Table 66: Spain Aniline Derivatives Market Value (US$ Mn) Forecast, by End-use, 2020–2031
Table 67: Russia & CIS Aniline Derivatives Market Volume (Kilo Tons) Forecast, by Derivative, 2020–2031
Table 68: Russia & CIS Aniline Derivatives Market Value (US$ Mn) Forecast, by Derivative, 2020–2031
Table 69: Russia & CIS Aniline Derivatives Market Volume (Kilo Tons) Forecast, by Application, 2020–2031
Table 70: Russia & CIS Aniline Derivatives Market Value (US$ Mn) Forecast, by Application, 2020–2031
Table 71: Russia & CIS Aniline Derivatives Market Volume (Kilo Tons) Forecast, by End-use, 2020–2031
Table 72: Russia & CIS Aniline Derivatives Market Value (US$ Mn) Forecast, by End-use, 2020–2031
Table 73: Rest of Europe Aniline Derivatives Market Volume (Kilo Tons) Forecast, by Derivative, 2020–2031
Table 74: Rest of Europe Aniline Derivatives Market Value (US$ Mn) Forecast, by Derivative, 2020–2031
Table 75: Rest of Europe Aniline Derivatives Market Volume (Kilo Tons) Forecast, by Application, 2020–2031
Table 76: Rest of Europe Aniline Derivatives Market Value (US$ Mn) Forecast, by Application, 2020–2031
Table 77: Rest of Europe Aniline Derivatives Market Volume (Kilo Tons) Forecast, by End-use, 2020–2031
Table 78: Rest of Europe Aniline Derivatives Market Value (US$ Mn) Forecast, by End-use, 2020–2031
Table 79: Asia Pacific Aniline Derivatives Market Volume (Kilo Tons) Forecast, by Derivative, 2020–2031
Table 80: Asia Pacific Aniline Derivatives Market Value (US$ Mn) Forecast, by Derivative, 2020–2031
Table 81: Asia Pacific Aniline Derivatives Market Volume (Kilo Tons) Forecast, by Application, 2020–2031
Table 82: Asia Pacific Aniline Derivatives Market Value (US$ Mn) Forecast, by Application, 2020–2031
Table 83: Asia Pacific Aniline Derivatives Market Volume (Kilo Tons) Forecast, by End-use, 2020–2031
Table 84: Asia Pacific Aniline Derivatives Market Value (US$ Mn) Forecast, by End-use, 2020–2031
Table 85: Asia Pacific Aniline Derivatives Market Volume (Kilo Tons) Forecast, by Country and Sub-region, 2020–2031
Table 86: Asia Pacific Aniline Derivatives Market Value (US$ Mn) Forecast, by Country and Sub-region, 2020–2031
Table 87: China Aniline Derivatives Market Volume (Kilo Tons) Forecast, by Derivative, 2020–2031
Table 88: China Aniline Derivatives Market Value (US$ Mn) Forecast, by Derivative, 2020–2031
Table 89: China Aniline Derivatives Market Volume (Kilo Tons) Forecast, by Application, 2020–2031
Table 90: China Aniline Derivatives Market Value (US$ Mn) Forecast, by Application, 2020–2031
Table 91: China Aniline Derivatives Market Volume (Kilo Tons) Forecast, by End-use, 2020–2031
Table 92: China Aniline Derivatives Market Value (US$ Mn) Forecast, by End-use, 2020–2031
Table 93: India Aniline Derivatives Market Volume (Kilo Tons) Forecast, by Derivative, 2020–2031
Table 94: India Aniline Derivatives Market Value (US$ Mn) Forecast, by Derivative, 2020–2031
Table 95: India Aniline Derivatives Market Volume (Kilo Tons) Forecast, by Application, 2020–2031
Table 96: India Aniline Derivatives Market Value (US$ Mn) Forecast, by Application, 2020–2031
Table 97: India Aniline Derivatives Market Volume (Kilo Tons) Forecast, by End-use, 2020–2031
Table 98: India Aniline Derivatives Market Value (US$ Mn) Forecast, by End-use, 2020–2031
Table 99: Japan Aniline Derivatives Market Volume (Kilo Tons) Forecast, by Derivative, 2020–2031
Table 100: Japan Aniline Derivatives Market Value (US$ Mn) Forecast, by Derivative, 2020–2031
Table 101: Japan Aniline Derivatives Market Volume (Kilo Tons) Forecast, by Application, 2020–2031
Table 102: Japan Aniline Derivatives Market Value (US$ Mn) Forecast, by Application, 2020–2031
Table 103: Japan Aniline Derivatives Market Volume (Kilo Tons) Forecast, by End-use, 2020–2031
Table 104: Japan Aniline Derivatives Market Value (US$ Mn) Forecast, by End-use, 2020–2031
Table 105: ASEAN Aniline Derivatives Market Volume (Kilo Tons) Forecast, by Derivative, 2020–2031
Table 106: ASEAN Aniline Derivatives Market Value (US$ Mn) Forecast, by Derivative, 2020–2031
Table 107: ASEAN Aniline Derivatives Market Volume (Kilo Tons) Forecast, by Application, 2020–2031
Table 108: ASEAN Aniline Derivatives Market Value (US$ Mn) Forecast, by Application, 2020–2031
Table 109: ASEAN Aniline Derivatives Market Volume (Kilo Tons) Forecast, by End-use, 2020–2031
Table 110: ASEAN Aniline Derivatives Market Value (US$ Mn) Forecast, by End-use, 2020–2031
Table 111: Rest of Asia Pacific Aniline Derivatives Market Volume (Kilo Tons) Forecast, by Derivative, 2020–2031
Table 112: Rest of Asia Pacific Aniline Derivatives Market Value (US$ Mn) Forecast, by Derivative, 2020–2031
Table 113: Rest of Asia Pacific Aniline Derivatives Market Volume (Kilo Tons) Forecast, by Application, 2020–2031
Table 114: Rest of Asia Pacific Aniline Derivatives Market Value (US$ Mn) Forecast, by Application, 2020–2031
Table 115: Rest of Asia Pacific Aniline Derivatives Market Volume (Kilo Tons) Forecast, by End-use, 2020–2031
Table 116: Rest of Asia Pacific Aniline Derivatives Market Value (US$ Mn) Forecast, by End-use, 2020–2031
Table 117: Latin America Aniline Derivatives Market Volume (Kilo Tons) Forecast, by Derivative, 2020–2031
Table 118: Latin America Aniline Derivatives Market Value (US$ Mn) Forecast, by Derivative, 2020–2031
Table 119: Latin America Aniline Derivatives Market Volume (Kilo Tons) Forecast, by Application, 2020–2031
Table 120: Latin America Aniline Derivatives Market Value (US$ Mn) Forecast, by Application, 2020–2031
Table 121: Latin America Aniline Derivatives Market Volume (Kilo Tons) Forecast, by End-use, 2020–2031
Table 122: Latin America Aniline Derivatives Market Value (US$ Mn) Forecast, by End-use, 2020–2031
Table 123: Latin America Aniline Derivatives Market Volume (Kilo Tons) Forecast, by Country and Sub-region, 2020–2031
Table 124: Latin America Aniline Derivatives Market Value (US$ Mn) Forecast, by Country and Sub-region, 2020–2031
Table 125: Brazil Aniline Derivatives Market Volume (Kilo Tons) Forecast, by Derivative, 2020–2031
Table 126: Brazil Aniline Derivatives Market Value (US$ Mn) Forecast, by Derivative, 2020–2031
Table 127: Brazil Aniline Derivatives Market Volume (Kilo Tons) Forecast, by Application, 2020–2031
Table 128: Brazil Aniline Derivatives Market Value (US$ Mn) Forecast, by Application, 2020–2031
Table 129: Brazil Aniline Derivatives Market Volume (Kilo Tons) Forecast, by End-use, 2020–2031
Table 130: Brazil Aniline Derivatives Market Value (US$ Mn) Forecast, by End-use, 2020–2031
Table 131: Mexico Aniline Derivatives Market Volume (Kilo Tons) Forecast, by Derivative, 2020–2031
Table 132: Mexico Aniline Derivatives Market Value (US$ Mn) Forecast, by Derivative, 2020–2031
Table 133: Mexico Aniline Derivatives Market Volume (Kilo Tons) Forecast, by Application, 2020–2031
Table 134: Mexico Aniline Derivatives Market Value (US$ Mn) Forecast, by Application, 2020–2031
Table 135: Mexico Aniline Derivatives Market Volume (Kilo Tons) Forecast, by End-use, 2020–2031
Table 136: Mexico Aniline Derivatives Market Value (US$ Mn) Forecast, by End-use, 2020–2031
Table 137: Rest of Latin America Aniline Derivatives Market Volume (Kilo Tons) Forecast, by Derivative, 2020–2031
Table 138: Rest of Latin America Aniline Derivatives Market Value (US$ Mn) Forecast, by Derivative, 2020–2031
Table 139: Rest of Latin America Aniline Derivatives Market Volume (Kilo Tons) Forecast, by Application, 2020–2031
Table 140: Rest of Latin America Aniline Derivatives Market Value (US$ Mn) Forecast, by Application, 2020–2031
Table 141: Rest of Latin America Aniline Derivatives Market Volume (Kilo Tons) Forecast, by End-use, 2020–2031
Table 142: Rest of Latin America Aniline Derivatives Market Value (US$ Mn) Forecast, by End-use, 2020–2031
Table 143: Middle East & Africa Aniline Derivatives Market Volume (Kilo Tons) Forecast, by Derivative, 2020–2031
Table 144: Middle East & Africa Aniline Derivatives Market Value (US$ Mn) Forecast, by Derivative, 2020–2031
Table 145: Middle East & Africa Aniline Derivatives Market Volume (Kilo Tons) Forecast, by Application, 2020–2031
Table 146: Middle East & Africa Aniline Derivatives Market Value (US$ Mn) Forecast, by Application, 2020–2031
Table 147: Middle East & Africa Aniline Derivatives Market Volume (Kilo Tons) Forecast, by End-use, 2020–2031
Table 148: Middle East & Africa Aniline Derivatives Market Value (US$ Mn) Forecast, by End-use, 2020–2031
Table 149: Middle East & Africa Aniline Derivatives Market Volume (Kilo Tons) Forecast, by Country and Sub-region, 2020–2031
Table 150: Middle East & Africa Aniline Derivatives Market Value (US$ Mn) Forecast, by Country and Sub-region, 2020–2031
Table 151: GCC Aniline Derivatives Market Volume (Kilo Tons) Forecast, by Derivative, 2020–2031
Table 152: GCC Aniline Derivatives Market Value (US$ Mn) Forecast, by Derivative, 2020–2031
Table 153: GCC Aniline Derivatives Market Volume (Kilo Tons) Forecast, by Application, 2020–2031
Table 154: GCC Aniline Derivatives Market Value (US$ Mn) Forecast, by Application, 2020–2031
Table 155: GCC Aniline Derivatives Market Volume (Kilo Tons) Forecast, by End-use, 2020–2031
Table 156: GCC Aniline Derivatives Market Value (US$ Mn) Forecast, by End-use, 2020–2031
Table 157: South Africa Aniline Derivatives Market Volume (Kilo Tons) Forecast, by Derivative, 2020–2031
Table 158: South Africa Aniline Derivatives Market Value (US$ Mn) Forecast, by Derivative, 2020–2031
Table 159: South Africa Aniline Derivatives Market Volume (Kilo Tons) Forecast, by Application, 2020–2031
Table 160: South Africa Aniline Derivatives Market Value (US$ Mn) Forecast, by Application, 2020–2031
Table 161: South Africa Aniline Derivatives Market Volume (Kilo Tons) Forecast, by End-use, 2020–2031
Table 162: South Africa Aniline Derivatives Market Value (US$ Mn) Forecast, by End-use, 2020–2031
Table 163: Rest of Middle East & Africa Aniline Derivatives Market Volume (Kilo Tons) Forecast, by Derivative, 2020–2031
Table 164: Rest of Middle East & Africa Aniline Derivatives Market Value (US$ Mn) Forecast, by Derivative, 2020–2031
Table 165: Rest of Middle East & Africa Aniline Derivatives Market Volume (Kilo Tons) Forecast, by Application, 2020–2031
Table 166: Rest of Middle East & Africa Aniline Derivatives Market Value (US$ Mn) Forecast, by Application, 2020–2031
Table 167: Rest of Middle East Aniline Derivatives Market Volume (Kilo Tons) Forecast, by End-use, 2020–2031
Table 168: Rest of Middle East Aniline Derivatives Market Value (US$ Mn) Forecast, by End-use, 2020–2031
List of Figures
Figure 1: Global Aniline Derivatives Market Volume Share Analysis, by Derivative, 2020, 2026, and 2031
Figure 2: Global Aniline Derivatives Market Attractiveness, by Derivative
Figure 3: Global Aniline Derivatives Market Volume Share Analysis, by Application, 2020, 2026, and 2031
Figure 4: Global Aniline Derivatives Market Attractiveness, by Application
Figure 5: Global Aniline Derivatives Market Volume Share Analysis, by End-use, 2020, 2026, and 2031
Figure 6: Global Aniline Derivatives Market Attractiveness, by End-use
Figure 7: Global Aniline Derivatives Market Volume Share Analysis, by Region, 2020, 2026, and 2031
Figure 8: Global Aniline Derivatives Market Attractiveness, by Region
Figure 9: North America Aniline Derivatives Market Volume Share Analysis, by Derivative, 2020, 2026, and 2031
Figure 10: North America Aniline Derivatives Market Attractiveness, by Derivative
Figure 11: North America Aniline Derivatives Market Volume Share Analysis, by Application, 2020, 2026, and 2031
Figure 12: North America Aniline Derivatives Market Attractiveness, by Application
Figure 13: North America Aniline Derivatives Market Volume Share Analysis, by End-use, 2020, 2026, and 2031
Figure 14: North America Aniline Derivatives Market Attractiveness, by End-use
Figure 15: North America Aniline Derivatives Market Volume Share Analysis, by Country, 2020, 2026, and 2031
Figure 16: North America Aniline Derivatives Market Attractiveness, by Country
Figure 17: Europe Aniline Derivatives Market Volume Share Analysis, by Derivative, 2020, 2026, and 2031
Figure 18: Europe Aniline Derivatives Market Attractiveness, by Derivative
Figure 19: Europe Aniline Derivatives Market Volume Share Analysis, by Application, 2020, 2026, and 2031
Figure 20: Europe Aniline Derivatives Market Attractiveness, by Application
Figure 21: Europe Aniline Derivatives Market Volume Share Analysis, by End-use, 2020, 2026, and 2031
Figure 22: Europe Aniline Derivatives Market Attractiveness, by End-use
Figure 23: Europe Aniline Derivatives Market Volume Share Analysis, by Country and Sub-region, 2020, 2026, and 2031
Figure 24: Europe Aniline Derivatives Market Attractiveness, by Country and Sub-region
Figure 25: Asia Pacific Aniline Derivatives Market Volume Share Analysis, by Derivative, 2020, 2026, and 2031
Figure 26: Asia Pacific Aniline Derivatives Market Attractiveness, by Derivative
Figure 27: Asia Pacific Aniline Derivatives Market Volume Share Analysis, by Application, 2020, 2026, and 2031
Figure 28: Asia Pacific Aniline Derivatives Market Attractiveness, by Application
Figure 29: Asia Pacific Aniline Derivatives Market Volume Share Analysis, by End-use, 2020, 2026, and 2031
Figure 30: Asia Pacific Aniline Derivatives Market Attractiveness, by End-use
Figure 31: Asia Pacific Aniline Derivatives Market Volume Share Analysis, by Country and Sub-region, 2020, 2026, and 2031
Figure 32: Asia Pacific Aniline Derivatives Market Attractiveness, by Country and Sub-region
Figure 33: Latin America Aniline Derivatives Market Volume Share Analysis, by Derivative, 2020, 2026, and 2031
Figure 34: Latin America Aniline Derivatives Market Attractiveness, by Derivative
Figure 35: Latin America Aniline Derivatives Market Volume Share Analysis, by Application, 2020, 2026, and 2031
Figure 36: Latin America Aniline Derivatives Market Attractiveness, by Application
Figure 37: Latin America Aniline Derivatives Market Volume Share Analysis, by End-use, 2020, 2026, and 2031
Figure 38: Latin America Aniline Derivatives Market Attractiveness, by End-use
Figure 39: Latin America Aniline Derivatives Market Volume Share Analysis, by Country and Sub-region, 2020, 2026, and 2031
Figure 40: Latin America Aniline Derivatives Market Attractiveness, by Country and Sub-region
Figure 41: Middle East & Africa Aniline Derivatives Market Volume Share Analysis, by Derivative, 2020, 2026, and 2031
Figure 42: Middle East & Africa Aniline Derivatives Market Attractiveness, by Derivative
Figure 43: Middle East & Africa Aniline Derivatives Market Volume Share Analysis, by Application, 2020, 2026, and 2031
Figure 44: Middle East & Africa Aniline Derivatives Market Attractiveness, by Application
Figure 45: Middle East & Africa Aniline Derivatives Market Volume Share Analysis, by End-use, 2020, 2026, and 2031
Figure 46: Global Aniline Derivatives Market Attractiveness, by End-use
Figure 47: Middle East & Africa Aniline Derivatives Market Volume Share Analysis, by Country and Sub-region, 2020, 2026, and 2031
Figure 48: Middle East & Africa Aniline Derivatives Market Attractiveness, by Country and Sub-region
Copyright © Transparency Market Research, Inc. All Rights reserved
Trust Online

Aniline Derivatives Market